Int. J. Big Data Intelligence, Vol. 1, Nos. 1/2, 2014
89
D-CEP4CMA: a dynamic architecture for cloud performance monitoring and analysis via complex event processing Afef Mdhaffar* Department of Mathematics and Computer Science, University of Marburg, Hans-Meerwein-Str. 3, D-35032 Marburg, Germany Fax: +49-6421-28-21-573 and ReDCAD Laboratory, National School of Engineers of Sfax, University of Sfax, B.P. 1173, 3038 Sfax, Tunisia Fax: +216-74-275595 E-mail:
[email protected] *Corresponding author
Riadh Ben Halima and Mohamed Jmaiel ReDCAD Laboratory, National School of Engineers of Sfax, University of Sfax, B.P. 1173, 3038 Sfax, Tunisia Fax: +216-74-275595 E-mail:
[email protected] E-mail:
[email protected]
Bernd Freisleben Department of Mathematics and Computer Science, University of Marburg, Hans-Meerwein-Str. 3, D-35032 Marburg, Germany Fax: +49-6421-28-21-573 E-mail:
[email protected] Abstract: This paper presents a dynamic monitoring and analysis architecture for Cloud computing environments. It collects and analyses Cloud parameters to detect performance degradations. The proposed dynamic architecture, called D-CEP4CMA, is based on the methodology of complex event processing (CEP). It is designed to dynamically switch between different centralised and distributed CEP architectures depending on the load/memory of the CEP machine and network traffic conditions in the observed cloud environment. Experimental results demonstrate the efficiency of D-CEP4CMA and its performance in terms of precision and recall in comparison to centralised and distributed CEP architectures. Keywords: Cloud computing; complex event processing; CEP; performance analysis; dynamic architecture; big data intelligence. Reference to this paper should be made as follows: Mdhaffar, A., Halima, R.B., Jmaiel, M. and Freisleben, B. (2014) ‘D-CEP4CMA: a dynamic architecture for cloud performance monitoring and analysis via complex event processing’, Int. J. Big Data Intelligence, Vol. 1, Nos. 1/2, pp.89–102.
Copyright © 2014 Inderscience Enterprises Ltd.
90
A. Mdhaffar et al. Biographical notes: Afef Mdhaffar received her Engineering degree and MSc from the National Engineering School of Sfax, Tunisia in 2007 and 2009, respectively. She is a full time researcher in the Department of Mathematics and Computer Science at the University of Marburg, Germany and PhD candidate at the National Engineering School of Sfax, Tunisia. She focuses on self-architectures applied to cloud computing environments. Riadh Ben Halima received his MSc in Computer Science from the University of Sfax, Tunisia in 2004 and PhD in Computer Science from Paul Sabatier University, Toulouse, France in 2009. He is an Associate Professor in the National Engineering School of Sfax. He is also an Associate Researcher at ReDCAD Laboratory, Sfax, Tunisia. His fields of interest are distributed adaptive software, QoS provisioning, and dynamic software architecture management. Mohamed Jmaiel received his Diploma of Engineer in Computer Science from Kiel (Germany) University in 1992 and PhD from the Technical University of Berlin in 1996. He joined the National School of Engineers of Sfax (Tunisia) as an Assistant Professor of Computer Science in 1995. He became a Full Professor in 2009. His current research areas include software engineering of distributed systems, formal methods in model-driven architecture, component-oriented development, self-adaptive and pervasive systems, and autonomic middleware. He has published more than 100 regular and invited papers in international conferences and journals. Bernd Freisleben received his MSc in Computer Science from Pennsylvania State University, State College, PA in 1981, and PhD and Habilitation in Computer Science from Darmstadt University of Technology, Germany in 1985 and 1993, respectively. He is a Full Professor of Computer Science in the Department of Mathematics and Computer Science, University of Marburg, Marburg, Germany. His current research interests include cloud computing, computation- and data-intensive applications, and IT security. This paper is a revised and expanded version of a paper entitled ‘A dynamic complex event processing architecture for cloud monitoring and analysis’ presented at the 5th International Conference on Cloud Computing Technology and Science, Bristol, UK, 2–5 December 2013.
1
Introduction
Performance problems are quite likely in Cloud environments, due to the potentially large number of users accessing the Cloud, and the different types of computations and data processing activities running in the Cloud. Therefore, it is important to monitor and analyse Cloud performance parameters to detect performance degradations and launch suitable recovery actions. Cloud performance monitoring and analysis are challenging tasks that require sophisticated methodologies, such as complex event processing (CEP). CEP (Cugola and Margara, 2012) systems can process many incoming event streams and execute suitable analysis queries continuously to analyse the behaviour of a Cloud. Related CEP monitoring and analysis approaches (Li et al., 2013; Teixeira et al., 2010; Narayanan et al., 2011; Dyk, 2010; Baresi and Guinea, 2013; Leitner et al., 2012; Grell and Nano, 2008; Balis et al., 2010; Pietzuch et al., 2006; Cugola and Margara, 2013; Srivastava et al., 2005; Bonfils and Bonnet, 2003; Abadi et al., 2005) can be divided into three categories. The first category is based on a single CEP engine, while the second category is based on a distributed architecture of CEP engines. The third category utilises distributed CEP engines that split CEP queries into subqueries and execute them on many nodes. Each category has some disadvantages. In existing approaches based on a single CEP engine (Li et al., 2013; Teixeira et al., 2010; Narayanan et al., 2011), the CEP engine itself represents a
single point of failure. Moreover, a single CEP engine could easily become a bottleneck if the amount of monitored data exceeds the processing capacities of the CEP engine. On the other hand, distributed CEP architectures (Dyk, 2010; Baresi and Guinea, 2013; Leitner et al., 2012; Balis et al., 2010) suffer from the potentially large number of messages exchanged between the distributed CEP engines. Finally, distributed CEP engines (Pietzuch et al., 2006; Cugola and Margara, 2013; Srivastava et al., 2005; Bonfils and Bonnet, 2003; Abadi et al., 2005) based on rule splitting raise several issues, such as the operator placement problem which is difficult to solve. In this paper, we propose a novel dynamic architecture for Cloud performance monitoring and analysis based on CEP. We call it D-CEP4CMA for ‘dynamic complex event processing for Cloud monitoring and analysis’. The basic idea is to dynamically switch between different CEP architectures depending on the current conditions of the observed Cloud environment. D-CEP4CMA is deduced from an experimental study of three different CEP architectures for Cloud monitoring and analysis, a centralised one and two distributed ones, presented in previous work (Mdhaffar et al., 2013). To evaluate our proposal, three groups of experiments have been conducted. The first set of experiments shows that the time needed to switch between two CEP architectures is negligible. The second set of experiments illustrates the merits of D-CEP4CMA in terms of precision and recall in comparison to centralised and distributed CEP
D-CEP4CMA: a dynamic architecture for cloud performance monitoring and analysis architectures. The last set of experiments investigates the impact of D-CEP4CMA on the machine running the CEP engine. The results indicate that our dynamic architecture does not overload the machine hosting the CEP engine. The paper is organised as follows. Section 2 discusses related work. In Section 3, the dynamic CEP architecture (D-CEP4CMA) is presented. Our experimental results are detailed in Section 4. Section 5 concludes the paper and outlines areas for future research.
2
Related work
Li et al. (2013) propose a CEP-based monitoring system for Cloud computing environments. The defined system makes use of four components: 1
the basic event Cloud
2
the CEP engine
3
the action part
4
the database.
The basic event Cloud is used to monitor Cloud computing systems. The CEP engine, based on the database, implements the detection algorithm and triggers alarms when an unhealthy situation is detected. The action part executes the adequate action to solve detected issues. In contrast to our approach, the proposed system (Li et al., 2013) is based on a single CEP engine that might become a bottleneck in the context of large scale Cloud environments. Teixeira et al. (2010) propose a monitoring approach for internet service provider (ISP) data centres. The proposed approach is called HOLMES and is based on a single CEP engine. The CEP engine executes analysis queries to detect failures. These queries get the observed data of the monitoring sensors as inputs, process them and generate alarms when an anomaly is detected. This implies that the architecture of HOLMES is centralised, which suffers from the bottleneck and single point of failure issues in the case of large scale systems. Contrary to HOLMES, our approach is based on a dynamic CEP architecture that activates the most suitable design (distributed or centralised) according to the current context. Narayanan et al. (2011) define a monitoring and analysis framework for datacenters. The proposed framework is based on CEP techniques. It consists of three main components. The first component is in charge of monitoring the datacenters. In particular, it monitors the storage, servers, network and applications. The second component, called event collector engine, allows to 1
collect the monitored data
2
send it to the CEP engine, which is the third component of the monitoring framework.
The CEP engine correlates the incoming events via the execution of intelligent analysis rules. The framework utilises a single CEP engine. Therefore, it suffers from the
91
bottleneck issue in the context of large scale Cloud environments. Leitner et al. (2012) propose a monitoring and analysis approach for Cloud applications. Their approach is integrated within the ‘CloudScale’ framework, and allows to track the application performance. The presented approach (Leitner et al., 2012) makes use of several CEP engines organised in a hierarchical fashion. The authors define three correlation levels that are processed by three different CEP engines. The first level concerns ‘host correlation’, and it is realised by the first involved CEP engine. Its results are sent to the second CEP engine that accomplishes ‘resource correlation’. The results of the ‘resource correlation’ CEP engine are forwarded to a third CEP engine that is in charge of ‘application correlation’. The approach generates considerable network traffic, due to the large number of messages exchanged between the different CEP engines, as shown by the experiments performed by the authors. Baresi and Guinea (2013) propose an event correlation middleware, called ECoWare. It is a distributed event correlation and aggregation framework for multi-layer monitoring, and it uses two cooperating CEP engines. ECoWare consists of several components that communicate via a publish/subscribe system (Siena). In a large scale Cloud infrastructure, it is likely that the number of messages exchanged between these components in ECoWare will increase significantly. Dyk (2010) presents a distributed monitoring and analysis architecture based on CEP engines. He illustrates the disadvantages of such architectures, in particular that distributed CEP architectures suffer in general from a synchronisation problem. In contrast to our approach, Dyk does not compare a centralised and a distributed approach, and does not propose a dynamic approach for CEP design. Grell and Nano (2008) discuss issues related to large scale internet services monitoring via CEP. They propose two different CEP architectures, a centralised and a distributed CEP architecture. The work indicates that the choice of the CEP architecture depends on the requirements of the monitored system. The approach is not useful for Cloud monitoring and analysis, due to the dynamicity of a Cloud environment. Therefore, we propose a dynamic CEP architecture. Balis et al. (2010) propose a CEP-based approach for real-time grid monitoring. The proposed approach is called GEMINI2. It is based on a distributed CEP architecture. GEMINI2 (Balis et al., 2010) makes use of three main components: sensors, monitors and clients. Each sensor incorporates a CEP engine. It generates simple events that describe the state of grid components. The sensors allow to reduce the number of events via the use of reduction rules. The monitors are based on CEP engines. They run the main analysis rules. The clients generate complex events by subscribing to monitors. GEMINI2 may overload the virtual machines, since it assigns a CEP engine to every sensor. Moreover, it could introduce a high network traffic in the context of Cloud computing environments.
92
A. Mdhaffar et al.
Borealis (Abadi et al., 2005) is a distributed stream processing engine. It splits queries into subqueries and executes them on several nodes. Borealis can be used to efficiently execute queries, while ensuring the dynamic revision of query results. Moreover, it includes fault tolerance mechanisms. SBON (Pietzuch et al., 2006) is a stream-based overlay network. It solves the operator placement issue by including a layer between the stream processing system and the physical network. SBON (Pietzuch et al., 2006) is based on two mechanisms for managing operator placement: 1
a cost space metric that evaluates the routing cost between nodes
2
a relaxation placement algorithm that is based on a spring relaxation technique to manage single and multi-query optimisation.
SBON has been integrated into Borealis (Abadi et al., 2005) to enhance the operator placement strategy. The cost space and the spring relaxation mechanisms can be improved to include more decision metrics and deal with more complex queries, respectively. In contrast to our approach, Borealis (Abadi et al., 2005) and SBON (Pietzuch et al., 2006) are based on query splitting mechanisms. Therefore, they suffer from the operator placement issue that requires additional efforts to be solved. Cugola and Margara (2013) provide an experimental evaluation of five deployment strategies for distributed CEP engines, including the centralised one. The authors assess the merits and disadvantages of all presented strategies, while using the Tesla language and the T-Rex CEP engine. All presented distributed CEP engines are based on rule splitting and operator placement mechanisms. Srivastava et al. (2005) address the operator placement problem for in-network processing of queries with expensive filters. They define a new algorithm that can find the optimal Figure 1
placement of an operator with less cost, for a multi-way stream join together with filters. As stated by the authors, the proposed algorithm could fail to find the best placement of the operator. Bonfils and Bonnet (2003) propose an adaptive and decentralised algorithm to deal with the operator placement problem for in-network query processing. The proposed algorithm is based on the neighbour exploration technique. It allows to continuously refine the placement of an operator by exploring neighbours. The placement decision is taken at the level of each operator. The three approaches (Cugola and Margara, 2013; Srivastava et al., 2005; Bonfils and Bonnet, 2003) are based on rule splitting mechanisms and try to solve the operator placement issue, which is still considered as a challenging task and consequently difficult to solve. However, our approach does not have to deal with such kind of issues, since it is not based on rule splitting.
3
A dynamic CEP approach for Cloud performance monitoring and analysis
This section presents our dynamic CEP approach for Cloud performance monitoring and analysis, called D-CEP4CMA. D-CEP4CMA dynamically switches between different CEP architectures. First, we outline its general architecture. Second, we present the CEP architectures involved in the D-CEP4CMA life cycle. Finally, we describe the D-CEP4CMA algorithms that allow us to switch between the different CEP architectures.
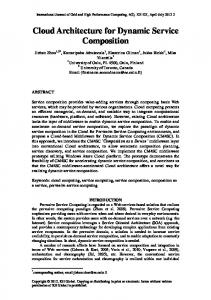
3.1 The D-CEP4CMA architecture Figure 1 shows the architecture of D-CEP4CMA. It consists of two main components: a multi-layer monitoring component and a CEP(s)-based analysis module.
The architecture of D-CEP4CMA (see online version for colours)
D-CEP4CMA: a dynamic architecture for cloud performance monitoring and analysis The multi-layer monitoring component makes use of four monitoring modules. The first one, called S_Monitor, collects performance metrics related to the software layer. S_Monitor is based on AOP4CSM (Mdhaffa et al., 2011): an aspect-oriented monitoring tool for software-as-a-services (SaaS) parameters (like the execution and the communication times of a service). Axis and its related web services represent our software layer. The second one is P_Monitor. It gathers platform layer metrics. In our use case, the Java Virtual Machine (JVM) and Apache Tomcat constitute our platform layer. For this purpose, we have implemented the JVMSensor tool to collect related parameters. JVMSensor is based on Jconsole (http://www.openjdk.java.net/tools/svc/jconsole/). The third monitoring module, called VI_Monitor, collects virtual infrastructure parameters, in our case from Xen virtual machines. It makes use of Ganglia (http://www.ganglia.sourceforge.net) (Massie et al., 2004), IoStat (http://www.linux.die.net/man/1/iostat) and MpStat (http://www.linux.die.net/man/1/mpstat). The last one is PI_Monitor. It gathers Physical Infrastructure metrics. PI_Monitor is based on Ganglia (Massie et al., 2004), IoStat, MpStat and Xenmon (Gupta et al., 2005), since we use the Xen hypervisor (von Hagen, 2008). The multi-layer monitoring component sends the collected data to the CEP engine(s) in our dynamic CEP architecture. CEP is a relatively new paradigm based on the principles of publish-subscribe systems (Cugola and Margara, 2012). CEP can be used to monitor, process and analyse elementary events to deduce complex events, describing the state of the monitored system. A CEP engine executes continuously running queries on incoming event streams; these queries are the analysis rules to monitor the behaviour of a Cloud environment. In this work, we use Esper (http://esper.codehaus.org/) as our CEP implementation. It is written in Java and implements rules as Event Processing Language (EPL) queries. The CEP engines, the main component of D-CEP4CMA, implement and process our performance analysis rules. The particular rules are based on a statistical analysis of the relationships between the gathered performance parameters on the different layers. In this paper, we only give two examples of analysis rules [see rules (1) and (2)], since the rules are not Figure 2
93
relevant in the context of our present work. The rules are described in another paper (Mdhaffar et al., 2014) and given at (http://www.redcad.org/members/mdhaffar/ cep4cma/Fishbone.html). All rules run in the Esper CEP engine. R2 (Tcom ↑, V − BytesIn ↓ Or V − BytesOut ↓, IOReqDisk ↑ // Internal Failure, Physical layer ,
(1)
Many VMs accessing the disk )
The presented rules [see rule (1) and (2)] allow us to detect a performance problem [i.e., a degradation of the communication and/or execution time(e)] related to high disk activities. R1 (Texec ↑, P − Load ↑, IOReqDisk ↑ // Internal Failure, Physical layer , Many VMs accessing the disk )
(2)
These rules [(1) and (2)] have been deduced from the relationships between the different performance metrics. As previously mentioned, D-CEP4CMA dynamically switches between different CEP architectures. The used CEP architectures are described in the next section.
3.2 The CEP architectures In this section, three CEP architectures for Cloud monitoring and analysis, a centralised architecture relying on a single CEP engine and two distributed architectures based on a set of cooperating CEP engines, are presented.
3.2.1 A centralised CEP architecture Figure 2 shows our centralised architecture for Cloud monitoring and analysis. It is based on a single CEP engine. The CEP engine processes all monitored data and detects failures in the Cloud using our analysis rules. The analysis rules are implemented as EPL queries within the Esper CEP engine.
The centralised CEP architecture (see online version for colours)
94
A. Mdhaffar et al.
The centralised CEP architecture suffers from two principal problems: a
it has to process a potentially large number of events and thus may become bottleneck
b
it represents a single point of failure.
Therefore, it is not suitable for large Cloud computing environments. Consequently, D-CEP4CMA involves two other distributed CEP architectures to deal with the case of large Clouds. They are presented below.
3.2.2 Distributed CEP architectures Figures 4 and 5 show two distributed CEP architectures for Cloud monitoring and analysis. They rely on ‘many’ CEP engines instead of a single one. The used CEP engines have two different roles and are able to communicate with each other. The first role is called ‘CEP manager’. It is taken by the CEP engine that processes the main analysis rules1. Depending on the size of the Cloud, the distributed CEP architectures make use of one or several CEP managers(s). If several CEP managers are present, each CEP manager is responsible for a particular set of physical Cloud machines, and each of them operates independently without communicating with other CEP managers. The second role is called ‘CEP worker’. It is played by the rest of CEP engines. The CEP workers have two main tasks. First, they share the analysis tasks. Second, they filter events and only send pertinent events to the CEP manager. The first task is related to the distributed nature of the analysis, i.e., the monitoring data is not sent to a single CEP, but to many cooperative CEP workers. The second task concerns the functionality of filtering events. It is based on our Outlier Detector approach. When a CEP worker detects an outlier, it Figure 3
The outlier detector (see online version for colours)
notifies the rest of CEP workers and the monitoring sensors. The latter send data to the CEP manager(s). The Outlier Detector approach is presented below.
3.2.2.1 The outlier detector The outlier detector (see Figure 3) is based on robust statistics to calculate the z-score and detect outliers. Its life cycle consists of two phases. The first phase is the training period. During this phase, the outlier detector computes the values of the median and the mean absolute deviation (MAD) of its inputs. To calculate the median of a set of n values (xi), we sort them and calculate x n2+1 if n is odd, and xn /2 + xn/2+1 2
if n is even (Rousseeuw and Hubert, 2011). The
MAD is the median of all absolute deviations, multiplied by a corrective coefficient [see formula (3)] (Rousseeuw and Hubert, 2011). The median and the MAD are more robust against outliers than the mean and the standard deviation (SD), respectively (Rousseeuw and Hubert, 2011).
( ) j =1..n
MAD = 1.483 ∗ mediani =1..n xi − median x j
(3)
The second phase is used to compute the z-score of the incoming monitored data (xi). The z-score of xi is the difference between xi and the median, divided by the MAD [see formula (4)] (Rousseeuw and Hubert, 2011). z -score =
( ) j =1..n
xi − median x j MAD
(4)
D-CEP4CMA: a dynamic architecture for cloud performance monitoring and analysis The z-score indicates whether the new incoming monitored value xi is an outlier. In fact, if the absolute value of the z-score exceeds 3, then xi is an outlier. Otherwise, xi is an acceptable value (Daszykowski et al., 2007). If (|z-score| < 3), the outlier detector computes the mean and the standard deviation, while using the new incoming value and the old computed median and MAD. We use the mean and the standard deviation in the second phase, since we are sure that the used values are not outliers. The use of robust statistical metrics (like the median and MAD) during the first phase is required, since outliers could often appear during the training period. However, it is more significant to use traditional statistical metrics during the second phase, since we are sure that all values, used to calculate the mean and the standard deviation, are not outliers. In fact, during the second phase we calculate the z-score of every new incoming data xi, and check whether xi is an outlier. If xi is not an outlier, we use it to update the mean and the standard deviation. Otherwise, we keep the old values of the mean and the standard deviation (see Figure 3). Moreover, the mean and the standard deviation are more precise than the median and the MAD, respectively, in the absence of outliers. The two distributed CEP architectures make use of the Outlier Detector. Their design and functionality are described below.
Figure 4
95
3.2.2.2 Design I Figure 4 shows the first distributed CEP architecture based on multiple CEP engines. It is called ‘Design I’ in the remainder of this paper. Design I assigns a CEP worker to every Cloud machine (physical and virtual): one CEP worker per Cloud machine. The CEP workers are running on all physical and virtual machines of the Cloud. They communicate with the monitoring sensors (S) and their CEP worker neighbours. First, the sensors send the values of the monitored metrics to the CEP workers. Since the CEP workers implement the outlier detector, they process the received data and check whether there are outliers. If a CEP worker detects an outlier, it first sends the recorded data (at instant ti) to the CEP manager, which is in charge of processing our performance analysis rules. Second, it notifies its CEP worker neighbours to ask them to send the last monitored data (recorded at ti) to the CEP manager. Third, the CEP worker notifies the sensors and asks them to send the next N data values to the CEP manager who processes the main analysis rules (see Figure 4). N depends on the used analysis rules. It indicates how often the symptoms should be observed to detect an unwanted situation. Therefore, N represents the number of required data values to process the analysis queries. Design I makes use of a few outlier detectors, related to pertinent metrics, and implements a selection algorithm that allows to only send pertinent data, regarding the detected outlier.
The distributed CEP architecture: Design I (see online version for colours)
96
A. Mdhaffar et al.
Figure 5
The distributed CEP architecture: Design II (see online version for colours)
3.2.2.3 Design II Figure 5 depicts the second distributed architecture, called Design II. It involves less CEP workers: one CEP worker per physical node. The CEP worker processes data coming from the physical node and its virtual machines. If one of the CEP workers detects an outlier, it sends and asks sensors/CEP workers neighbours to send monitored data to the CEP manager, as in Design I. Design II assigns outlier detectors to pertinent metrics, and implements a selection algorithm to send selected data to the CEP manager. The centralised architecture, Design I and Design II have been experimentally evaluated in previous work (Mdhaffar et al., 2013). The evaluation was based on: •
quality analysis metrics, such as precision and recall
•
performance indicators, such as load and network communication, of the Cloud machines
•
performance indicators of the CEP manager, such as the load and the memory of its hosting machine.
The choice of these evaluation criteria is partially based on the relationships between them and the Cloud size. Indeed, the CEP manager machine memory and load metrics depend on the volume of events (i.e., monitoring results) processed by the CEP manager. The volume of these events is highly
related to the Cloud size. In fact, the number of monitored events increases when the number of Cloud machines increases. The lessons learned from the experimental evaluation (Mdhaffar et al., 2013) can be summarised as follows: •
The centralised architecture is a single point of failure, but it gives good results in terms of precision and recall. The centralised architecture is also more efficient than the distributed architectures, since it neither saturates the network nor the virtual machines. Thus, a centralised architecture should be used when a single CEP engine is able to handle all received data.
•
A distributed architecture is more efficient than the centralised CEP architecture for large scale Cloud environments.
The evaluation results illustrate that from a performance point of view, we should not use a distributed CEP architecture, if a centralised CEP architecture could solve the problem. They also indicate that we have to migrate to a distributed architecture, if the amount of data to be processed by the CEP engine exceeds its capacities, in terms of load and used memory. These conclusions have been used to propose the dynamic CEP architecture algorithms presented below.
D-CEP4CMA: a dynamic architecture for cloud performance monitoring and analysis Figure 6
97
D-CEP4CMA algorithm: scale up
3.2.3 Algorithms for a dynamic CEP architecture The basic idea of our dynamic architecture is to take profit of the centralised and distributed architectures and avoid their disadvantages, while choosing the most suitable design. It is mainly based on the scale up and scale down algorithms shown in Figures 6 and 7, to decide whether to activate particular architectural components. The scale up algorithm (see Figure 6) allows us to choose the suitable architectural design when the size of the Cloud goes up. It starts with a centralised CEP architecture relying on a single CEP engine. The scale up algorithm periodically checks whether the single CEP engine is overloaded, by comparing the load and the free memory of the physical machine hosting the CEP engine to the upper thresholds. If it is overloaded (in terms of memory or load), the algorithm switches to Design II, and activates the required number of components for Design II. It then checks whether Design II leads to an overloaded physical machine hosting the CEP manager. If this is the case, the algorithm switches to Design I and activates the selection algorithm. Otherwise, the algorithm checks the network state by comparing bytes in/out to an adequate threshold. Actually, we measure the average of the bytes in/out of the Cloud machines to assess the network state of the Cloud. If
the network state is acceptable, then the algorithm keeps Design II. Otherwise, it divides the physical Cloud machines into two groups and starts a new CEP manager for the new group, following the centralised design. In the case the algorithm has migrated to Design I, it checks the network state by measuring the bytes In/Out. If the network state is acceptable, it keeps Design I. In the opposite case, it switches to Design II, partitions the physical Cloud machines into two groups and activates a new CEP manager for the new group. The partitioning process is based on two key parameters: CEP_Id and Part_Id. CEP_Id identifies the CEP manager. It is equal to the IP address of its hosting machine. Every Cloud machine is identified by (CEP_Id, Part_Id), while Part_Id designates the partition number. It is either equal to 1 or to 2. If the switching algorithm decides to partition the Cloud machines into two groups, the machines with Part_Id equal to 2 will be assigned to the new CEP manager. Their CEP_Id value is equal to the IP address of the machine hosting the new CEP manager. The set of machines assigned to the old/new CEP manager are divided into two groups. The Part_Id of the first group is equal to 1, while the Part_Id of the second group is equal to 2.
98 Figure 7
A. Mdhaffar et al. D-CEP4CMA algorithm: scale down
The scale down algorithm allows us to choose the suitable architectural design when the size of the Cloud goes down. It periodically checks whether the number of used CEP managers is greater than 1. If only one CEP manager is used, the algorithm checks whether the centralised design is currently adopted. If the centralised design is not adopted, the scale down algorithm checks whether the CEP manager machine is under-used, by comparing the load and free memory values to the lower thresholds. If the CEP manager machine is under-used, the algorithm migrates to the centralised design. Otherwise, it keeps the current design. If there are many CEP managers (more than one), the scale down algorithm checks the load and the free memory values of all used CEP manager machines. If it detects that there are under-used CEP manager machines, our scale down algorithm checks their currently adopted design. If there is more than one CEP manager following the centralised design, our scale down algorithm replaces all pairs of CEP managers by a single CEP manager. If the centralised design was not adopted, the scale down algorithm migrates to the centralised design.
We use Ganglia to measure the load and the free memory metrics of the machine hosting the CEP manager. The load and the free memory thresholds are defined as follows. In both cases, the upper thresholds are equal to the sum of the corresponding mean value and the standard deviation. The lower threshold of the load is equal to the minimum (observed) value of the load minus the standard deviation. The lower threshold of the memory is equal to the maximum (observed value) of the memory plus the standard deviation. The mean, the minimum, the maximum and the standard deviation are obtained by measuring the load and free memory values of the machine running the CEP manager in normal conditions. The checking period depends on: •
the size of the Cloud
•
the frequency of receiving monitoring data
•
the user preferences.
D-CEP4CMA: a dynamic architecture for cloud performance monitoring and analysis A short checking period implies a faster decision. However, a long period leads to a more accurate decision. It should be pointed out that the D-CEP4CMA algorithms (scale up and scale down) stop their operations for a period of time (WT) when a new CEP architecture is selected. This allows us to test the efficiency of the newly selected CEP architecture. If the performance indicators of the CEP manager have improved after the end of the WT period, then the selected CEP architecture is the best one for this Cloud and should be kept until the size of the Cloud changes. Otherwise, the D-CEP4CMA algorithms resume their search for a suitable CEP architecture. The WT period is the time needed by the machine running the CEP manager to reach its normal behaviour after a degradation of its performance parameters. In our work, we have experimentally measured the WT period.
4
Experimental evaluation
This section describes the testbed and the conducted experiments for evaluating D-CEP4CMA.
4.1 Testbed Figure 8 shows the used test bed. It consists of five physical machines. One of them is used as the Cloud controller. It has a 64-bit CPU, with 250 GB of disk, and 16 GB of RAM. The four remaining machines play the role of compute nodes. They host the virtual machines (instances). Each compute machine has a 64-bit CPU, with 250 GB of disk, and 32 GB of RAM. The Ubuntu Server 12.04 TLS is used as the operating system of the physical machines. We have installed the OpenStack Cloud Platform (Folsom release) on the physical machines, to create and manage our private Figure 8
The Testbed (see online version for colours)
99
Cloud environment. The used virtualisation technology is Xen Server. We have created an image satisfying the requirements of our use case, and uploaded it to our OpenStack platform. The created image is based on the Ubuntu Cloud image. We launched 80 virtual machines (instances), using OpenStack Horizon. Each compute machine hosts 20 virtual machines (VMs). Each VM has one virtual CPU and 1 GB of RAM, with 8 GB of disk. The CEP workers are running on the Cloud components (compute nodes and virtual machines). The CEP manager is running on a separate machine. It has a 64-bit CPU, with 4 GB of RAM and 140 GB of disk. The CEP manager machine is running under an Ubuntu Server 12.04 TLS.
4.2 Experiments The conducted experiments are partitioned into three groups. The first group is concerned with measuring the time (IT) when D-CEP4CMA stops operating to switch between two CEP architectures, called the inactivity time of D-CEP4CMA. The second group of experiments evaluates D-CEP4CMA in terms of precision and recall. The last group of experiments evaluates the impact of D-CEP4CMA on the machine running the CEP manager in terms of computational load and used memory.
4.2.1 Inactivity time of D-CEP4CMA To evaluate the inactivity time, we run D-CEP4CMA for one hour, while varying the number of physical machines composing the Cloud (1 .. 4). The first experiment was performed with a single Cloud machine (i.e., 20 virtual machines). The centralised CEP architecture was kept until the end of this experiment. Therefore, the inactivity time is equal to 0.
100
A. Mdhaffar et al.
In the second experiment, we added a second machine to the Cloud. We noticed that D-CEP4CMA turned the centralised CEP architecture off after five minutes, and replaced it by Design II. The latter was kept until the end of the experiment. The inactivity time was about seven seconds. The third experiment was performed with three Cloud machines (i.e., 60 virtual machines). Like before, D-CEP4CMA migrated to Design II after five minutes. However, D-CEP4CMA did not keep Design II until the end of the experiment. It switched to Design I 23 minutes later. Then, Design I was kept until the end of this experiment. The inactivity time is the sum of
where TP is the number of true positives (correct alarms); and FP is the number of false positives (false alarms). The recall is defined as the ratio of correct alarms to the number of true failures [see formula (6)]. It represents the probability of detecting true failures.
Recall =
TP (Salfner et al., 2010) TP + FN
(5)
a
the time needed to switch to Design II
where FN is the number of false negatives (missed alarms). Our comparison between the different CEP architectures (D-CEP4CMA, centralised architecture, Design I and Design II) is based on studying them separately in the same conditions. For each CEP architecture, we
b
the time spent to migrate to Design I.
a
injected 30 I/O failures on the virtual machines
b
observed the behaviour of each architecture by measuring the number of true alarms, false alarms and missing alarms.
The inactivity time recorded in this experiment was about 20 seconds. In the last experiment, our Cloud testbed consisted of four physical machines (i.e., 80 virtual machines). The observed behaviour of D-CEP4CMA was similar to the third experiment. D-CEP4CMA migrated to Design II 2 minutes after the start of the experiment. Then, Design II was adopted by D-CEP4CMA for the next 22 minutes. Afterwards, DCEP4CMA decided to migrate to Design I. The inactivity time was around 22 seconds. These experiments indicate that the highest value of the inactivity time is about 22 seconds. This value is negligible, in comparison to the duration of the experiment (one hour).
4.2.3 Impact of D-CEP4CMA on the machine of the CEP manager
4.2.2 D-CEP4CMA: precision/recall To assess the merits of D-CEP4CMA, we compare it to the centralised architecture, Design I and Design II, in terms of precision and recall. The precision expresses the ability of the CEP architectures to generate correct alarms. It is determined by calculating the ratio of the number of true alarms to the number of all alarms [see formula (5)]. Precision = Table 1
TP (Salfner et al., 2010) TP + FP
The I/O failures were injected via the use of Dbench (http://www.dbench.samba.org/). Dbench is a benchmark that produces I/O load: It launches concurrent clients that conduct I/O tasks. The obtained results are summarised in Table 1. It indicates that D-CEP4CMA achieves the same results as the Centralised Architecture in terms of recall and precision. However, it does not suffer from its disadvantages in terms of becoming a bottleneck and a single point of failure.
(5)
The third group of experiments allows us to compare the performance impact of DCEP4CMA on the machine running the CEP manager to the other CEP architectures (centralised architecture, Design I and Design II). For this purpose, we executed the analysis functionality in the different CEP architectures in normal conditions for one hour, and we measured the load and the free memory of the physical machine hosting the CEP manager.
Evaluation of CEP architectures
Centralised architecture
Design I
Design II
D-CEP4CMA
TP
25
25
23
25
FP
3
2
4
3
FN
5
5
7
5
Precision
89.2%
92.5%
85.1%
89.2%
Recall
83.3%
83.3%
76.6%
83.3%
D-CEP4CMA: a dynamic architecture for cloud performance monitoring and analysis Figure 9 shows that D-CEP4CMA has a negligible impact on the machine running the CEP manager. The average load of the physical machine hosting the CEP manager in D-CEP4CMA is lower than the average load measured in the case of the centralised architecture and Design II. However, the average load of the physical machine hosting the CEP manager in Design I is slightly lower than the average load measured in the case of D-CEP4CMA. This is related to the D-CEP4CMA strategy. In fact, it uses a centralised CEP architecture during the first stages of its life cycle. This increases the average load of the machine hosting the CEP manager. Figure 9
Comparison of CEP architectures: CEP manager machine load (see online version for colours)
Figure 10 indicates that the machine running the CEP manager consumes less memory in the dynamic CEP architecture (D-CEP4CMA) and Design II. The average free memory of the CEP manager machine in D-CEP4CMA is lower than the average memory measured in the case of Design II. This is due to the D-CEP4CMA methodology. Actually, it uses a centralised design during its first phases. This leads to a decrease of the average free memory.
5
101
Conclusions
In this paper, a dynamic architecture for Cloud performance monitoring and analysis, called D-CEP4CMA, has been presented. It is based on the methodology of CEP. D-CEP4CMA has been designed to dynamically switch between different centralised and distributed CEP architectures depending on the current machine load and network traffic conditions in the observed Cloud environment. It perfectly fits to the elasticity property of Clouds, since it allows us to use the required number of CEP engines when new machines join/leave the Cloud. The conducted experiments have illustrated the merits ofD-CEP4CMA.The results have shown that the inactivity time is negligible, in comparison to the whole system life cycle. Moreover, they have indicated the performance of D-CEP4CMA in terms of precision and recall. Furthermore, our experimental results have demonstrated that the proposed dynamic architecture does not overload the machine running the CEP manager. There are several directions for future work. First, we plan to improve the switching mechanism of D-CEP4CMA to reduce the inactivity time. Second, we aim to evaluate the dynamic CEP architecture in a large scale Cloud environment. Finally, we plan to apply this architecture in the context of security monitoring and analysis and evaluate its results.
Acknowledgements This work is partly supported by the German Ministry of Education and Research (BMBF) and the German Academic Exchange Service (DAAD).
References Figure 10
Comparison of CEP architectures: CEP manager machine free memory (see online version for colours)
Abadi, D.J., Ahmad, Y., Balazinska, M., Cetintemel, U., Cherniack, M., Hwang, J-H., Lindner, W., Maskey, A., Rasin, A., Ryvkina, E. et al. (2005) ‘The design of the borealis stream processing engine’, in Proceedings of the CIDR Conference, Vol. 5, pp.277–289. Balis, B., Kowalewski, B. and Bubak, M. (2010) ‘Leveraging complex event processing for grid monitoring’, in R. Wyrzykowski, J. Dongarra, K. Karczewski and J. Wasniewski (Eds.): Parallel Processing and Applied Mathematics, Lecture Notes in Computer Science, pp.224–233. Baresi, L. and Guinea, S. (2013) ‘Event-based multi-level service monitoring’, in Proceedings of the 2013 IEEE 20th International Conference on Web Services, ICWS ‘13, pp.83–90, IEEE Computer Society, Washington, DC, USA. Bonfils, B.J. and Bonnet, P. (2003) ‘Adaptive and decentralized operator placement for innetwork query processing’, in Information Processing in Sensor Networks, Vol. 2634, pp.47–62, Springer.
102
A. Mdhaffar et al.
Cugola, G. and Margara, A. (2013) ‘Deployment strategies for distributed complex event processing’, Computing, Vol. 95, No. 2, pp.129–156. Cugola, G. and Margara, A. (2012) ‘Processing flows of information: from data stream to complex event processing’, ACM Computing Surveys, Vol. 44, No. 3, pp.1–62. Daszykowski, M., Kaczmarek, K., Heyden, Y.V. and Walczak, B. (2007) ‘Robust statistics in data analysis – a review: basic concepts’, Chemometrics and Intelligent Laboratory Systems, Vol. 85, No. 2, pp.203–219. Dyk, G. (2010) Grid Monitoring Based on Complex Event Processing Technologies, Masters thesis, University of Science and Technology in Krakow. Grell, S. and Nano, O. (2008) ‘Experimenting with complex event processing for large scale internet services monitoring’, 1st International workshop on Complex Event Processing for the Future. Gupta, D., Gardner, R. and Cherkasova, L. (2005) XenMon: QoS Monitoring and Performance Profiling Tool, Tech. rep., HP Labs. Leitner, P., Inzinger, C., Hummer, W., Satzger, B. and Dustdar, S. (2012) ‘Application-level performance monitoring of Cloud services based on the complex event processing paradigm’, Fifth IEEE International Conference on Service-Oriented Computing and Applications (SOCA), pp.1–8. Li, L., Cao, B. and Liu, Y. (2013) ‘A study on CEP-based system status monitoring in cloud computing systems’, in Proceedings of the 6th International Conference on Information Management, Innovation Management and Industrial Engineering, pp.300–203. Massie, M.L., Chun, B.N. and Culler, D.E. (2004) ‘The Ganglia distributed monitoring system: design, implementation, and experience’, Parallel Computing, Vol. 30, Nos. 5–6, pp.817–840. Mdhaffar, A., Halima, R.B., Jmaiel, M. and Freisleben, B. (2014) ‘CEP4CMA: multi-layer cloud performance monitoring and analysis via complex event processing’, in Proceedings of the International Conference on Networked Systems (Netys), Springer. Mdhaffar, A., Halima, R.B., Jmaiel, M. and Freisleben, B. (2013) ‘A dynamic complex event processing architecture for cloud monitoring and analysis’, in IEEE 5th International Conference on Cloud Computing Technology and Science, pp.270–275, IEEE Computer Society.
Mdhaffar, A., Halima, R.B., Juhnke, E., Jmaiel, M. and Freisleben, B. (2011) ‘AOP4CSM: an aspect-oriented programming approach for cloud service monitoring’, in Proceedings of the 11th IEEE International Conference on Computer and Information Technology, pp.363–370, IEEE Press. Narayanan, K., Bose, S.K. and Rao, S. (2011) ‘Towards ‘integrated’ monitoring and management of datacenters using complex event processing techniques’, in Proceedings of the Fourth Annual ACM Bangalore Conference, COMPUTE ‘11, pp.11:1–11:5, ACM, New York, NY, USA. Pietzuch, P., Ledlie, J., Shneidman, J., Roussopoulos, M., Welsh, M. and Seltzer, M. (2006) ‘Network-aware operator placement for stream-processing systems’, in Proceedings of the 22nd International Conference on Data Engineering, pp.49–60, IEEE. Rousseeuw, P.J. and Hubert, M. (2011) ‘Robust statistics for outlier detection.’, Wiley Interdisc. Rew.: Data Mining and Knowledge Discovery, Vol. 1, No. 1, pp.73–79. Salfner, F., Lenk, M. and Malek, M. (2010) ‘A survey of online failure prediction methods’, ACM Computing Surveys, March, Vol. 42, pp.1–42. Srivastava, U., Munagala, K. and Widom, J. (2005) ‘Operator placement for in-network stream query processing’, in Proceedings of the 24th ACM SIGMOD-SIGACTSIGART Symposium on Principles of Database Systems, pp.250–258, ACM. Teixeira, P.H.d.S., Clemente, R.G., Kaiser, R.A. and Vieira Jr., D.A. (2010) ‘HOLMES: an event-driven solution to monitor data centers through continuous queries and machine learning’, in Proceedings of the 4th ACM International Conference on Distributed Event-Based Systems, pp.216–221, ACM. von Hagen, W. (2008) Professional Xen Virtualization, Wiley Publishing, Inc., Indianapolis, Indiana.
Notes 1
In the centralised CEP architecture, the CEP manager corresponds to the used (single) CEP engine.