th
The 14 World Conference on Earthquake Engineering October 12-17, 2008, Beijing, China
Damage Index Monitoring of Structures Using Neural Networks 1
2
A. Karamodin , H.H. Kazemi and M.R. Akbarzadeh-T
3
1
PhD student, Dept. of Civil Engineering , Ferdowsi University, Mashhad. Iran 2 Professor, Dept. of Civil Engineering , Ferdowsi University, Mashhad. Iran 3 Professor, Dept. of Electrical Engineering, Ferdowsi University of Mashhad, Iran Email: a
[email protected],
[email protected],
[email protected]
ABSTRACT : A seismic damage index monitoring system is presented in this paper. The method is based on artificial neural networks and measured responses of the structure. Park & Ang damage index is selected for monitoring the damage at each story of the structure. The system is consisted of two neural networks. The input to the first NN is the maximum drift of each story and the output is the damage due to maximum drift of the story. Also the input to the second NN is the differential drift and the sum of the accelerations of stories above each story. The Output of the second NN is the cumulative damage of the story. The data needed for training of neural networks are collected from analysis of a simulated model of the structure under different earthquake records. The damage index in each analysis is computed from analytical method. The performance of damage detection system is determined from comparison of damage index computed from analytical method to one determined by neural networks in a three story benchmark building. Through this study, it is shown that the proposed approach has the potential of being a practical tool for damage monitoring methodology applied to smart civil structures.
KEYWORDS:
Damage Index, Monitoring, Neural Network, Earthquake
1. INTRODUCTION Owing to improved instrumentation and understanding of the dynamics of the complex structures, efforts to identify structural damage have received increasing attention recently. Among many damage detection techniques, the vibration-based approach is promising because it is nondestructive and the vibration signal of a structure is easily measurable using properly deployed sensors. During the last few decades, various vibration-based methods have been developed and applied to detect structural damage in numerous areas . These methods are based on the fact that structural damages reduce the structural stiffness, changing the dynamic characteristics of the structures. Structural damage detection methods used natural frequencies to indicate damage in earlier research [1-4]. However, the frequencies are not spatially specific, nor are they sensitive to damage, thus limiting their application. Since mode shapes can provide much more information than natural frequencies, many studies have focused on damage detection using mode shape information [5–7]. Another set of techniques for detecting structural damage use change in modal strain energy [8-9]. Owing to the features of robustness, fault tolerance, and powerful computational ability, the ANN models have become a promising tool for solving civil engineering problems. Some researches have examined the suitability and capabilities of ANNs for damage detection [10-14]. On-line monitoring has become indispensable for an effective active structural control system, and recent development of sensors and computer technologies renders integration of the on-line monitoring component into a control system feasible. A methodology is needed to analyze the measurement data in order to continuously assess the structural performance or health condition and, therefore, an appropriate control action can be taken to effectively suppress the structural response to an environmental loading.
1
th
The 14 World Conference on Earthquake Engineering October 12-17, 2008, Beijing, China
In this paper a seismic damage index monitoring system is presented. The method is based on artificial neural networks and measured dynamic responses of the structure. Park & Ang damage index is selected for monitoring the damage at each story of the structure. The data needed for training of neural networks are collected from analysis of a simulated model of the structure under different earthquake records. The damage index in each analysis is computed from analytical method. The performance of damage detection system is determined from comparison of damage index computed from analytical method to one determined by neural networks in a three story building.
2. PARK & ANG DAMAGE MODEL
The best-known and most widely used of all cumulative damage indices is that of Park & Ang [15]. This consist of a simple linear combination of normalized deformation and energy absorption:
D=
δm ∫ dE +β δu Fy δ u
(2.1)
Where D is the element damage index, δ m is the maximum experienced deformation; δ u is the ultimate deformation of the element; Fy is the yield strength of the element; dE is the hysteretic energy absorbed by the element during the response history; and β is a model constant parameter. The first term here is a simple, pseudo-static displacement measure. It takes no account of cumulative damage, which is accounted for solely by energy term. The advantages of this model are its simplicity, and the fact that it has been calibrated against a significant amount of observed seismic damage, included some instances of shear and bond failures. Park, Ang and Wen [16] suggested D=0.4 as a threshold value between repairable and irrepairable damage , while the same authors in 1987 suggested the following more detailed classification: D 1.0
No damage or localized minor cracking Minor damage – light cracking throughout Moderate damage – severe cracking, localized spalling Severe damage – crushing of concrete, reinforcement exposed Collapsed
More recent , Ang et al [17] suggested using a value of D=0.8 to represent collapse. This model has been used in a number of seismic vulnerability studies and probabilistic models [18-20]. Kunnath et al, [21], used a slightly modified version of the Park & Ang index in which the recoverable deformation in removed from the first term, and moment and curvature are used instead of force and displacement:
D=
φm − φ y φu − φ y
+β
∫ dE
( 2.2 )
M y φu
Direct application of the damage model to a structural story, or to the overall building requires the determination of the corresponding overall story, or building ultimate deformations. Since the inelastic behavior is confined to plastic zones near the ends of some members, the relation between story or top story deformations, with the local plastic rotations is difficult to establish. Story and overall damage indices are computed using weighting factors based on dissipated hysteretic energy at element and story levels respectively:
⎛ E DI story = ∑ (λi ) element ( DI ) element ; (λi ) element = ⎜ i ⎜∑E i ⎝
2
⎞ ⎟ ⎟ ⎠ element
( 2.3 )
th
The 14 World Conference on Earthquake Engineering October 12-17, 2008, Beijing, China
⎛ E DI overall = ∑ (λi ) story ( DI ) story ; (λi ) storyt = ⎜ i ⎜∑E i ⎝
⎞ ⎟ ⎟ ⎠ story
(2. 4 )
Where λi are the energy weighting factors; and Ei are the total absorbed energy by the element or story “i”.
3. PROPOSED STRATEGY FOR DAMAGE MONITORING
3.1. The Basic Idea Direct use of equation (2.2) for damage monitoring of structures is not possible, because the end curvature and energy dissipated by elements can not be measured. Also Identifying the story or overall damage of structures using equation (2.1), the ultimate drifts and capacity of each story or the structure is needed. The proposed strategy for damage monitoring of structures uses the dynamic response of the structure. It is a two step method. At the first step the dynamic response and story damage of structure is calculated analytically based on equations (2.2) and (2.3). The data obtained from these calculations are used to train two neural networks for damage monitoring of story damage index of the structure. One neural network identifies the damage due to maximum drift and the second neural network identifies the damage due to energy dissipation at each story.
3.2. Neural networks
Two back-propagation neural networks are designed to monitor story damage at each time step. The input to the first NN is the maximum drift of each story and the adjacent stories and output is damage due to maximum drift of the story. The second neural network identifies the damage due to energy dissipated at each story. The input data to this neural network must be appropriate to dissipated energy at each story which can be calculated from the diagram of shear to drift of the story. The dissipated energy at each time step cab be calculated from the product of shear force and the differential drift of the story at that time step. Also the shear force is the sum of inertia forces of the above stories which are the product of mass and acceleration of those stories. Regarding the above discussion, the difference of story drift and the sum of accelerations of above stories are selected for the input to the second neural network. The output of this neural network is the variation of the second part of story damage . The total story damage is obtained from the sum of these two story damages.
4. NUMERICAL EXAMPLE
4.1.
3- story building
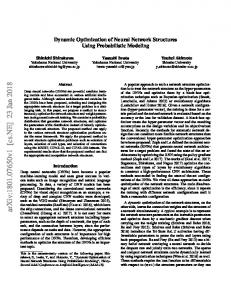
For evaluating the proposed method a 3 story steel frame structure is selected. This structure is 36.58 m in width, and 11.89 m in elevation. The bays are 9.15 m on center with four bays. The lateral load-resisting system of the building is comprised of steel moment-resisting frames (MRFs) with simple framing between the two furthest columns. The columns are 345 MPa steel. The columns of the MRF are wide flange. The levels of the 3-story building are numbered with respect to the ground level (see Figure 1). The third level is the roof. Typical floor-to-floor heights ( for analysis purposes measured from center of beam to center of beam) are 3.96 m. The column bases are fixed. The floor system is comprised of 248 MPa steel wide-flange beams. The seismic mass of the first and second levels is 9.573105 kg and the third level is 1.043106 kg. The seismic mass of the entire structure is 2.953106 kg. The 3-story MRF is depicted in Figure 1. The bilinear bending properties are predefined for each structural member. The plastic hinges, which are assumed to occur at the moment resisting column–beam and column–column connections, introduce a material nonlinear behavior of the structures. 3
th
The 14 World Conference on Earthquake Engineering October 12-17, 2008, Beijing, China
Figure 1. 3 story example building
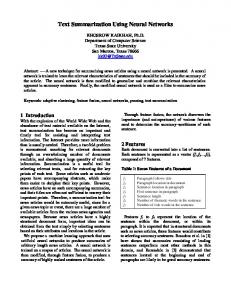
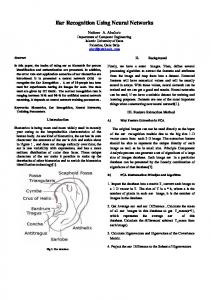
4.2. Preparing data for training A nonlinear dynamic analysis program was prepared in MATLAB that calculates the response and damage index of element, story and overall structure at each time step under earthquake loadings (Figure 2). In this figure story damage 1 is the damage due to maximum deformation and story damage 2 is the damage caused by energy dissipation of elements. To capture the entire range of the damage index (0-1), 6 times the Elcentro earthquake was selected for training the neural networks. Figure 3 shows the acceleration and drift as well as the damage of the 3rd story.
Figure 2. Preparing data for training
4.3. First neural network In this example because of limited number of stories only one neural network is used as the first neural network. The input to this neural network is the maximum drift of stories at each time step and the output is damage 1 of stories (Figure 4). A feed-forward neural network with one hidden layer consisting of ten nodes is selected. Tangent sigmoid transfer function is used for hidden layer nodes and linear for output nodes. The sampling rate of the training data was 100 Hz for 30 s period, which resulted in 3000 patterns for training, Figure 5. 3000 patterns of the provided data was used for training which required 1000 training epochs to achieve a mean-square-error (MSE) of 1e−04. The training is carried out upon the generated data using the Levenberg–Marquardt algorithm [22], which is encoded in Neural Networks Toolbox in MATLAB under ‘trainlm’ routine. Figure 5 compares the damage 1 computed analytically to the damage 1 computed by first neural network. It is clear that in general, the predicted damages are reasonably close to the target damages. The near perfect match in the training data indicates that the neural network is well trained
4
th
The 14 World Conference on Earthquake Engineering October 12-17, 2008, Beijing, China
Figure 3.
Acceleration, drift and damage of 3rd floor
Input Layer
Hidden Layer
Output Layer
Figure 4. First neural network
Figure 5. Training input , output data and training process
4.4. Second neural network
One neural network is also used for all stories to detect the cumulative damage of stories. The input to this neural network is the differential drift of stories and sum of acceleration of above stories at each time step and the output is differential of damage 2 of stories (Figure 6). The selected feed-forward neural network has two hidden layers each consisting of ten nodes . The transfer function used for hidden layers is Tan-sigmoid and linear for output nodes. 3000 patterns of training data were provided from 30s of analysis with a sampling rate of 100 Hz. Figure 7 shows the provided input and output data. The training of the neural network required 500 epochs to achieve a mean-square-error (MSE) of 2.5e−03,(Figure 7). The Levenberg–Marquardt algorithm, was used for training the neural network. Figure 7 shows the comparison between the damage 2 computed analytically, to the damage 2 computed by second neural network. It is seen that in general, the predicted damages by the neural network are acceptably close to the target damages. In can be concluded from the near match in the training data that the neural network is well trained.
5
th
The 14 World Conference on Earthquake Engineering October 12-17, 2008, Beijing, China
Input Layer
Hidden Layers
utput Layer
Figure 6. Second neural network
Figure 7. Training input , output data and training process
5. PERFORMANC EVALUATION
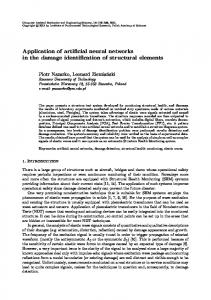
The performance of the proposed damage monitoring system is checked according to comparison of the damage calculated by proposed method to the damage calculated analytically. A SIMULINK model was prepared to monitor the story damage of the structure under earthquake records. Ten earthquake records are used in the simulation, using the original four earthquake records with different intensities. These records are the El Centro and Hachniohe earthquake records with 0.5, 1.0, and 1.5 intensity, and Northridge and Kobe earthquake records with 0.5 and 1.0 intensity. Figure 8 compare the damage 1 and damage 2 of the 3rd story for kobe(intensity 1) earthquake. It is seen that the maximum error for damage 1 is 0.014(%5) at first story and for damage 2 is 0.003(%6) at second story. Table 1 also shows the comparison of damage results at different stories under ten earthquake records. Based on these results the average error for damage 1 , damage 2 and total damage is 0.0027, 0.0031 and 0.0056, respectively. The results show that damage monitoring system performs reasonably under different earthquake records.
6
th
The 14 World Conference on Earthquake Engineering October 12-17, 2008, Beijing, China
Figure 8. Comparison of damage 1 and damage 2 for kobe earthquake (Intensity 1) Table 1
Comparison of damage monitoring
Elcentro 0.5
Elcentro 1.0
Elcentro 1.5
Hachinohe 0.5
Hachinohe1.0
Hachinohe 1.5
Northridge 0.5
Northridge 1.0
Kobe 0.5
Kobe 1.0
story 1 story 2 story 3 story 1 story 2 story 3 story 1 story 2 story 3 story 1 story 2 story 3 story 1 story 2 story 3 story 1 story 2 story 3 story 1 story 2 story 3 story 1 story 2 story 3 story 1 story 2 story 3 story 1 story 2 story 3
Damage1 Analysis NN 0.096 0.012 0.000 0.004 0.000 -0.001 0.141 0.144 0.125 0.121 0.104 0.088 0.179 0.175 0.147 0.147 0.127 0.110 0.000 0.000 0.000 -0.001 0.000 0.000 0.130 0.136 0.111 0.116 0.098 0.079 0.152 0.161 0.172 0.155 0.143 0.133 0.208 0.217 0.125 0.126 0.102 0.097 0.294 0.321 0.197 0.218 0.190 0.208 0.169 0.167 0.170 0.162 0.139 0.131 0.295 0.282 0.285 0.295 0.292 0.305
to analytical results for 3 story example Damage 2 Analysis NN 0.001 -0.015 0.000 0.002 0.000 0.002 0.007 -0.009 0.005 0.007 0.001 0.003 0.014 0.001 0.014 0.015 0.006 0.008 0.000 -0.014 0.000 0.002 0.000 0.001 0.008 -0.003 0.007 0.010 0.001 0.002 0.020 0.010 0.017 0.019 0.004 0.005 0.005 -0.006 0.002 0.004 0.001 0.003 0.024 0.009 0.014 0.012 0.008 0.012 0.010 -0.003 0.013 0.015 0.007 0.008 0.029 0.020 0.045 0.047 0.043 0.041
Damage Analysis NN 0.097 -0.003 0.000 0.007 0.000 0.000 0.147 0.135 0.130 0.128 0.105 0.091 0.193 0.176 0.161 0.162 0.133 0.118 0.000 -0.014 0.000 0.001 0.000 0.001 0.138 0.133 0.117 0.127 0.099 0.082 0.171 0.171 0.189 0.174 0.147 0.138 0.213 0.210 0.127 0.130 0.103 0.101 0.318 0.330 0.210 0.230 0.198 0.221 0.179 0.164 0.183 0.177 0.146 0.138 0.324 0.309 0.330 0.343 0.335 0.346
6. CONCLUSION A damage index monitoring system is proposed based on artificial neural networks and dynamic response of structure. Park & Ang damage index is selected for monitoring the damage at each story of the structure. The system is consisted of two neural networks. The first neural network monitors the damage due to maximum plastic deformation of elements and the second one, damage due to dissipated energy. Neural networks are trained using data collected from analysis of a simulated model of the structure under Elcentro earthquake records. The performance of the proposed damage monitoring system is checked by comparing the damage calculated by proposed method to the damage calculated analytically. The results show that the average error for damage 1,
7
th
The 14 World Conference on Earthquake Engineering October 12-17, 2008, Beijing, China
damage 2 and total damage is 0.0027, 0.0031 and 0.0056, respectively. It can be concluded the that damage monitoring system performs acceptably under different earthquake records.
REFERENCES 1. Cawley P, Adams RD. (1979).The location of defects in structures from measurements of natural frequencies. Journal of Strain Analysis 14:2,49–57. 2. Penny JET, Wilson D, Friswell MI. (1993).Damage location in structures using vibration data. Proceedings of the 11th International Modal Analysis Conference, Kissimee,; 861–867. 3. Contursi T, Messina A, Williams EJ. (1998).A multiple-damage location assurance criterion based on natural frequency changes. Journal of Vibration and Control; 4:5,619–663. 4. Messina A, Jones IA, Williams EJ. (1996).Damage detection and localization using natural frequency changes. Proceedings of the Conference on Identification in Engineering Systems, Swansea, 67–76. 5. Biswas M, Pandey AK, Samman MM. (1990).Diagnosis experiment spectral/modal analysis of highway bridges. The International Journal of Analytical and Experimental Modal Analysis 5:1,33–42. 6. Topole KG, Stubbs N. (1995).Non-destructive damage evaluation of a structure from limited modal parameters. Earthquake Engineering and Structural Dynamics 24(12,1427–1436. 7. Shi ZY, Law SS, Zhang LM. (2000).Damage localization by directly using incomplete mode shapes. Journal of Engineering Mechanics (ASCE) 126:6,656–660. 8. Hearn G, Testa RB. (1991).Modal analysis for damage detection in structures. Journal of Structural Engineering (ASCE) 117:10,3042–3063. 9. Shi ZY, Law SS, Zhang LM. (1998).Structural damage localization from modal strain energy change. Journal of Sound and Vibration 218:5,825–844. 10. Wu X, Ghaboussi J, Garrett Jr JH. (1992).Use of neural networks in detection of structural damage. Computers and Structures 42:4,649–659. 11. Elkordy MF. (1992).Application of Neural Networks in Structural Damage Diagnosis and Condition Monitoring. UMI Dissertation Services, A Bell & Howell Company. 12. Zhao J, Ivan JN, (1998). DeWolf JT. Structural damage detection using artificial neural networks. Journal of Infrastructure Systems (ASCE) 4:2:93–101. 13. Masri SF, Nakamura M, Chassiakos AG, Caughey TK. (1996).Neural network approach to the detection of changes in structural parameters. Journal of Engineering Mechanics (ASCE) 122:4,350–360. 14. Masri SF, Smyth AW, Chassiakos AG, Caughey TK, Hunter NF. (2000).Application of neural networks for detection of changes in nonlinear systems. Journal of Engineering Mechanics (ASCE) 126:7,666–676. 15. Park, Y. J., Ang, A. H-S., and Wen, Y.K. (1986). Damage-Limiting Aseismic Design of Buildings, Earthquake Spectra. 16. Park, Y. J., Ang, A. H.-S., and Wen, Y. K., (1984).Seismic Damage Analysis and Damage-Limiting design of R/C Buildings. Civil Engineering Studies, Technical Report No. SRS 516, University of Illinois, Urbana. 17. Ang A.H-S., Kim W.J., Kim S.B. (1993). Damage estimation of existing bridge structures, Structural Engineering in Natural Hazards Mitigation:Proc. ASCE Structures Congress, Irvine CA, Vol. 2, 1137-1142. 18. Ang A.H-S. (1987).Basis for earthquake resistant design with tolerable structural damage, Proc. 5th Int. Conf. on Application of statistics and Probability in Soil and Structural Engineering (ICASP5), Vancouver BC, Canada, Vol. 1, 407-416. 19. Ciampoli M., Giannini R., Nuti C., Pinto P.E.( 1989). Seismic reliability of non-linear structures with stochastic parameters by directional simulation, Proc. 5th Int. Conf. on structural Safety and Reliability (ICOSSAR 89), San Fransisco CA, Vol. II, 1121-1128. 20. Siedel M.J., Reinhorn A.M., Park Y.J. (1989). Seismic damageability assessment of R/C buildings in eastern U.S. Journal of Structural Engineering, ASCE, 115:9,2184-2260. 21. Kunnath S.K., Reinhorn A.M., Lobo R.F. (1992). IDARC version 3.0: A program for the inelastic damage analysis of RC structures, Technical Report NCEER-92-0022, National Center for Earthquake Engineering Research, State University of New York, Buffalo NY. 22. Hertz J, Krogh A, Palmer RG. (1993). Introduction to the Theory of Neural Computation. Addison-Wesley Publishing Company: Boston, MA.
8
th
The 14 World Conference on Earthquake Engineering October 12-17, 2008, Beijing, China
9