resonances using air-coupled and wide-band ultrasound to monitor ... Keywords: Plant leaves; Water content; drought stress; circadian rythms; ... The possibility of a non-invasive, non-contact and continuous monitoring performed in real time is .... In all the measurements shown in this paper the light source was the sun.
Available online at www.sciencedirect.com
ScienceDirect Physics Procedia 63 (2015) 91 – 96
43rd Annual Symposium of the Ultrasonic Industry Association, UIA Symposium 2014
Monitoring of plant light/dark cycles using air-coupled ultrasonic spectroscopy M.D. Fariñas a, D. Sancho-Knapik b, J. Peguero-Pina b, E. Gil-Pelegrín b and T.E.G. Álvarez-Arenas a a
Sensors and Ultrasonic Technologies Department, Information and Physics Technolgies Institute (ITEFI), Spanish National Research Council (CSIC), Serrano 144, 28006, Madrid, Spain b Agrifood Research and Technology Centre of Aragon (CITA). Avd. Montañana 930, 50059 Zaragoza, Spain.
Abstract This work presents the application of a technique based on the excitation, sensing and spectral analysis of leaves thickness resonances using air-coupled and wide-band ultrasound to monitor variations in leaves properties due to the plant response along light/dark cycles. The main features of these resonances are determined by the tautness of the cells walls in such a way that small modifications produced by variations in the transpiration rate, stomata aperture or water potential have a direct effect on the thickness resonances that can be measured in a completely non-invasive and contactless way. Results show that it is possible to monitor leaves changes due to variations in light intensity along the diurnal cycle, moreover, the technique reveals differences in the leaf response for different species and also within the same species but for specimens grown under different conditions that present different cell structures at the tissue level. PACS: 43.20+g; 43.80 +p; 45.35 +d;
© 2015 The Authors. Published by Elsevier B.V. This is an open access article under the CC BY-NC-ND license © 2014 The Authors. Published by Elsevier B.V. (http://creativecommons.org/licenses/by-nc-nd/4.0/). Industry Association. Peer-reviewunder under responsibility of Ultrasonic the Ultrasonic Peer-review responsibility of the Industry Association
Keywords: Plant leaves; Water content; drought stress; circadian rythms; air-coupled; ultrasoni spectroscopy; monitoring;
1875-3892 © 2015 The Authors. Published by Elsevier B.V. This is an open access article under the CC BY-NC-ND license (http://creativecommons.org/licenses/by-nc-nd/4.0/). Peer-review under responsibility of the Ultrasonic Industry Association doi:10.1016/j.phpro.2015.03.015
92
M.D. Fariñas et al. / Physics Procedia 63 (2015) 91 – 96
1. Introduction Improvements in air-coupled transducers have boosted the applications of air-coupled ultrasound to materials characterization and to non-destructive testing technique; in particular, the use of spectral analysis of thickness resonances in solid plates (Yano et al., 1987; Haller et al., 1992; Schindel and Hutchins 1995; Álvarez-Arenas et al., 2002; Álvarez-Arenas 2004; Álvarez-Arenas et al., 2010; Álvarez-Arenas et al., 2012; Álvarez-Arenas 2013; Álvarez-Arenas and Díez 2013). Conventional ultrasonic had been used before in plant leaves (Fukuhara 2002); aircoupled ultrasound and spectral analysis of leaves thickness resonance was first proposed by Álvarez-Arenas et al., (2009a, 2009b, 2010). Later, Sancho-Knapik et al. (2010, 2011, 2012) established a link between leaf physiologic and ultrasonic properties. They demonstrated that when the leaf relative water content (RWC) decreases, the frequency of the thickness resonance shifts towards lower values following a sigmoid function, and that the point of inflection coincides with the point of turgor loss determined from pressure-volume curves measured with a pressure chamber (Scholander et al., 1965). In all these cases the effective medium approach, considering a one dimensional model, plane wave and normal incidence provided a good representation of the experimental data in spite of the complexity and heterogeneity of plant leaves structure (Sancho-Knapik et al., 2013). More realistic models were proposed in order to extract the properties of different layers of the plant tissue (Álvarez-Arenas et al., 2009b; Fariñas et al., 2013). The possibility of a non-invasive, non-contact and continuous monitoring performed in real time is very attractive to plant physiologists and can also be used for improvements in agriculture industry (water irrigation, monitoring plant development for biomass purposes, greenhouses). The purpose of this work is to test the possibilities of this technique for the continuous recording of attached leaves subjected to light intensity variations, we will focus on the variations in resonance frequency. This parameter presents a close correlation with other leaf parameters, this measurement is easy, robust and straightforward and does not require any model assumption as it is derived directly from the measurements. A more complete analysis of the resonance spectra will be the aim of future works as well as monitoring plant leaves responses to other environmental stimuli. 2. Materials and Methods 2.1. Plant material: description and properties One dicotyledonous species (deciduous Vitis vinifera) and one monocotyledonous species (evergreen Epipremnum aureum) have been studied. All of the used plants were in soil filled pots (pot volume of 2 l, 2 l and 5 l
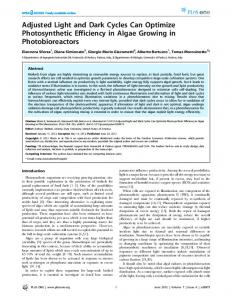
Fig 1. Cross-section of the leaves of different monocotyledonous and dicotyledonous species used in the experiments: a, Cryo SEM image of Epipremnum aureum leaf grown without direct sunlight (Epipremnum aureum I); b, Cryo SEM image of Epipremnum aureum leaf grown under sunlight (Epipremnum aureum II); c, Cryo SEM image of Vitis vinifera leaf.
93
M.D. Fariñas et al. / Physics Procedia 63 (2015) 91 – 96
respectively). Two different plants of Epipremnum aureum were used for the experiments. Both were genetically identical obtained by vegetative reproduction, but they were grown for 12 months under different conditions, one without direct sunlight exposure (I) and the other under direct sunlight exposition (II). It is well known that several features of plant form, physiology, and resource allocation vary with the level of irradiance to which plants are acclimated and/or ecologically restricted (Givnish 1988). In this case, leaves of these two plants show clear differences in terms of thickness, color and elasticity as reported before for other species (Onoda et al., 2008). Differences in leaf tissue morphology due to differentiated exposure to sunlight have been further investigated by Cryo-SEM images of the cross-section fractures (see figure 1). The leaf grown without direct sunlight exposure (Figure 1.a), presents an almost negligible palisade parenchyma with one discontinuous row of small cells (25-50 μm), and a highly porous spongy mesophyll that almost covers the whole leaf. On the other hand, the leaf grown with direct sunlight exposure (Figure 1.b), present a well-defined palisade parenchyma with a close packed row of relatively larger cells (50-75 μm). As an initial characterization of these materials ten different leaves of each species were ultrasonically characterized at full turgor using the procedure proposed by Álvarez-Arenas et al., (2009a). Averaged leaf parameters so obtained are summarized in Table 1. The lowest ultrasonic velocity and the largest value of α/fresM are observed in the Epipremnum aureum (I) leaves. These results are consistent with the highly porous structure and the loose packing of cells observed in Fig. 1.a, with a reduced palisade parenchyma and a large spongy mesophyll. Finally, and with the purpose to complete this initial characterization, leaves were cut and measured as they dry by using both the ultrasonic technique and the pressure chamber method following the procedures presented by Snacho-Knapik et al., (2010, 2011) Variations in the water potential and in the leaves first thickness resonance, fres, with the leaf relative water content (RWC) were measured. So it was possible to determine the turgor loss point (TLP) and to obtain RWC, water potential and the relative variation in fres: ((fres-fresM))⁄(fresM ) at the TLP, where fresM is the resonant frequency at full turgor. Results are summarized in Table 2. Table 1. Summary of the averaged leaf ultrasonic properties and their standard variation (in %). Species Epipremnum aureum (I) Epipremnum aureum (II) Vitis vinifera
ெ ݂௦ (kHz) (±15 %)
Velocity (m/s) (±5 %)
ெ D0/݂௦ (Np/m/kHz) (±7 %)
Density (kg/m3) (±5 %)
245 260 540
165 200 215
3.5 2.3 4.1
860 915 760
2.2. Experimental set-up and equipment The components of the experimental set-up include the following elements: a) An air-coupled ultrasonic system to measure the ultrasonic properties of the leaves: Two pairs of aircoupled and wide-band transducers (transmitter: Tx and receiver: Rx) developed, designed and built at CSIC lab. with frequency bands of 0.15-0.35 MHz and 0.35-0.95 MHz, and peak sensitivity of -25 and -30 dB, respectively have been used (Álvarez-Arenas 2004). Transducers were embedded in a U-shaped holder that keeps them facing each other at a distance of 30-50 mm so that for measurements leaves can be easily located between. A commercial pulser/receiver (5077PR, Olympus, Houston, Texas (USA)) was used to drive the Tx (100 V amplitude semicycle of square wave tuned to the transducer centre frequency) and to amplify and filter the electrical signal provided by the Rx (up to 40 dB and low pass filtered LPF: 10 MHz). The signal is then sent to a digital oscilloscope (Tektronix DPO 5052) with the bandwidth set to 20 MHz where it was digitized and averaged (between 80 and 120 samples). The result is transferred to the oscilloscope PC for further signal analysis (Fast Fourier extraction) and calculations (performed in MATLAB®), see Sancho-Knapik et al., (2012). Hence precision in the determination of the relative variation in the resonant frequency is in the range 0.3-0.8 %. Repeatability of the measurement of the resonant frequency is < 0.8 %.
94
M.D. Fariñas et al. / Physics Procedia 63 (2015) 91 – 96
b) A system of conventional sensors to monitor the variations in the plant environment: For soil tension measurements a Watermark 200SS-V, Irrometer, Riverside, California (USA) sensor was used. Concerning light intensity, the Photosynthetic Photon Flux SQ-200-5, Apogee Instruments, Logan, Utah (USA) a photosinthetically active radiation sensor was used for this purpose. According to the manufacturer, sensitivity is 2.0 mV per μmol m-2 s-1 with a calibration factor of 0.5 μmol m-2 s-1 per mV and measurement repeatability is < 1%. In all the measurements shown in this paper the light source was the sun. All these sensors were connected to a data logger (FieldLogger FL, NOVUS, Porto Alegre, Rio Grande do Sul (Brazil)). Clock was synchronized with the CPU clock of the oscilloscope PC which controlled the acquisition of ultrasonic data. c) Non-ultrasonic techniques to measure other leaf properties: Stomatal conductance (gs) was measured using a SC-1 Leaf Porometer, Decagon Devices, Inc., Pullman, WA, (USA). According to the manufacturer, accuracy is within 10% of the measured value. Water potential (ψ, -MPa), pressure chamber method was used to determine the leaf water potential increasing the pressure around a leaf within a pressure chamber, while the cut end of the petiole remains outside the chamber at atmospheric pressure (Slavik, 1974). Leaf Relative water content (RWC) was obtained from the weight (using a precision balance), at full turgor and the dry mass (80º C during 48 h) according to the procedure explained by Sancho-Knapik et al., (2011). 2.3. Experimental method The measurements were performed in Madrid and the plants were placed at a lab window looking to the west, so direct sunlight reaches the plants at intervals between 14:00 and 18:00. Air and soil temperature, soil tension and PAR were measured and stored in the autonomous data logger every 10 minutes. Ultrasonic measurements were controlled with the oscilloscope PC and taken every 10 minutes as well. The night before the monitoring started, the pots were widely watered. The following day, we started measuring early in the morning and no additional water was supplied during the 3-4 days while the monitoring was on. This procedure was repeated between three and five times for each plant in five different leaves.
Fig.2. Evolution of the thickness resonant frequency during 4 days in: a, Epipremnum aureum grown without direct sunlight leaf; b, Epipremnum aureum grown under direct sunlight leaf; c, Vitis vinifera leaf. PPF and ambient temperature measurements are also shown.
3. Results and Discussions In general, it is observed that the frequency of the first order thickness resonance of the plant leaves changes when the plant is subjected to light intensity variations. The actual behavior depends on the specific properties of the leaves of this species, the environmental conditions where the plant was grown and the actual state of the leaf and
M.D. Fariñas et al. / Physics Procedia 63 (2015) 91 – 96
the plant itself. It is expected that the technique can be equally applied to any other species, whenever thickness resonances of the leaves can be measured, though the actual behavior will depend on the specific features of the species and the plant under study. Measured variation in the leaf properties due to the variations in the plant activity along the diurnal cycle are shown in Figures 2 a-c. They show the variation in the resonant frequency, the ambient temperature and the light intensity with the time of day. In addition, the expected value of fres at the turgor loss point (TLP) is also shown. In general, the variation in the thickness resonant frequency of the leaves with the time of day follows the variations in the light intensity (PPF). The sensitivity of fres to PPF varies between different species, but in all cases it has been observed that the minimum value of fres is obtained at the maximum value of PPF that, in our experimental set-up, was achieved between 1:00PM and 6:00PM. ࡹ ࡹ The maximum relative variation of the thickness resonance ൫ࢌ ࢘ࢋ࢙ െ ࢌ࢘ࢋ࢙ ൯Τࢌ࢘ࢋ࢙ is as follows: Epipremnum aureum (I): ࡹ ࡹ 5 r 1 %; Epipremnum aureum (II): 7.5 r 1 %; and Vitis vinifera: 12.5 r 1 %. If we compare ൫ࢌ ࢘ࢋ࢙ െ ࢌ࢘ࢋ࢙ ൯Τࢌ࢘ࢋ࢙ with ࡹ ሻΤ ࡹ ሺࢌࢀࡸࡼ ࢌ � െ ࢌ we observe two different types of behavior. For Epipremnum aureum the former is considerably ࢘ࢋ࢙ ࢘ࢋ࢙ ࢘ࢋ࢙ smaller; while for Vitis vinifera both magnitudes are similar. In addition, in Epipremnum aureum (I) and Vitis vinifera, it is possible to observe a slight reduction of the maximum value of the resonant frequency reached during the night as the number of days of monitoring increases. This can be attributed to the progressive decay of the soil water content. Table 2. RWC, water potential and maximum resonance frequency relative variation values at Turgor loss point (TLP).
Species Epipremnum aureum Vitis vinifera
RWC 0.96 0.9
Turgor loss point (TLP). Water ் ெ ሻΤ ெ ሺ݂௦ െ ݂௦ ݂௦ potential (%) (-MPa) 0.52 10 1.99 13
4. Summary and Conclusions This work shows that the presented air-coupled and wide band ultrasonic technique is able to detect, in a nondestructive, non-invasive, non-contact and fast way, variations in the leaves thickness resonances due to the response of the plant to variations in the light intensity. Decrease in light intensity (from 2000 to 150 μmol m-2 s-1) produces an increase in the leaf thickness resonant frequency (between 8% and 12%, depending on the species). This is explained by the reduction of plant transpiration, the closure of stomata and the concomitant shift of the water equilibrium in the leaves. Observed variations in the resonant frequency along the diurnal cycle (4%-10%) largely reflect the variations in light intensity. In addition, the kinetic of this response and the presence of saturation levels seems to depend on the adaptive mechanisms of the plants to the available degree of sunlight intensity. Acknowledgements Authors acknowledge funding by the Spanish Ministry for Economy and Competitivity, project DPI2011-22438 and Botín Foundation grant given to M.D. Fariñas in La Residencia de Estudiantes. References Álvarez-Arenas TEG, 2010. Simultaneous determination of the ultrasound velocity and the thickness of solid plates from the analysis of thickness resonances using air-coupled ultrasound. Ultrasonics, 50(2):104-109. Álvarez-Arenas TEG, 2013. Air-coupled piezoelectric transducers with active polypropylene foam matching layers. Sensors, 13(5): 5996–6013. Álvarez-Arenas TEG, Calás H, Cuello JE, Fernández AR, Muñoz M., 2010. Noncontact ultrasonic spectroscopy applied to the study of polypropylene ferroelectrets. J Appl Phys, 108(7):074110, 1-9. Álvarez-Arenas TEG, Sancho-Knapik D, Peguero-Pina JJ, Gil-Pelegrín E., 2009a. Noncontact and noninvasive study of plant leaves using aircoupled ultrasounds. Appl Phys Lett. 95(19): 193702,1-3.
95
96
M.D. Fariñas et al. / Physics Procedia 63 (2015) 91 – 96 Álvarez-Arenas TEG, Sancho-Knapik D, Peguero-Pina JJ, Gil-Pelegrín E., 2009b. Determination of Plant Leaves Water Status using AirCoupled Ultrasounds. IEEE International Ultrasonics Symposium. pp: 771–774. Álvarez-Arenas TEG, Shrout TR, Zhang SJ, Lee HJ., 2013a. Air-Coupled Transducers Based on 1-3 Connectivity Single Crystal Transducers. IEEE International Ultrasonics Symposium 2010, 2230–2233. Álvarez-Arenas TEG, Díez L, 2013b. Novel Impedance Matching Materials and Strategies for Air-Coupled Piezoelectric Transducers. IEEE Sensors. (in press). Álvarez-Arenas, T.E.G., 2004. Acoustic impedance matching of piezoelectric transducers to the air. IEEE Trans Ultrason Ferroelec Freq Contr. 2004;51(5):624-633. Álvarez-Arenas, T.E.G., Montero De Espinosa, F.R., Moner-Girona, M, Rodrı́guez, E, Roig, A, Molins, E, 2002. Viscoelasticity of silica aerogels at ultrasonic frequencies. Applied Physics Letters, 81(7), p.1198. Fariñas MD, Sancho-Knapik D, Peguero-Pina JJ, Gil-Pelegrín E, Álvarez-Arenas TEG., 2013. Shear waves in vegetal tissues at ultrasonic frequencies. App Phys Lett;102(10): 103702-103705. Fukuhara M., 2002. Acoustic characteristics of botanical leaves using ultrasonic transmission waves. Plant Sci.;162(4):521-528. Givnish TJ., 1988. Adaptation to sun and shade: a whole-plant perspective. Functional Plant Biol.;15(2):63-92. Haller MI, Edward L, Khuri-Yakub BT., 1992. 1-3 Composites for Ultrasonic Air Transducers. IEEE Ultrasonics Symposium. 1992;2:937-939. Onoda Y, Schievig F, Anten NPR., 2008. Effects of Light and Nutrient Availability on Leaf Mechanical Properties of Plantago major: A Conceptual Approach. Annals of Botany.;101:727-36. Sancho-Knapik D, Álvarez-Arenas TEG, Peguero-Pina JJ, Fernández V, Gil-Pelegrín E., 2011. Relationship between ultrasonic properties and structural changes in the mesophyll during leaf dehydration. J Exp Bot.;62(10):3637–3645. Sancho-Knapik D, Álvarez-Arenas TEG, Peguero-Pina JJ, Gil-Pelegrín E., 2010. Air-coupled broadband ultrasonic spectroscopy as a new noninvasive and non-contact method for the determination of leaf water status. J Exp Bot.;61(5): 1385–1391. Sancho-Knapik D, Calás H, Peguero-Pina JJ, Ramos Fernández A, Gil-Pelegrín E, Álvarez-Arenas TEG., 2012. Air-Coupled Ultrasonic Resonant Spectroscopy for the Study of the Relationship Between Plant Leaves’ Elasticity and Their Water Content. IEEE Trans Ultrason Ferroelec Freq Contr. 2012;59(2):319–325. Sancho-Knapik D, Peguero-Pina JJ, Fariñas MD, Álvarez-Arenas TEG, Gil-Pelegrín E., 2013. Ultrasonic spectroscopy allows a rapid determination of the relative water content at the turgor loss point: a comparison with pressure-volume curves in 13 woody species. Tree Physiol.;33(7):695–700. Schindel DW, Hutchins DA., 1995. Through-thickness characterization of solids by wideband air-coupled ultrasound. Ultrasonics.:33(1);11-17. Scholander PF, Bradstreet ED, Hemmingsen EA, Hammel HT., 1965. Sap pressure in vascular plants negative hydrostatic pressure can be measured in plants. Science.;148(3668):339-346. Slavík B., 1974. Methods of studying plant water relations. Berlin: Springer. Yano T, Tone M, Fukumoto A., 1987. Range finding and surface characterization using high-frequency air transducers. IEEE Trans Ultrason Ferroelec Freq Contr.1987;34(2):232–236.