The distributed data caches require the compiler to carefully ex- amine the data
access patterns of each individual memory opera- tion. A good dispersal of data ...
Data Access Partitioning for Fine-grain Parallelism on Multicore Architectures Michael Chu∗
Rajiv Ravindran†
Scott Mahlke
Advanced Computer Architecture Laboratory University of Michigan Ann Arbor, MI 48109 {mchu,
rravindr, mahlke}@umich.edu
ABSTRACT The recent design shift towards multicore processors has spawned a significant amount of research in the area of program parallelization. The future abundance of cores on a single chip requires programmer and compiler intervention to increase the amount of parallel work possible. Much of the recent work has fallen into the areas of coarse-grain parallelization: new programming models and different ways to exploit threads and data-level parallelism. This work focuses on a complementary direction, improving performance through automated fine-grain parallelization. The main difficulty in achieving a performance benefit from fine-grain parallelism is the distribution of data memory accesses across the data caches of each core. Poor choices in the placement of data accesses can lead to increased memory stalls and low resource utilization. We propose a profile-guided method for partitioning memory accesses across distributed data caches. First, a profile determines affinity relationships between memory accesses and working set characteristics of individual memory operations in the program. Next, a program-level partitioning of the memory operations is performed to divide the memory accesses across the data caches. As a result, the data accesses are proactively dispersed to reduce memory stalls and improve computation parallelization. A final detailed partitioning of the computation instructions is performed with knowledge of the cache location of their associated data. Overall, our data partitioning reduces stall cycles by up to 51% versus data-incognizant partitioning, and has an overall speedup average of 30% over a single core processor.
1.
INTRODUCTION
In recent years, the processor design industry has shifted away from increasing the performance of monolithic, centralized processor designs. In the past, processor generations could scale performance by increasing clock frequency and designing larger, more complex structures. However, increased power dissipation and thermal issues have become the main design constraints, forcing a change to decentralized multicore designs. Multicore processors lessen the power issues by using multiple simpler cores and tightly integrating them together on a single die. This allows for an increase in throughput capabilities of the processor but does not necessarily increase performance. As Moore’s law continues to increase transistor counts, the semiconductor industry is expected to use the additional transistors to scale the number of cores per chip from the ∗ Author is currently with the Parallel Computing Platforms group at Microsoft Corporation † Author is currently with the Java, Compilers and Tools Laboratory at Hewlett-Packard
2 to 8 core processors currently available on the market to many more in the future. While the shift to multicore designs has the ability to significantly improve the performance of applications, this performance boost is not free. In order to take advantage of massively parallel cores, the difficult problem of parallelizing an application falls back on the programmer and compiler. Recently, a significant amount of work has focused on areas such as new programming models [4, 16] and ways to exploit single-instruction multiple-data (SIMD) parallelism. These methods for coarse-grain parallelization can be powerful in extracting large amounts of parallel work and distributing them across the cores. However, there are still a significant number of single-threaded applications that simply do not exhibit the inherent parallelism for programmers to widely spread their execution across multiple cores. This paper focuses on a complementary compiler-directed method for program parallelization by exploiting fine-grain instructionlevel parallelism (ILP). Current research in interconnection networks have examined multiple ways to increase the speed and bandwidth of communication between cores [23, 25]. Faster communication of scalar values between the cores enables applications to take advantage of parallelization at the operation granularity. While coarse-grain techniques can parallelize large portions of execution, our method can use an additional dimension to further increase performance by creating fine-grain threads to exploit on the multiple underlying cores. The challenge for exploiting fine-grain parallelism is: given an application, identify the operations that should execute on each core. This decision must take into account the communication overhead of transferring register values between the cores as well as the layout of data values in the individual caches of each core. Poor decisions can lead to communication across the interconnection network delaying the execution of other operations, cache conflicts evicting data and increasing cache misses, or an increase in cache coherency traffic between the cores, all of which lead to lower performance. The fine-grain nature of these decisions make it difficult for the programmer to specify. However, the compiler can take advantage of the data-flow and memory access behavior analyses to make better decisions to how to distribute the application. Extracting fine-grain parallelism is a difficult task, but as the industry moves to faster, tighter interconnection networks between the cores, many similarities can be drawn with multicluster VLIW processors in the embedded domain. In embedded processors, centralized register files and datapaths became the cost, energy and delay bottlenecks in wide-issue designs [11, 12]. Multicluster processors helped alleviate the scalability problem by decentralizing resources into smaller designs and grouping them together into individual processing elements (PEs) [9, 13]. These processors ad-
dress the issue of fine-grain parallelism by relying on the compiler to partition operations across the multiple clusters [1, 3, 10, 18]. The main difference between multicluster and the multicore processors of today are that multicluster designs generally have a shared data cache, while multicore systems have coherent distributed data caches per core. This adds another level of complexity for the compiler to be cognizant of data values and how they are brought into each individual cache. The distributed data caches require the compiler to carefully examine the data access patterns of each individual memory operation. A good dispersal of data accesses across the cores is critical to producing a high-performance partitioned program. Poor placement of data accesses could lead to significant time stalled waiting for memory because of cache misses or coherence traffic, taking away the gains provided by the fine-grain partitioning of operations. Analysis of the memory accesses of each operation can help to determine when individual data accesses are causing others to either hit or miss in the cache. In addition, the compiler can estimate the contribution each memory operation has to the overall working set. Placing too many operations in a single cache could potentially increase the number of cache misses. Thus, given profile information about affinities between operations and working set sizes, the compiler can proactively combine or split operations across the distributed data caches in order to improve performance. The underlying vision of this work is to compile to chip multiprocessors, such as Raw [26], that can both exploit thread-level parallelism (TLP) and ILP. This work focuses on the ILP side, where the architecture can be viewed as a multicluster VLIW with distributed/coherent L1 caches. We propose a new compiler technique that actively partitions memory operations across PEs in order to decrease the memory stall time. A good partitioning of the data allows us to map the problem of fine-grain parallelization for multicore down to the problem of program partitioning for multicluster VLIWs. Our method is a phase-ordered approach to partition memory and computation. Thus, the partition of the data accesses is performed first, regardless of the underlying computation performed. The data access partition is then used the drive the partitioning of the remainder of the code. Our approach first profiles the program to determine statistics about each memory operation, such as its affinity towards other operations and an estimated working set size. This information is used to create a program-level graph of the memory accesses. The graph is then heuristically partitioned to assign memory operations to PEs. Finally, a detailed partitioning of each code block is performed which respects the preplacement locations of the memory operations.
2.
BACKGROUND
This section provides background on our target architecture and the use of a distributed data cache for the memory subsystem. In addition, we introduce some of the challenges faced by the compiler in generating code in the presence of distributed data caches.
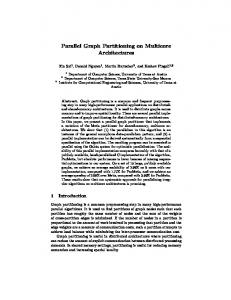
2.1 Multicore Architectures Multicore architectures have helped improve processor performance by increasing the number of available resources. The multicore architecture targeted by this work is shown in Figure 1. The processor consists of multiple PEs which are connected together by a fast communication network to transfer scalar operand values. Each PE also has its own data cache, and the caches are kept coherent through a coherence network. Thus, rather than having a single monolithic processor with a fast clock frequency, multicore architectures simplify the individual cores, but increase their number to improve processor throughput.
Figure 1: The multicore architecture targeted by this work: multiple PEs tied together with a communication network for scalar values and a coherence network for the data caches. A challenging task for multicore processor code generation is exploiting enough parallelism to successfully utilize the available throughput. Recent work in multicore processor interconnects has focused on improving the latency and bandwidth of the communication network [23, 25]. These techniques allow for faster transfer of scalar values between the register files, which can then allow the insertion of communication operations to split producer-consumer relationships across multiple PEs. Thus, fine-grain threads, which are small subgraphs of computation and data access operations can be created to maximize resource utilization. The architecture shown in Figure 1 presents another difficulty for code generation because of its distributed data caches. The L1 caches of each PE must be connected to one another with a coherence network to arbitrate the sharing of data lines and maintain correctness. This distributed design allows the processor to be more easily scaled to wider issue designs by simply instantiating new PEs. Several problems arise with the use of distributed data caches. First, each memory operation now can have a widely varying access latency for its data, depending on where it exists and its current state. The data could reside in its local cache, in a remote cache, or in none of the caches. In each case, the data could also be in shared, modified, or exclusive state, each requiring different coherence requests to be sent out to copy from or invalidate other caches, and causing a variable amount of delay because of possible congestion in the coherence network. Another problem that arises with distributed data memories is that each PE now has a smaller amount of memory associated with it. Compared to the large, shared memory, these smaller L1 caches have a higher likelihood for cache misses. Thus, the compiler must be careful about what accesses it chooses to place in each cache. Finally, with distributed caches, it is possible to partition the accesses up in a manner in which they cause multiplicative misses in each of the L1 caches, rather than localizing the misses to one of the caches.
2.2 Distributed Data Cache Compilation Producing efficient code for distributed data caches is a challenging task for the compiler. Traditional operation partitioning algorithms [1, 3, 18] assume a shared data memory, which greatly simplifies the compilation task. The compiler could choose to continue use of these algorithms and simply ignore the presence of the distributed caches, allowing the underlying coherence hardware to maintain correctness and properly load objects into the cache when
Figure 2: An illustrative example of the difficulties in compiling for distributed data caches (a) a code example, (b) a partitioning of the operations assuming a shared memory, (c) a partitioning of the operations cognizant of the data access pattern, (d) idealized schedules assuming a shared memory, and (e) schedules factoring in distributed data caches. needed. This method passively partitions the memory operations as part of its normal partitioning algorithm, and doesn’t consider the underlying hardware. However, this strategy could easily degrade performance as multiplicative misses, coherence overheads, and conflict misses increase. Thus, in order to generate efficient code for distributed data caches, the compiler must actively partition the memory operations cognizant of the ramifications of its choices. Figure 2 is an example pseudocode that illustrates some of the difficulties that can arise when the compiler is partitioning the operations. In Figure 2(a), the C code for a loop is shown that accesses two different arrays. Within the body of the loop, there are three loads, two of which are to array x and one to array y. In addition, there is a store to array x at the end of the loop. Each memory operation is annotated with a label, and dataflow graphs for this code are shown in Figure 2(b) and (c). An operation partitioner that assumes a shared memory may try and produce the assignment of operations shown in Figure 2(b). This can be a good partition because it only requires one transfer of register values across the communication network, and balances the required work for each PE well. This assignment places two of the loads (L2 and L3) on one PE and the other memory operations on the other. With a shared data cache between the PEs, the sole objective of operation assignment (including memory operations) is to minimize the expected schedule length. Given a distributed data cache design, the desired PE assignment can change drastically. Looking again at Figure 2(b), in each iteration in PE 1, load L1 will bring a line into the cache that is also written to by store S1. Load L2 is also reading from the same cache line, but in PE 2. When store S1 is executed, its PE will upgrade the line in PE 1’s cache to the ownership state, and invalidate the cache line in PE 2. In the next iteration, load L2 will again be executed on the PE 2, causing another miss in its cache, since it had been invalidated. In fact in this next iteration, the miss caused by load L2 will be a case of false sharing of the cache line. It would then have to use the coherence network to get the modified cache line from PE 1. A better partitioning of this code cognizant of the distributed data caches is shown in Figure 2(c), where loads L1 and L2, and store S1 are grouped together on a single PE. The schedules for these two assignments are presented in Figures 2(d) and (e). In Figure 2(d), we show the idealized schedule with a shared cache. In this case, the schedule length of assignment #2 is longer because of the extra required register transfer operations, indicated by the arrows crossing the PE boundaries. Thus, assignment #1 has a shorter per iteration static schedule than assignment #2. However, in Figure 2(e), which considers cache effects, load L2 will miss in its cache during each iteration and be
stalled (indicated by the dotted line), waiting to transfer the modified cache line from PE 1. In addition, each iteration will have a stall for store S1 waiting to upgrade its cache line to modify it. The schedule for assignment #2 shows none of these coherence issues, and would only stall for cold misses that would affect any partition assignment. This example illustrates one of the main difficulties in partitioning memory operations for distributed data caches. There is a careful balance between improving cache usage to reduce stall time and the benefits of parallelization. Grouping together all memory operations that access the same addresses onto the same PE can be an attractive option, as it can reduce misses. However, it can also come at the expense of computation parallelism across the PEs. The total execution of the program is the sum of compute cycles and stall cycles, and the compiler must decide which is more beneficial. In this example, it was better to sacrifice computation in order to reduce stall cycles in each iteration of the loop.
3. DATA ACCESS PARTITIONING This section introduces our Profile-guided Data Access Partitioning technique for assigning memory access operations to PEs with distributed data caches.
3.1 Overview This work proposes a profile-guided method that analyzes the access pattern of memory operations and distributes them among PEs. This is followed by a detailed partitioning of the computation operations cognizant of the memory access cache locations. We feel this approach to first assign memory operations, then assign the rest of the operations helps to reduce stall-time effects and allows the compiler to take advantage of an improved memory partitioning when generating code for the rest of the program. We chose to use a profile-guided technique rather than static analysis because the profile allows finer grain control over the placement of the data. Static analysis methods can relate memory access operations to data objects, but then the partition must be made at the object level rather than the operation level. Our technique for data access partitioning consists of three steps, shown in the gray boxes in Figure 3. The dotted box indicates the main parts of our profile-guided approach. During the first step, a profile of the data accesses is performed that determines affinities of memory operations with one another. We use a pseudo-cache simulation in order to determine whether any pair of operations would prefer to occur in the same cache or be kept in separate caches. The second step builds a program-level data access graph of all the memory operations, using the statistics gathered during the profile.
Program
Memory Op Affinity Relationships
Data Access Profile
Memory Op Working Set Estimates
Program-level Data Graph Partitioning
Memory Op PE Assignments
Standard Operation Partitioner
Figure 3: A flow chart of our profile-guided technique. Sliding Window
LD1 LD2 LD4 ST1 LD3 LD2 ST1 LD2 LD1 LD2 LD4 LD2 LD4 LD4 Memory Op Memory Op B1 B2 B3 B4 B4 B2 B4 B1 B2 B4 B3 B3 B4 B1 Block Address Accessed Block C1 C2 C1 C2 C2 C2 C2 C1 C2 C2 C1 C1 C2 C1 Cache Line
...
...
Input: {(L1 , B1 ), (L2 , B2 ), (L3 , B3 ), ..., (Lk , Bk )} Output: {Lk , Size} for (i = (k − 1) to 1) do dist++ ; if (Bi = Bk ) then break; end end if (DistM ap[Lk ].lookup(dist)) then DistM ap[Lk ].value(dist)++ ; end else DistM ap[Lk ].insert(dist, 1) ; Algorithm 1: Estimating working-set size of load/store instructions.
Current Memory Access
Figure 4: Our profiler’s sliding window to analyze memory access affinities This graph is then partitioned to determine the memory operation placement across the PEs. In the third step, a standard operation partitioner is used to produce a block-level partitioning of the remainder of the program, cognizant of the preplaced memory operations. This third step is an important part of our process, but is not the focus of this paper. Our main contribution is the development of the profile-guided technique to effectively partition memory operations to reduce stall time. Our technique can be used in conjunction with any standard operation partitioner [8, 10, 22], as long as it can be modified to acknowledge that the memory operations have been preassigned to PEs.
3.2 Data Access Profile The first step of our technique is a profiling pass that builds a program-level data access graph between memory operations. The purpose of this step is to monitor the data accesses produced by each memory operation to determine whether individual operations have any preference to being placed together on the same cache or apart on different caches. Thus, the resulting data access graph consists of each memory operation in the program connected by edges representing the affinity between memory operations. We identified three important characteristics of memory operations to take into account during this pass: constructive interference, destructive interference, and working set size. Constructive interference occurs when two memory operations are likely to access the same cache lines and one access helps the other hit in the cache. Similarly, destructive interference occurs when two memory operations are likely to kick one another out of the cache. Working set size is an estimate made of how much memory an individual memory operation takes up in the cache. Each of these three characteristics is determined during a profile run by examining and analyzing the stream of memory accesses produced by the program. Our data access profile creates a sliding window of the last n memory accesses, as shown in Figure 4. The sliding window gives the profiler a narrow view of the recent accesses that have been sent to the data cache. With each access, the profiler records the memory operation and the accessed address into the window. The operation and address are recorded in order to determine if future memory accesses can benefit from being in the same partition as the current access. Thus, the profiler is performing a pseudo-cache simulation over the window of accesses, trying to determine whether memory operations attract or repel one another.
The profiler then travels back through the window of accesses from the head to the tail, recording a count of each time it sees a different memory operation that accessed the same memory block. This static count of accesses to the same address is an indication of how much the memory operation could help the current access hit in the cache. Thus, this value is used as the constructive interference metric, or positive affinity of operations to one another. For the case in Figure 4, our profile statistics would increase the constructive interference between LD 4 and LD 2 as well as LD 4 and ST 1 because they all access block B4 within the window. Equation 1 illustrates the calculation for the constructive interference between a static memory operations i and j. X
cons(i, j) =
X
(block(i) == block(j))
(1)
trace window
While traveling back through the window of accesses, the profiler also records how often the current memory access is likely to kick another memory operation’s accessed cache line out of the cache assuming a direct-mapped cache. This static count is used as the destructive interference, or negative affinity of operations to one another. In Figure 4, since blocks B4 and B2 both write to cache line C2, the profile increases the destructive interference between LD 4 and LD 1 by one. In both the constructive and destructive passes back through the sliding window, the analysis is terminated either at the tail of the window or when an address match occurs with a memory store operation. The store operation termination was added because with coherent L1 caches, a store would cause an exclusive access in one of the caches, effectively invalidating it from the others. Thus, in Figure 4, the profiler would begin at the current memory access LD 4, and travel back noting that load LD 2 and store ST 1 accessed the same block. However, it would not mark that load LD 3, the tail of the sliding window, also accessed that block, since the store ST 1 would have ownership on that cache line. The calculation for destructive interference between a static memory operation i and another operation j is this illustrated in Equation 2. dest(i, j) =
X
X
(line(i) == line(j))
(2)
trace window
The final metric recorded by the profiler is an estimate for the working set contribution of each memory operation. For this work, we leverage previous research for working set estimates based on reuse distances of load and store operations [2, 21]. Algorithm 1 illustrates the calculation of this estimate. Input into the algorithm is a list of cache block references for every load and store operation
PE 1
PE 2 10 7
5 5
4
6 3
10
11
14
8 5 9 13
10
11
18 10
9 5 11
12
3
11 19 4 5 15
Figure 5: Partitioning the data access graph for the rawdaudio benchmark. Nodes are memory operations, annotated with an id (in the node) a working set size. The thickness of the edges indicate the amount of constructive affinity one operation has for another. in reference order. The working set size is estimated by looking at past references to unique blocks by that instruction from the head to the tail. The algorithm measures the cache reuse distance, or number of intervening operations between the current instruction/block pair and its previous instance. This quantifies the number of cache blocks that must be present in a fully-associative cache for the instruction to result in a hit. For each memory operation, a histogram is produced that indicates the number of times the operation had each access distance. A weighted average is taken of these cache distances and is used as the working set estimate. Thus, while this estimate is not perfect, as it assumes a fully-associative cache, it can be useful as a heuristic to help determine how long certain accesses would likely prefer to be in the cache. Our memory partition method uses a direct-mapped cache metric for our interference calculations and a fully-associative cache metric for the working set estimates. While these are very different cache designs, using them for the metric results in a more conservative estimate. The direct-mapped assumption for the interference estimates the worst case situation for conflict misses in the cache. Similarly, the fully-associative assumption estimates the worst case for capacity misses. Thus, these assumptions can allow for a more conservative view of the cache effects of the memory operations.
3.3 Access Partitioning The second step is the actual partitioning of the data accesses across the different data caches. After the profile run is completed, a program-level graph of all the accesses in the program is created. The nodes in the graph represent each memory operation and the edges connecting the nodes represent affinities between the operations. Each node is weighted with the estimated working set size of the memory operation. Each edge is weighted with the difference between of the constructive and destructive interferences between the memory operations. Our technique inputs this graph into the METIS graph partitioner [19], which divides the data accesses trying to cut as few positive edges as possible while keeping a balanced node weight sum per partition. The use of the estimated working set for the node weight helps keep the partitioned memory operations balanced in their usage of the data caches. For example, if a memory operation had a high working set estimate, it would most likely need to be in the cache for a longer period of time to hit than an operation with a low work-
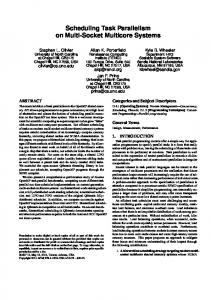
ing set estimate. Thus, the partitioner could take this into consideration and not push as many large working set operations together into the same cache. The use of the constructive and destructive affinities for the edge weights helps the partitioner decide which edges are best to cut when dividing up the memory operations. If two operations had a large amount of destructive interference, this would be indicated in the graph with a large negative edge weight. That would then be attractive to the partitioner as a good edge to cut. Similarly, if two operations had a large amount of constructive interference, the edge weight would be a large positive value, indicating the operations should be kept together in a single cache. Figure 5 shows the data access graph created for the main loop of the rawdaudio benchmark from the Mediabench suite [20]. In this figure, each node represents a memory operation and is labeled with an id number inside and its estimated working set next to the node. Edges connect various operations in this graph, and the thickness of the graph indicates different affinities. Higher constructive affinities are shown with thicker edges. Thus, operations 11 and 18 have a high amount of affinity towards one another, while 4 and 7 have a small amount. Nodes without any edges are memory operations that had no affinity towards any other operations during the profile. For this benchmark, there was no destructive interference, as is common with many kernel loop benchmarks that generally walk through large data arrays. Therefore, there is no negative affinities for the partitioner to try and push operations apart, but the partitioner still had to deal with which operations to merge together and how to balance the working set. The end partition in Figure 5 shows several interesting results. First, the most highly connected nodes, 6 to 13 and 11 to 18, are kept together on the same PE. This allows them to help one another in using the same cache lines. In addition, the partitioner chose to group many of the other operations with affinity to 11 and 18 together. Next, many of the operations (5, 8, 10, 12, 15 and 19) have no edges, suggesting they have no interaction with one another. In these cases, the partitioner chose the group them with operations 6 and 13 to help balance the overall working set sizes. The large group of operations (7, 9, 11, 14 and 18) that had high affinity towards one another were grouped together and they had a large working set sum, thus the partitioner preferred to place the free operations on the other PE. Finally, note that the partitioner chose to cut the edges around operation 4. This was done to also help balance the working set, as all the operations left in PE 2 have a large working set size. Operation 4 was chosen because it had the smallest affinity towards the other operations and created the best balance of the working set.
3.4 Operation Assignment The final step of our technique is to finish partitioning the rest of the program code, including all computation operations. In this step, any standard operation partitioning technique can be used, as long as it can be modified to be cognizant of preplaced memory operations. For this work, we used the Region-based Hierarchical Partitioning (RHOP) algorithm [7] to distribute all the operations across the PEs. RHOP is a operation partitioner capable of efficiently generating high-quality operation divisions; however, as with most previous operation partitioning algorithms, it was designed with the model of a single unified memory. RHOP itself is designed as a performance-centric multilevel graph partitioner for multicluster architectures. The novel aspect with the algorithm was its modeling of the resources and estimates of the schedule length. These were used in order to estimate the schedule length impact of partitioning decisions without requiring the
PE 2
PE 1
&
&
=?
>>
BR
LD 13
Livein PE 1
=?
&
&
&
=?
>>
BR
LD 13
+
Livein PE 1
=?
&
+
>>
=?
=?
>>
=?
=?
LD 14
BR
BR
LD 14
BR
BR
Parameter Number OF PEs Function Units PE Comm. B/W PE Comm. Latency L1 Cache L1 Block Size L1 Cache Sizes L1 Hit Latency L1 Bus Latency L2 Hit Latency Main Memory Latency Coherence Protocol
Configuration 2, 4 1 I,F,M,B per PE 1 total move per cycle 1, 2, 3 cycles 2-way associative 32 bytes 512B, 1kB, 4kB, 8kB per PE 1 cycle 2 cycles 10 cycles 100 cycles MOESI
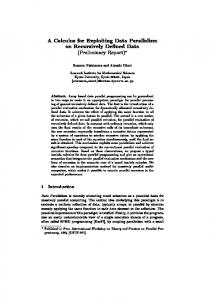
Table 1: Details of the simulated machine configurations Figure 6: Operation assignment of the computation operations in rawdaudio given the memory operation placement from our profile guided technique. need to actually schedule the code, which is a complex and time consuming process. RHOP proceeds by coarsening operations together based on the dependences between operations. Edges in the graph are given weights based on either low slack between the operations (higher weight), or high slack between the operations (lower weight). A low slack between operations indicates that the edge is more critical, and breaking the edge across PEs will require increasing the schedule length. Similarly, high slack edges have more freedom to insert intercore communication. The coarsening process groups together operations in high-weight edge priority. After coarsening, the algorithm begins backtracking across the coarsened states, uncoarsening operations. At each stage of the uncoarsening, the schedule length estimates are updated to reflect the current partitioning of the objects. Uncoarsened groups of operations are considered for movement across partitions when they appear favorable in terms of reducing schedule length or resource saturation. The process is illustrated in Figure 6 for a basic block in the benchmark rawdaudio. In Figure 6(a), the partitioning of the block begins with the memory operations preassigned to their respective PEs from the output of the previous step (as shown in Figure 5). Every other operation is unassigned to a PE, but some operations have live-in operands from previously partitioned blocks in the code. In Figure 6(b), we show the operation partition after RHOP has completed. The memory operations are still assigned to their prebound PEs, and the operations around them have been partitioned taking the data location into consideration. There are two transfers across the communication network in this figure, one from LD 13 to an add operation, and one from the add operation to a compare operation. While RHOP can produce high-quality partitions of the operations, it has the underlying assumption that data can be accessed from any PE. We extended RHOP to allow for a prebinding of memory operations to a PE, which was determined by the partition of the program-level data access graph. This was done by modifying the resource usage weights of the memory operations to have a very high weight when placed on an incorrect PE. Furthermore, operations prebound to different PEs are prevented from coarsening with one another. Thus, when RHOP begins estimating costs of moving computation operations between partitions, it can take the required data transfer moves into account.
4.
EXPERIMENTS
Our profile-guided data access partitioning technique was implemented as part of the Trimaran compiler infrastructure [27], a retar-
getable compiler for VLIW/EPIC processors. The machine model used had 2 or 4 PEs, and 1 integer, float, memory and branch unit per PE. Each PE includes a distributed L1 data cache of varying sizes between 512B and 8kB. We assumed a shared 128kB 4-way associative L2 data cache and coherency was kept between the L1 caches with a MOESI coherence protocol. The communication network between PEs, which is used to transfer register values, allows for a total of 1 move per cycle with a 1-cycle latency. More details of our simulated machine are provided in Table 1. We ran our experiments on a number of benchmarks with varying amounts of inherent parallelism in order to gauge the effectiveness of our technique. The benchmarks with the most parallelism consisted of a set of DSP kernels. These benchmarks were the ideal case with a significant amount of available parallelism to extract. We also used the Mediabench [20] benchmarks, which have slightly less parallelism, but still enough to extract some performance gains. Finally, we ran our technique on the SPEC CPU 2000 benchmarks, which have the lowest amount of parallelism available. Our results show a representative subset of applications from these benchmark suites. For each benchmark, we evaluated the performance of a standard RHOP generated partition which assumes a shared memory and compared it to our profiled-guided method which prepartitions the memory accesses. Thus, our base case is a data cache incognizant method, which places data access operations without knowledge of the distributed L1 caches. We report the improvement of our technique relative to the base RHOP case. A comparison with the base RHOP partitioning was used to determine the amount of improvement that our phased-ordered memory placement could have over a standard multicluster operation partitioner. In generating our PE assignment for memory operations, our data access partitioning technique profiled each application using a sliding window size of 256 instructions and assumed a 32-byte line size. Each benchmark was profiled and evaluated on different input sets. The profile used a smaller input set to generate the memory operation-to-PE bindings.
4.1 Performance Improvement Figure 7 shows the reduction in stall cycles for our profile-guided data access partitioning technique compared to the partition produced by RHOP with no active data partitioning. Each bar represents a different cache size per PE. Higher bars indicate a larger reduction in stall cycles, and bars below zero indicate a increase in stall cycles. In almost all cases, our technique significantly reduced the number of stall cycles, by as much as 90% in gsmdecode and linescreen. This can be attributed to a better grouping of high affinity memory operations decreasing the coherence traffic and better localizing data usage in a single PE. Most benchmarks
512 B 100
Kernels
1 kB
4 kB
8 kB
Mediabench
SPECint2000
SPECfp2000
Average
90
% Reduction in Stall Cycles
80 70 60 50 40 30 20 10 0
Average 3cycle
Average
Average 2cycle
177.mesa
188.ammp
172.mgrid
300.twolf
171.swim
256.bzip2
175.vpr
181.mcf
164.gzip
rawcaudio
rawdaudio
mpeg2dec
mpeg2enc
gsmdecode
gsmencode
g721decode
g721encode
cjpeg
djpeg
linescreen
channel
vitoneloop
fsed
sobel
-20
lyapunov
-10
Figure 7: Reduction in stall cycles when using a profile-guided data access partitioning for a 2-PE processor Incognizant 2.0
Kernels
Data Partitioned
Mediabench
Unified
SPECint2000
SPECfp2000
AVG
1.8
Speedup
1.6
1.4
1.2
1.0
AVERAGE
177.mesa
188.ammp
172.mgrid
300.twolf
171.swim
256.bzip2
175.vpr
181.mcf
164.gzip
132.ijpeg
rawcaudio
rawdaudio
mpeg2dec
mpeg2enc
gsmdecode
gsmencode
g721decode
g721encode
djpeg
cjpeg
linescreen
channel
vitoneloop
sobel
fsed
lyapunov
0.8
Figure 8: Performance comparison of a 2-PE machine versus a 1-PE machine with different data partitioning techniques. saw increasing benefits as cache size increased, as a larger cache size allowed for our grouping of memory operations together to be more effective at keeping cache lines valid. Some, like rawdaudio, showed less improvement with larger caches. This was not due to the profile-guided approach performing worse, but rather the fact that almost all of the working set of the benchmark could fit in a single larger cache. In addition, the average stall cycle reductions for intercore communication latencies of 2 and 3 cycles are shown. For higher latencies, the stall cycle reduction is fairly similar. Variance appears because RHOP reassigns the computation causing slightly different overlaps between computation and stall time. Some benchmarks, like lyapunov and rawcaudio, increased the number of stall cycles with a 512B cache. For rawcaudio, this occurred because the partition assignment overcommitted one of the caches with too many memory requests, causing additional conflict misses. This resulted in this benchmark making far more accesses to the L2 cache than the base case. For the lyapunov kernel, our
partitioning of the memory operations actually produced a memory operation assignment that had comparable L1 cache miss rates. However, with the small cache size, our partitioner overcommitted the memory unit with store accesses, increasing the number of misses in one critical section. While the number of cycles due to stall is improved, total performance is affected by the sum of both stall and compute cycles. Figure 8 shows the achieved speedup over a single PE machine on a 2-PE system. Thus, 1.0 on the y-axis indicates the performance of a single PE, and higher bars indicate better performance. For each benchmark, three bars are shown. The first indicates the performance achieved by a data-incognizant partitioner which purely focuses on the computation operations. This technique generally does the worst, as it suffers from a poor data access distribution and memory stalls. The second bar indicates the performance of our technique, where we proactively distribute data accesses. The final bar is the performance of a unified machine: a single PE processor with twice the resources. Thus, this bar is an indication of
the upper bound of our technique, as it can support the same amount of parallelism and does not suffer from the intercore communication latencies. Overall, most benchmarks show a performance improvement with intelligent data partitioning. As expected, benchmarks with more parallelism, such as the kernels and Mediabench, show more speedup. This is directly related to the amount of parallel work available for our fine-grain technique to exploit. The SPECcpu benchmarks show less speedup, but the unified machine speedup for each benchmark indicates that many of those applications have very little room for improvement. On average, we saw the upper-bound of achievable speedup around 1.43, and we were able to extract approximately a 1.3 speedup with our data access partitioning. It is evident that a data-incognizant partitioning is not a good solution, and the proactive distribution of the data is extremely important in leveraging benefit from the extra resources. In many cases, such as gsmdecode, 175.vpr, and 300.twolf, a decrease in performance is shown for a data incognizant partition, as the memory stall time takes away any gains from computation parallelization. However, with our proactive data partitioning, all three of these benchmarks show some speedup over the baseline case. Two benchmarks, 181.mcf and 171.swim, show slight performance degradation even with our technique. In these applications, the amount of parallelism available was so low that we were not able to extract enough parallel work.
4.2 Reduction in Coherence Traffic Besides stall cycle reductions, another benefit of our data access partitioning method is that by actively grouping memory operations that have high affinity towards one another, coherence traffic can be reduced. While this is not a strict indicator of performance, if the coherence traffic became a bottleneck, this reduction could be beneficial. With a significant increase in network traffic, congestion could cause additional delays on memory accesses, as coherence requests begin lining up waiting for arbitration. Table 2 presents the reduction in coherence traffic produced by our profiled-guided method with a 4kB data cache per PE. For each benchmark, the number of snoops performed by the base RHOP and the profile-guided method are shown along with the percentage reduction. In almost all cases, our method is able to significantly reduce the number of snoop requests put on the coherence bus. Most cases are above an 80% reduction in snoop requests, with the lowest being a 47% reduction in mpeg2enc. There was only one benchmark, 177.mesa, in which our technique failed to significantly reduce the coherence traffic. This application had a small region with a large number of stores to similar locations. Our technique chose to try and balance out the memory usage and caused the majority of the coherence traffic. Another benchmark to note is rawcaudio, which had a extremely small number of snoops in the base RHOP case. This indicates that the base RHOP had a fairly good partitioning of the data objects, as it didn’t require many invalidations.
4.3 Partitioning to Four Processing Elements To see how our algorithm generalizes to more parallel architectures that are becoming more common today, we ran our method on a machine with 4 PEs. Figure 9 presents the percentage reduction in both stall cycles and overall speedup for two different machines: a 2-PE processor and a 4-PE processor. In each case, each PE had a 4kB L1 cache. In Figure 9(a), the two bars indicate the percentage reduction in stall cycle time for the 2-PE and 4-PE machines, respectively. In Figure 9(b), the two bars indicate the overall speedup achieved over a single PE machine for 2-PEs and 4-PEs. In each
Benchmark lyapunov fsed sobel channel vitoneloop linescreen
Incognizant 82117 335597 841 3196 16834 1416908 Kernels
Profiled 0 8253 69 179 1 3
% Red. 100.0 97.5 91.8 94.4 99.9 99.9
Benchmark cjpeg djpeg g721encode g721decode gsmencode gsmdecode mpeg2enc mpeg2dec rawcaudio rawdaudio
Incognizant Profiled 525562 52021 160703 7930 9384112 672792 9353752 737476 4758854 194416 3082861 275893 4138884 1213889 12956935 1916597 76 4 102580 1 Mediabench
% Red. 90.1 95.0 92.8 92.1 95.9 91.0 70.7 85.2 94.7 99.9
Benchmark 164.gzip 175.vpr 181.mcf 256.bzip2 300.twolf
Incognizant Profiled 137074797 9795008 11192509 1711914 38087128 11278386 150271055 5198114 49666748 2147275 SPECint
% Red. 92.9 84.7 70.4 96.5 95.7
Benchmark 171.swim 172.mgrid 177.mesa 188.ammp
Incognizant 4500483 2649332 31104748 1024210 SPECfp
% Red. 64.3 94.8 2.7 73.3
Profiled 5264423 9795008 30271083 273371
Table 2: The number of snoops required across the coherence network for the base RHOP case (Incognizant) and the Profileguided case (Profiled), as well as the percentage reduction in snoops (% Red). case, higher bars indicate better performance. In general, the results of the 4-PE processor were mixed, but overall they were fairly in line with the results for 2-PE processors. The stall cycle reductions in Figure 9(a) indicate that with more PEs, proactive data partitioning was still able to reduce a large amount of the memory stalls. In some cases, this reduction was significantly larger for 4 PEs, such as mpeg2enc, in others, it was less such as g721encode. However, on average, we were able to reduce approximately the same amount of memory stall cycles for 2 and 4 PEs. Figure 9(b) shows that overall speedup with 4 PEs was also similar to the 2-PE results. Some benchmarks, such as gsmencode, where dramatically improved; however, on average, there wasn’t a significant increase in performance even though were four times the number of resources as the baseline case. Much of the achievable performance benefits depends on whether or not the benchmark has enough parallelism to support the wider machine. In addition, the larger number of PEs increases the contention for the communication bus causing more compute cycles to be executed. This shows us that while fine-grain parallelism is useful and can be exploited for performance, it has its limits based on the application.
4.4 Compile Time Effects Our method for profile-guided memory operation assignment will generally increase compilation time. The runtime of the profiler is
2-PE
100
2-PE
4-PE
Mediabench
Kernels
SPECint2000
SPECfp2000
2.2
AVG
SPECint2000
SPECfp2000
AVG
2.0
90
1.8
80
1.6
70
1.4 Speedup
60 50
1.2 1.0
40 0.8 30
(a)
AVERAGE
177.mesa
188.ammp
172.mgrid
300.twolf
171.swim
256.bzip2
175.vpr
181.mcf
164.gzip
rawcaudio
rawdaudio
mpeg2dec
mpeg2enc
gsmdecode
gsmencode
g721decode
g721encode
cjpeg
djpeg
linescreen
channel
vitoneloop
fsed
lyapunov
AVERAGE
177.mesa
188.ammp
172.mgrid
300.twolf
171.swim
256.bzip2
175.vpr
181.mcf
164.gzip
rawcaudio
rawdaudio
mpeg2dec
mpeg2enc
gsmdecode
gsmencode
g721decode
g721encode
cjpeg
djpeg
linescreen
channel
vitoneloop
0.0
fsed
0.2
0
sobel
0.4
10
sobel
0.6
20
lyapunov
% Reduction in Stall Cycles
4-PE
Mediabench
Kernels
(b)
Figure 9: Comparison of 2-PE and 4-PE machines for (a) stall cycle reductions and (b) overall speedup. affected by three major factors: the profiling input used, the size of our sliding window, and the total number of memory operations executed by the program. For our experiments, we used a smaller input to profile all the benchmarks. The sliding window size was kept at 256 instructions, so every executed memory instruction would at most look at the last 256 traced memory addresses. Our current system is not optimized for speed and can be improved significantly. Overall runtimes varied by benchmark; the worst case was approximately doubling of the total compile time. These cases were generally benchmarks that had many dynamic memory operations. On average, our technique increased compile time by 30.8%.
4.5 Discussion Our results show that our partitioning technique for fine-grain parallelism works quite well for 2-PEs and, in some cases, for 4PEs. Overall, results for 4-PEs did not scale well. The scalability of our technique is directly proportional to the amount of inherent ILP within the target program. The unified results for the 4-PE cases showed that the upper-bound of these applications was constrained. The vision of this work is that fine-grain parallelism is not to be the only form of parallelism that would be exploited by the system. We see coarse-grain methods as absolutely necessary to scale to large numbers of cores. Our work is complementary; fine-grain partitioning is applied to each coarse-grain thread to parallelize along multiple axes.
5.
RELATED WORK
The topic of compiler partitioning for distributed architectures has been studied significantly in the past, especially in the context of multicluster VLIW processors. The first cluster assignment algorithm for multicluster processors was the Bottom-Up Greedy (BUG) algorithm in the Bulldog compiler [10]. BUG greedily assigns operations to clusters in order to minimize a estimated schedule length. Thus, it had a very narrow view of the code and often ¨ fell into local minima. Ozer et al. [22] developed a partitioning algorithm that unified cluster assignment with scheduling to produce more efficient code. Many other operation partitioning techniques [1, 3, 18] have been proposed, but all make the fundamental assumption of a shared data cache to reduce the complexity of their algorithms. We view our profile-guided data access partitioning work as an additional prepass phase that can work in concert with any of these algorithms to help produce better partitions in the presence of distributed data caches. Recently, there has been related work in the area of partitioning
data objects across distributed data memories. S´anchez [24] studied the fully distributed clustered VLIW architecture, where fetch, execute and memory units were all decentralized. They focused on modifying the modulo scheduler to be cognizant of memory locations. Their technique similarly uses a locality metric; however, they focus on cache misses. In addition, their cache miss equations, which determine the number of misses caused by memory instructions, work on affine arrays. Our technique is more global in nature, as it determines both positive and negative affinities throughout the entire program and can handle arbitrary code. Gibert et al. [15] use small low latency buffers as localized storage and dynamically fill them in order to improve performance. Other recent work by Gibert et al. [14] partitions memory at a data object level into either a fast-access, high-power cache or a slow-access, low-power cache. Thus, objects that are accessed in critical portions of the code are placed into the fast cache, while non-critical objects can be partitioned into the slower cache. Their work is not directly comparable to ours, as they target power reduction rather than performance. Hunter [17] investigated placing objects into specialized SRAM arrays, and focused on lowering the memory port requirements and access latencies. Chu et al. [8] studied the partitioning of objects into scratchpad memories. Their work considers data and an object level and partitions entire objects across the memories. This allowed for simplification of the partitioning problem, as the compiler could ignore the effects of coherence and sharing of data. However, their technique was unable to consider working set sizes and were forced to use the larger granularity of an object rather than individual loads/stores. In the multiprocessor domain, there has been previous work on software mechanisms to reduce the required invalidation and updates from coherence traffic. Cheong et al. [6] proposed a method to selectively invalidate potentially stale cache lines, thus proactively reducing the required invalidations. Chen et al. [5] developed a compiler method to allow for writes to shared cache lines, which would also reduce the required coherence traffic. These works focused mainly on individual accesses and reducing specific coherence request instances, rather than the producing an overall partition of the program. Overall, we see our work having several advantages and improvements over previous memory partitioning techniques. First, rather than using a data object granularity for partitioning memory, we use a much finer-grain memory operation granularity. Thus, rather than partitioning an entire object to a cache, we can partition individual load and store operations that may access different por-
tions of the data object to different caches. Second, we use statistics gathered in a memory access profile to help guide the partitioner to group and repel operations with one another. Third, we break the assumption of static scratchpads and take the use of data caches into consideration. Lastly, our technique works more on reducing coherence traffic of the entire program, rather than identifying individual memory accesses or blocks.
6.
CONCLUSION
In this work, we present a profile-guided technique for partitioning memory access operations across distributed data caches to exploit fine-grain parallelism. Our profile gathers statistics on memory operation affinities and working set estimates, and uses the information to create a program-level data access graph. This graph is partitioned to simultaneously cut as few high affinity edges as possible while balancing the working set per cache. The output is a mapping of memory operations to processing elements. Our technique can work in conjunction with any standard operation partitioner, and helps to enhance their ability to extract parallelism by proactively accounting for the data memory subsystem. By first making our decisions globally on the memory operations, we make the placement of data the first-order term in the definition of a good program partitioning. We see our technique for automated finegrain parallelization as a complementary method to current coarsegrain techniques, and able to increase the performance of applications on multicore processors. Overall, our profile-guided technique was able to improve the average memory stall cycle time of a standard operation partitioner by 51% and average speedup by 30% for a 2-PE processor.
[9]
[10] [11]
[12]
[13]
[14]
[15]
[16]
[17]
[18]
7.
ACKNOWLEDGMENTS
We thank the anonymous referees for their comments and suggestions. This research was supported by National Science Foundation CAREER Award CCF-0347411, grant CCR-0325898, and the WIMS Engineering Research Center.
8.
REFERENCES
´ ´ [1] A LET A` , A., C ODINA , J., S ANCHEZ , J., AND G ONZ ALEZ , A. Graph-partitioning based instruction scheduling for clustered processors. In Proc. of the 34th Annual International Symposium on Microarchitecture (Dec. 2001), pp. 150–159. [2] C AS¸ CAVAL , C., AND PADUA , D. Estimating cache misses and locality using stack distances. In Proc. of the 2003 International Conference on Supercomputing (June 2003), pp. 150–159. [3] C APITANIO , A., D UTT, N., AND N ICOLAU , A. Partitioned register files for VLIWs: A preliminary analysis of tradeoffs. In Proc. of the 25th Annual International Symposium on Microarchitecture (Dec. 1992), pp. 103–114. [4] C EZE , L., M ONTESINOS , P., VON P RAUN , C., AND T ORRELLAS , J. Colorama: Architectural support for data-centric synchronization. In Proc. of the 13th International Symposium on High-Performance Computer Architecture (Feb. 2007), pp. 133–134. [5] C HEN , Y., AND VAIDENBAUM , A. A software coherence scheme with the assistance of directories. In Proc. of the 1991 International Conference on Supercomputing, pp. 284–294. [6] C HEONG , H., AND VAIDENBAUM , A. A cache coherence scheme with fast selective invalidation. In Proc. of the 15th Annual International Symposium on Computer Architecture, pp. 299–307. [7] C HU , M., FAN , K., AND M AHLKE , S. Region-based hierarchical operation partitioning for multicluster processors. In Proc. of the SIGPLAN ’03 Conference on Programming Language Design and Implementation (June 2003), pp. 300–311. [8] C HU , M., AND M AHLKE , S. Compiler-directed data partitioning for multicluster processors. In Proc. of the 2006 International
[19]
[20]
[21]
[22]
[23]
[24]
[25]
[26]
[27]
Symposium on Code Generation and Optimization (Mar. 2006), pp. 208–218. C OLWELL , R., ET AL . Architecture and implementation of a VLIW supercomputer. In Proc. of the 1990 International Conference on Supercomputing (June 1990), pp. 910–919. E LLIS , J. Bulldog: A Compiler for VLIW Architectures. MIT Press, Cambridge, MA, 1985. FARABOSCHI , P., D ESOLI , G., AND F ISHER , J. Clustered instruction-level parallel processors. Tech. Rep. HPL-98-204, Hewlett-Packard Laboratories, Dec. 1998. FARKAS , K., C HOW, P., J OUPPI , N., AND V RANESIC , Z. The multicluster architecture: Reducing cycle time through partitioning. In Proc. of the 30th Annual International Symposium on Microarchitecture (Dec. 1997), pp. 149–159. F ISHER , J. Very Long Instruction Word Architectures and the ELI-52. In Proc. of the 10th Annual International Symposium on Computer Architecture (1983), pp. 140–150. ´ G IBERT, E., A BELLA , J., S ANCHEZ , J., V ERA , X., AND ´ G ONZ ALEZ , A. Variable-based multi-module data caches for clustered VLIW processors. In Proc. of the 14th International Conference on Parallel Architectures and Compilation Techniques (Sept. 2005), pp. 207–217. ´ ´ G IBERT, E., S ANCHEZ , J., AND G ONZ ALEZ , A. Flexible compiler-managed L0 buffers for clustered VLIW processors. In Proc. of the 36th Annual International Symposium on Microarchitecture (Dec. 2003), pp. 315–325. H AMMOND , L., W ONG , V., C HEN , M., C ARLSTROM , B. D., D AVIS , J. D., H ERTZBERG , B., P RABHU , M. K., W IJAYA , H., K OZYRAKIS , C., AND O LUKOTUN , K. Transactional memory coherence and consistency. In Proc. of the 31st Annual International Symposium on Computer Architecture (June 2004), p. 102. H UNTER , H. Matching On-Chip Data Storage To Telecommunication and Media Application Properties. PhD thesis, University of Illinois at Urbana-Champaign, 2004. ˘ , K., AND A GRAWALA , A. CARS: A new K AILAS , K., E BCIO GLU code generation framework for clustered ILP processors. In Proc. of the 7th International Symposium on High-Performance Computer Architecture (Feb. 2001), pp. 133–142. K ARYPIS , G., AND K UMAR , V. Metis: A Software Package for Paritioning Unstructured Graphs, Partitioning Meshes and Computing Fill-Reducing Orderings of Sparce Matrices. University of Minnesota, Sept. 1998. L EE , C., P OTKONJAK , M., AND M ANGIONE -S MITH , W. MediaBench: A tool for evaluating and synthesizing multimedia and communications systems. In Proc. of the 30th Annual International Symposium on Microarchitecture (1997), pp. 330–335. M ATSSON , R. L., G ECSEI , J., S LUTZ , D., AND T RAIGER , I. Evaluation techniques for storage hierarchies. IBM Systems Journal 9, 2 (1970), 78–117. ¨ ZER , E., B ANERJIA , S., AND C ONTE , T. Unified assign and O schedule: A new approach to scheduling for clustered register file microarchitectures. In Proc. of the 31st Annual International Symposium on Microarchitecture (Dec. 1998), pp. 308–315. R ANGAN , R., VACHHARAJANI , N., VACHHARAJANI , M., AND AUGUST, D. I. Decoupled software pipelining with the synchronization array. In Proc. of the 13th International Conference on Parallel Architectures and Compilation Techniques (2004), pp. 177–188. ´ ´ S ANCHEZ , J., AND G ONZ ALEZ , A. Modulo scheduling for a fully-distributed clustered VLIW architecture. In Proc. of the 33rd Annual International Symposium on Microarchitecture (Dec. 2000), pp. 124–133. TAYLOR , M., L EE , W., A MARASINGHE , S., AND A GARWAL , A. Scalar operand networks: On-chip interconnect for ILP in partitioned architectures. In Proc. of the 9th International Symposium on High-Performance Computer Architecture (Feb. 2003), pp. 341–353. TAYLOR , M. B., ET AL . The Raw microprocessor: A computational fabric for software circuits and general purpose programs. IEEE Micro 22, 2 (2002), 25–35. T RIMARAN . An infrastructure for research in ILP, 2000. http://www.trimaran.org/.