Proceedings of the Federated Conference on Computer Science and Information Systems pp. 723–728
ISBN 978-83-60810-22-4
Data Centered Collaboration in a Mobile Environment Maciej Pańka
Piotr Bała
Nicolaus Copernicus University University Center for Modern Teaching Technologies ul. Gagarina 17, 87-100 Toruń, Poland Email:
[email protected]
Nicolaus Copernicus University Faculty of Mathematics and Computer Science ul. Chopina 12/18, 87-100 Toruń, Poland and ICM, University of Warsaw ul. Pawinskiego 5a 02-106 Warszawa, Poland Email:
[email protected]
Abstract—In this paper we present a system we have developed for a mobile audio-video collaboration that is centered around the distributed datasets. In our approach all the data are processed remotely on dedicated servers, where they are successively rendered off-the-screen and compressed using a video codec. The signals captured from the users' cameras are transferred to the server in real time, where they are combined with the data frames into single video streams. Dependent on the device's capabilities and current network bandwidth every session participant receives individually customized stream, which presents both the remote data and the camera view of currently chosen presenter alternately. At the end of this paper we also present the results of the system's performance test that we have obtained during the collaborative visualization of a remote, multidimensional dataset using different kind of modern mobile devices, including tablets and cell phones.
I. INTRODUCTION
W
ITH the dynamic advancement of a broadband Internet access and a pervasive computerization the demand for modern collaboration techniques grows rapidly. First videoconferencing meetings were usually realized in dedicated rooms, equipped with a professional audio-video hardware and a very fast network connection, which allowed for the low latency transfer of the complex multimedia data. For the last couple of years the same functionality have been successively enabled in many software solutions, that could be widely used also in a personal computer environment, e.g. Skype [1], Big Blue Button [2], Open Meetings [3] or Adobe Connect Pro [4]. All of these applications have a built in support for different types of synchronous collaboration techniques, including text based chats, teleconferencing, as well as a fully interactive audio-video communication. Beside the communication between the session participants, distant collaboration usually involves working with the data. Depending on the discipline, the type of this data can be different and could vary from simple presentations to a very complex multimedia content sharing. Most of the existing videoconferencing systems have a built-in support for different kind of synchronous resource sharing, including white boards or screen capture functionalities. However, these solutions are only sufficient when a single presenter
c 2011 IEEE 978-83-60810-22-4/$25.00
723
shares the resources, which are stored locally on his computer. Unfortunately, none of the existing videoconferencing systems allow the collaboration that would be centered around the distributed datasets, usually stored on different remote servers. One of the most challenging area in this approach is a cooperative visualization of the scientific, multidimensional resources. Most of the modern simulations and experiments are so complex, that they must be realized in dedicated computing centers. The size of the processed data is usually so large that they cannot be easily transferred between distant computers and must be stored in a place where they were generated. On the other hand, many scientific activities require a real time cooperation of researchers representing different disciplines, which should have a possibility to share these data remotely. Moreover, with the growing popularity of wireless networks and ubiquitous computing, this collaboration should also be accessible with the use of different types of mobile devices, including tablets and cell phones. In this paper we propose a different approach to a video based collaboration, which is centered around the distributed datasets and could be effectively realized in a mobile environment. The system we have developed processes all the data remotely on dedicated servers and transcodes them into a series of digital images representing different views of a visualized resources. Successive frames are compressed using a video codec and synchronously broadcast to all session participants. Users can also broadcast the audio-video signal captured from their cameras and microphones, which is later combined with the visualization frames into a single video stream. This approach takes off all the complex computations from the mobile clients, leaving them only with the video decompression, assuring thereby a highly interactive visualization of the remote data. This paper is organized as follows. Section 2 covers some of the previous works covering remote data visualization in a collaborative environment. In section 3 we describe in details the system architecture and the technologies we have used to implement it. Section 4 presents the results of the system performance tests and section 5 concludes this paper drawing up further work.
724
PROCEEDINGS OF THE FEDCSIS. SZCZECIN, 2011
II. RELATED WORK There are two general approaches to the collaborative visualization of the distributed datasets. The first category involves systems where the data are transferred from distant servers to session participants, which process them locally using computational power of their devices. In this model a selected session moderator manipulates the remote data using his device, sending thereby successive directives to the main session server. The server broadcasts these directives in real time to the rest of connected users, which in response adequately synchronize their local resources. The references [5] and [6] present two different systems which derive from this approach and make use of the Virtual Reality Modeling Language, which is a popular text file standard for representing 3D scenes on the Internet. The communication between session participants is realized in separate channels, by means of text chats and teleconferencing modules. The VRML standard has also been successfully adopted into the mobile data visualization. Exemplary solutions were presented in [7] and [8], where the authors introduced two different systems running on Sony Ericsson P800 and PocketPC Compaq iPAQ respectively. A slightly different approach has been presented in the reference [9], which covers collaborative data visualization in a grid environment. The authors made use of the Interactive Data Language, which is a programming language dedicated mostly to solve 2D / 3D interactive visualization problems. The data synchronization in the proposed solution was realized by means of Narada Brokering Messaging Service. Similar example was also presented in the reference [10], where the authors made use of a shared export concept, which allows capturing of different inputs from a running application and they later broadcast to distant users. The second category of collaborative visualization solutions involves systems, where all the complex computational tasks are realized on dedicated servers and broadcast to users as a series of graphical images (frames) representing different data views (movement, zooming, 3D objects rotation or animation). When the visualization is realized in a multiuser environment, the image series generated by the server should be broadcast to all session participants simultaneously, allowing thereby a synchronous data sharing [12]. One of the biggest challenges in this approach is a compression of the image data, which in case of very complex resources could be the cause of a network communication latency. Dependent on the dimension of the input data, different compression techniques could be used. The authors of [11] and [12] have developed their systems using popular lossless compression algorithms, including ZLIB, LZO, BZIP2 or RLE. However, higher compression ratios could be achieved with the use of a lossy image compression method, for example a JPEG standard [13]. Similar results could be also obtained with the use of JPEG2000, which is the newer version of the JPEG algorithm. Beside high compression ratios, the JPEG2000 has a built in support for the progressive image transmission and the regions of interest concept, which in context of a mobile visualization could increase the overall efficiency of the system [14, 15].
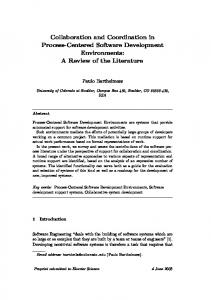
With the use of the Motion JPEG2000 technique and a JPIP server, the JPEG2000 could also be adopted to the animated data compression. However, in this area, much better results could be achieved by means of a dedicated video codec. The references [16] and [17] introduce exemplary collaborative systems, which generate video sequences on the server and push them individually to every session participant, where they are later decoded and displayed on the screen. The authors made use of the H.263 and H.261 video codecs respectively. A very similar system have been developed by the authors of [18], where the MPEG-4 standard was used for a video compression. A server side encoding was realized by means of the MPEG4IP library, which compressed the video and streamed it to the Apple's Darwin Media Server using RTSP protocol. Apple's server republished this video to the rest of the session participants. The MPEG4 standard has also been successfully adopted to the remote visualization of a 3D data on different mobile devices [19, 20]. We believe that the most effective approach to the data visualization on mobile devices is by means of the image based streaming techniques, which take off most of the computational power from thin handhelds, leaving them only with data decompression. Modern mobile devices still have many limitations compared to the desktop computers, which obstruct effective rendering of the complex data, e.g. CPU and GPU power, RAM and hard drive capacities, battery lifetime or screen sizes. Unfortunately, none of the existing mobile visualization systems allow fully interactive, real time audiovideo collaboration of distant users. On the other hand, currently available videoconferencing systems allow only local data sharing, but they do not support distributed datasets visualization. Moreover, most of these systems were designed in order to cooperate with the desktop computers, and they couldn't be easily adopted to the mobile environment. III. SYSTEM ARCHITECTURE A. Collaborative Visualization Overview The system consists of a client application, run on thin mobile devices, and a server application, which processes the complex data. A server is also responsible for the session management and data synchronization between all connected users. The general architecture of our system has been shown on Fig. 1. All users connected to the server are able to view and listen to the session proceeding but only one of them could additionally be a session presenter. Only the currently chosen presenter is able to control the remote data and broadcast his camera's signal to the rest of participants. For the whole session all users are also able to ask the questions and comment the presentation in front of the group using their devices' microphones. At the beginning of each session the presenter initializes the remote data on the server, which could be either read from a disk, database or even generated in real time by a dedicated rendering machine. Once the data are loaded by the server they are rendered off the screen, producing there-
MACIEJ PANKA, PIOTR BALA: DATA CENTERED COLLABORATION IN A MOBILE ENVIRONMENT
Fig 1. A general architecture of the system.
by a series of digital images, which represent different views of the input resources. Our framework is completely transparent on the data source and their dimensions, which could be either 2D, 3D or even animated data. Two dimensional data are represented as single pictures, while 3D and 4D data produce the whole series of images, which represent data rotation and animation frames respectively. The generated image sequences are compressed by the server on-the-fly with the use of a dedicated video codec and streamed to all session participants in real time. Every connected user receives his own video stream, individually customized to the capabilities of his device and current network bandwidth. At the beginning of each session the system detects the screen size of a user's handheld, allowing thereby frames scaling on the server. The network bandwidth is also measured during the connection, and it is periodically tested for eventual variations later during the session. Based on these two parameters the server dynamically adapts the resolutions and bit rates of all outgoing video streams. Once the session is initialized, the presenter is able to manipulate the remote data using his mouse or touch gestures. Dependent on the data dimension the presenter can zoom the view, move to different regions of an image, rotate the 3D model over the X and Y axes or even pause the animation and swap between its successive frames. Adequate directives are send in real time from the presenter's device to the server, which in response processes the input data, generates adequate video frames and streams them to users. The bit rates of all outgoing videos are changed dynamically by the server
dependent on the current state of the presentation. During the data motion (moving, zooming, rotating) the bit rate is automatically decreased, because there is no need to display the output in full details. Once the motion stops the server encodes the last frame using a higher bit rate, increasing thereby its quality. If more details are needed, users are also able to download the last frame from the server in a completely uncompressed form. This approach saves the network bandwidth and allow highly interactive performance of the system. In addition to the remote data visualization all session participants are able to collaborate using a built in videoconferencing solution. The signals captured from the presenter's camera and microphone are streamed to the server, where they are processed in real time. The camera signal is decomposed, producing thereby an uncompressed series of images, which are later combined with the visualization frames and audio packets into a single video stream. The session presenter decides which signal should be visible at the moment for the rest of participants: his camera or the remote data view. Dependent on his choice the server encodes appropriate video frames. Additionally, during the whole session every user is able to individually manipulate currently presented data, e.g. viewing the 3D objects from different angles. In that case only the frames, which represent the visualized data are received from the server. The video signal is additionally combined with the presenter's audio packets, allowing thereby simultaneous lecture listening. In a free look mode every user receives his own instance of the remote data, having a chance to control them independently from the rest of participants. At any point during the session the free look mode could be switched back to the presenter's video transmission. B. Server Side Application A server side application contains of a central session management module and a processing cluster, as shown in Fig. 2. At the beginning of every session users connect to the session management module, which stores the information about data locations and the addresses of all processing units being part of the system. The session manager also acts as a proxy for the audio-video communication and provides different types of real time collaboration techniques, e.g. shared board, which allows synchronous drawing on the presentation and marking its different regions of interest. The central management server is also responsible for the authentication and dynamic roles switching between session participants. Data generation and audio-video encoding are realized in the processing units, which are built of two different machines working in parallel: an audio-video encoder and a rendering server. Dependent on the number of concurrent users a single processing cluster could be built of more than one pair of the encoding and rendering servers, allowing thereby a better load balancing. Every collaborative session begins in the central manager module, which at the startup collects the information about all connected clients, including their screen resolutions and current network bandwidths. Based on these parameters and a number of concurrent users it selects the least loaded en-
725
726
PROCEEDINGS OF THE FEDCSIS. SZCZECIN, 2011
The audio-video communication is realized through the session manager, which republishes the live streams in both directions. This approach takes off a lot of computational power from the processing units, reducing the number of the video streams they must encode. For example, when different session users have the same screen resolutions and similar network capabilities the encoder generates only a single video stream, which is later republished by the session manger. On the other hand, with the use of the video proxy, the users are able to dynamically switch between different processing units, without the need of leaving their current session rooms.
Fig 2. The server side application works in a distributed environment, where every part of the system is run on a different machine.
coding server from the cluster, responsible for further data processing. The selected encoder prepares an individual broadcasting object for each of the outgoing videos, which are run in separate threads, allowing thereby a parallel encoding of multiple video streams on a single machine. In case of many simultaneous users the broadcasting threads could be additionally distributed between different processing units of the cluster. Successive directives received from the presenter are broadcast in real time by the central management server to every encoder involved in the session. Based on these directives the encoding servers request successive video frames from appropriate rendering machines. Dependent on the data source the rendering machines load appropriate frames from a database, storage device or a dedicated rendering server and streams them to the encoders using a TCP socket connections. During a typical visualization session the renderer and encoder exchange large amount of the image data, so it is recommended that they communicate using a broadband network connection. We have not implemented any compression technique at this point, because it would require an extra CPU power from both servers, which could be the cause of an additional latency. Successive frames received from the rendering server are passed to the appropriate encoding threads, where they are scaled, compressed using a video codec and broadcast to the session manager, which republishes them to the rest of users. Additionally, during the whole session the presenter broadcasts his video camera signal to the session manager, which republishes it to the encoding servers. Each of the encoders decompress this signal and combine it with the appropriate images received from the rendering server.
C. Implementation Our system consists of a client application and a set of distributed server side programs. All server side applications have been implemented using Java language. Additionally, the session manager makes use of the Wowza Media Server, which supports audio-video streams republishing. The communication between the processing units and the session manager is realized with the use of the Adobe's Real Time Messaging Protocol, which allows both a live audio-video streaming and a control information transmission. The current version of the client application has been developed using the ActionScript 3.0 technology, which with the use of the Adobe's Flash Player could be deployed on most of the modern mobile operating systems, including Google's Android, BlackBerry OS and Apple's iOS (using the Adobe's iPhone packaging library). Video compression is realized with the use of the Sorenson Spark codec, which is an improver version of the H.263 standard, dedicated for a low latency Internet communication. The audio is compressed using the low latency Nellymoser Asao codec. However, the system is completely transparent in sense of the client application technology and could be very easily adapted to any other mobile operating system and audio-video codecs. IV. RESULTS We have run a series of tests of our system, checking both the server and client applications performances. The server side applications have been deployed on three different machines: an Intel Xeon 5050 3GHz running the session management module, a dual core Intel Xeon X5355 2.6 GHz, which was rendering the data visualization frames, and a quad core Intel Xeon E5420 2.5 GHz responsible for the audio-video encoding. A client application was tested on three different mobile devices: a 7” Samsung Galaxy Tab tablet and a 3.7“ HTC Desire cell phone, both running the Google's Android 2.2 operating system, and a 10.1” Apple's iPad equipped with the iOS 4.3. The servers were communicating using a 1Gb wired LAN connection, while the client's devices used a standard 802.11g wireless connection. All tests were run for two different sizes of the video streams, 320x240 and 640x480 pixels respectively, which are the most popular resolutions of the video cameras available in modern desktops and mobile devices. All videos were en-
MACIEJ PANKA, PIOTR BALA: DATA CENTERED COLLABORATION IN A MOBILE ENVIRONMENT
coded using 15 frames per seconds parameter, which is a sufficient setting for a smooth video reception. The purpose of a client's application test was to measure the CPU usage during three different activities: a single live video decoding, a camera signal encoding, as well as both of them run at the same time. During the third of the above tests the signal captured from the video camera was broadcast to the encoding server, where it was combined with the visualized data frames and pushed back to the same client. However, none of the tests that involved camera signal publishing could be run on the Apple's iPad, because this device has not been equipped with the video camera. The results of the client's application tests are presented in tables 1 and 2. The video streams decoded on all three devices were displayed very smoothly, consuming less than a half of the processor power in most cases. During the camera signal encoding the average CPU usage increased, but has not affected the overall performance of the system. The iPad's CPU usages during the video decompressions were slightly higher compared to the both Android devices. This is caused by the fact, that Flash Player has not been natively available for the iOS system and our application had to be transcoded into the Objective-C using the Adobe's AIR 2.7 SDK. Nevertheless, we have not noticed any differences in the client's application effectivenesses on any of the tested devices.
the server's performance lowered and the network communication latency increased, preventing thereby the efficient video encodings. However, with the use of the multiple processing units the overall load of the system could be distributed between different machines, allowing thereby a higher number of simultaneous connections. TABLE III. THE PERFORMANCE OF THE ENCODING SERVER DURING DIFFERENT MULTIUSER SESSIONS USING 320 X 240 VIDEO STREAMS 1 user
20 users
40 users
55 users
CPU usage (quad core)
4%
85%
240%
380%
Single frame decoding time [ms]
0.3
0.5
0.8
6.1
Single frame encoding time [ms]
1.4
1.9
3.6
23.8
TABLE IV. THE PERFORMANCE OF THE ENCODING SERVER DURING DIFFERENT MULTIUSER SESSIONS USING 640 X 480 VIDEO STREAMS 1 user
5 users
10 users
20 users
CPU usage (quad core)
15%
75%
240%
380%
Single frame decoding time [ms]
1.3
1.6
3.0
65
Single frame encoding time [ms]
4.8
5.9
12.9
110
TABLE I. AVERAGE CPU USAGES OF THREE DIFFERENT MOBILE DEVICES DURING THE ENCODING AND DECODING OF A 320 X 240 VIDEO STREAMS Activity
Samsun Galaxy Tab
HTC Desire
iPad
Decoding
30%
32%
55%
Encoding
60%
60%
-
Decoding and encoding
80%
70%
-
TABLE II. AVERAGE CPU USAGES OF THREE DIFFERENT MOBILE DEVICES DURING THE ENCODING AND DECODING OF A 640 X 480 VIDEO STREAMS Activity
Samsun Galaxy Tab
HTC Desire
iPad
Decoding
35%
40%
80%
Encoding
90%
85%
-
Decoding and encoding
90%
90%
-
In addition to the client's application performance, we have also measured the efficiency of the encoding server during a sample multiuser session. We experimented with different numbers of simultaneous video streams encodings, which varied from 1 to 60 connections. Beside the CPU usages of the server, we have also calculated the average times of the single video frame encodings and decodings. We have also tried to estimate the highest possible number of concurrent video encodings for a single machine used in this experiment. Tables 3 and 4 present the obtained results. The maximum number of efficient parallel encodings were 55 and 20 for 320x240 and 640x480 videos resolutions respectively. Below these levels all videos were streamed very smoothly, having less than a half of a second latency. When the number of concurrent users reached the maximum values,
727
V. CONCLUSION
AND
FUTURE WORK
In this paper we presented the system for the collaborative visualization of distributed datasets on mobile devices. In our approach the remote data are rendered on dedicated servers, where they are combined with the users' audio-video signals. The output image sequences are compressed usxing a dedicated video codec and broadcast to all session participants, presenting the visualized data and the camera view alternately. All users can also communicate in real time using a built in teleconferencing solution. We have also run a series of the performance tests for both the client and server applications. The results we have obtained showed, that our system allows an effective, highly interactive data visualization, even with many simultaneous users connected to a single server. It is also compatible with most of the modern mobile devices, including tablets and cell phones. In the future we are planning to implement the support for other popular video codecs, including the H.264 and VP8 standards. We also want to improve the server side data processing with the use of a dedicated graphical unit, e.g. NVIDIA CUDA, which should increase the overall performance of the system. VI. ACKNOWLEDGMENT This work has been supported by the eea grant PL-0262. REFERENCES [1] [2]
Skype, http://www.skype.com/ Big Blue Button videoconferencing system, http://bigbluebutton.org/
728
PROCEEDINGS OF THE FEDCSIS. SZCZECIN, 2011
[3]
Open Meetings videoconferencing system, http://code.google.com/ p/openmeetings/ [4] Adobe Connect Proc, http://www.adobe.com/products/ adobeconnect.html [5] K. Engel, T. Ertl, „Texture-based Volume Visualization for Multiple Users on the World Wide Web”. [6] S. Lovegrove, K. Brodlie, „Collaborative Research Within a Sustainable Community: Interactive Multi User VRML and Visualization”. [7] M. Mosmondor, H. Komericki, I.S. Pandzic, „3D Visualization of Data on Mobile Devices”, IEEE MELECON ’04, 2004. [8] R. R. Lipman, „Mobile 3D visualization for steel structures”, Animation in Construction 13, 119-125, 2004. [9] M. Wang, G. Fox, M. Pierce, „Grid-based Collaboration in Interactive Data Language Applications”. [10] S. Lee, S. Ko, G. Fox, „Adapting Content for Mobile Devices in Heterogeneous Collaboration Environments”. [11] Z. Constantinescu, M. Vladoiu, „Adaptive Compression for Remote Visualization”, BULETINUL Universitatii Petrol, Gaze din Ploiesti, vol. LXI, p. 49-58, 2009.
[12] K. Engel, O. Sommer, T. Ertl, „A Framework for Interactive Hardware Accelerated Remote 3D-Visualization”. [13] K. Ma, D. M. Camp, „High Performance Visualization of TimeVarying Volume Data over a Wide-Area Network”, IEEE, 2000. [14] D. Dragan, D. Ivetic, „Architectures of DICOM based PACS for JPEG2000 Medical Image Streaming”, ComSIS, vol. 6, No. 1, 2009. [15] N. Lin, T. Huang, B. Chen, „3D Model Streaming Based on JPEG 2000”. [16] K. Engel, O. Sommer, C. Ernst, T. Ertl, „Remote 3D Visualization using Image-Streaming Techniques”. [17] M. Hereld, E. Olson, M.E. Papka, T.D. Uram, „Streaming visualization for collaborative environments”. [18] F. Goetz, G. Domik, „Remote and Collaborative Visualization with openVisaar”. [19] Y. Noimark, D. Cohen-Or, „Streaming Scenes to MPEG-4 Video Enabled Devices”, IEEE Computer Graphics and Applications, 2003. [20] L. Cheng, A. Bhushan, R. Pajarola, M.E. Zarki, „Real-Time 3D Graphics Streaming using MPEG-4”, 2004.