www.nature.com/scientificreports
OPEN
Data Clustering using Memristor Networks Shinhyun Choi*, Patrick Sheridan* & Wei D. Lu
received: 04 March 2015 accepted: 15 April 2015 Published: 28 May 2015
Memristors have emerged as a promising candidate for critical applications such as non-volatile memory as well as non-Von Neumann computing architectures based on neuromorphic and machine learning systems. In this study, we demonstrate that memristors can be used to perform principal component analysis (PCA), an important technique for machine learning and data feature learning. The conductance changes of memristors in response to voltage pulses are studied and modeled with an internal state variable to trace the analog behavior of the device. Unsupervised, online learning is achieved in a memristor crossbar using Sanger’s learning rule, a derivative of Hebb’s rule, to obtain the principal components. The details of weights evolution during training is investigated over learning epochs as a function of training parameters. The effects of device non-uniformity on the PCA network performance are further analyzed. We show that the memristor-based PCA network is capable of linearly separating distinct classes from sensory data with high clarification success of 97.6% even in the presence of large device variations.
The von Neumann architecture, widely used in conventional computing systems, has become less optimal in data-intensive tasks due to limited data transfer rates between the memory and the central processing unit. Alternative computing systems such as neuromorphic or machine learning systems, have attracted increasing attention in dealing with “big data” problems such as pattern recognition from large amounts of data sets1,2. Principal component analysis3 is an important technique used in machine learning to discover orthogonal factors underlying multivariate data by examining the correlations among the set of input variables. The technique can also be used to reduce the dimensionality of input data and is thus an important preprocessing step for many machine learning algorithms. Here we show that principal component analysis (PCA) can be efficiently achieved in simple memristor-based crossbar networks with online learning capability, allowing this technique to be used to effectively classify sensory data. The two key factors that make memristor crossbar arrays attractive for neuromorphic or machine learning systems are 1) their ability to naturally implement matrix operations (e.g. dot-product): due to the resistive nature of the two-terminal device, the memristor crossbar array can directly convert an input voltage vector into an output current (or charge) vector, weighed by the memristor conductance at each matrix element, thus directly and efficiently performing the matrix operation; and 2) their ability to achieve online learning with simple programming pulses: the weights of the memristor crossbar matrix - the device conductances, can be incrementally trained using simple voltage pulses4–5. Other properties such as high density, low power consumption, long cycling endurance and subnanosecond switching speed have also been demonstrated in memristor devices6–10. A typical memristor device consists of a transition metal oxide layer such as TiOx, HfOx, WOx sandwiched by a pair of electrodes11–13. The resistance of the memristor device can be adjusted by controlling the amount and distribution of oxygen vacancies, which modulate the local conductivity in the oxide layer14,15. Using an unsupervised, online learning rule, we show that crossbar arrays of memristors can learn the principal components from sensory data (e.g. database of breast cancer measurements) and effectively separate unlabeled data into clusters. After data clustering, a conventional supervised learning process can then be used to define a decision boundary and effectively classify tumors as malignant or benign. Department of Electrical Engineering and Computer Science, University of Michigan, Ann Arbor, Michigan 48109, USA. *These authors contributed equally to this work. Correspondence and requests for materials should be addressed to W.D.L. (email:
[email protected]) Scientific Reports | 5:10492 | DOI: 10.1038/srep10492
1
www.nature.com/scientificreports/
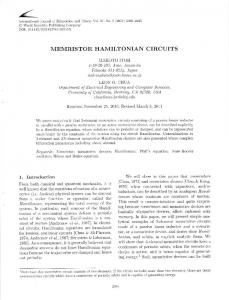
Figure 1. Memristor device and modeling. (a) DC I-V characteristics of a typical memristor device showing the bipolar switching effect. (b) Schematic of a memristor device. The region with high oxygen vacancy concentration (bounded by the black lines) forms the conduction channel. (c) Calculated memristor conductance and the internal state variable w during the application of 100 potentiation pulses (− 1 V, 10 μ s) and 100 depression pulses (1.15 V, 10 μ s). (d) Measured (blue) and calculated (purple) conductance values measured by a read (0.2 V) pulse during 4 periods of 100 potentiation and 100 depression pulses.
Results
Memristor Behavior. The analog switching behavior is obtained from a tantalum-oxide memristor based on a bilayer structure consisting of an oxygen-rich Ta2O5 layer and an oxygen-deficient TaOx layer6,10,14,16. We have shown that such a memristor with the tantalum oxide layer doped with silicon atoms can show improved dynamic range and controllable analog switching behavior17. In this study, 2 μ m × 2 μ m devices and crossbar arrays were used following the processes discussed in Ref. 17. During measurements, the bias voltage was applied to the top electrode (TE) while the bottom electrode (BE) was grounded. Fig. 1a shows DC current – voltage (I- V) curve of a device showing typical bipolar resistive switching characteristics. In this system, an applied voltage can change the amount and distribution of oxygen vacancies and modulate the conductive channels in the Ta2O5 layer which controls the conductance of the device14–17, as schematically shown in Fig. 1b. To model the conductance change of the memristor, we introduce the internal state variable, w, which serves as an area index representing the number of conductive filaments or, equivalently, the area covered by the conductive channel as shown in Fig. 1b. The dynamics of the state variable in response to the applied voltage is described by equation (1), where u() is the Heaviside step function, k, μ1, u2, are positive parameters determined by material properties such as ion hopping distance and hopping barrier heights13 (Supplementary Information). dw = (w − 1)2 k (e−μ1V − e μ2 V ) u (− V ) + w 2k (e−μ1V − e μ2 V ) u (V ) dt
(1 )
I = w γ sinh (δ × V ) + (1 − w ) α (1 − e−β× V ) )
(2)
Scientific Reports | 5:10492 | DOI: 10.1038/srep10492
2
www.nature.com/scientificreports/
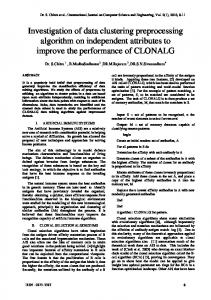
Figure 2. Schematic of the memristor network. The inputs are connected to the rows and fed to the network. The outputs are connected to the columns. The memristor devices are located at the crosspoints in the network and the weights of the memristor devices associated with a given output form the principal components after training.
The current through the device is described by equation (2) which consists of the term describing conduction through the channel area (first term) and the rest of the device (Schottky-dominated conduction, second term)13. This equation clearly shows how the device conductance is regulated by the state variable, w. γ, δ, α, β are positive parameters determined by material properties such as the effective tunneling distance, tunneling barrier, the depletion width of the Schottky barrier region and Schottky barrier height13 (Supplementary Information). The memristor model, consisting of the state variable dynamic equation (1) and I-V equation (2), was tested against experimental measurements. For example, in Fig. 1c, pulse programming conditions were simulated with the application of a train of one-hundred − 1 V, 10 μ s pulses followed by a train of one-hundred 1.15 V, 10 μ s pulses, with the device conductance monitored with a 0.2 V read pulse after each training pulse. With the application of a negative pulse, the memristor conductance gradually increases (purple curve), followed by the increase in the internal state variable value (blue curve). On the other hand, a positive pulse decreases the conductance following the decrease of the internal state variable value. The experimental data measured form an actual memristor device and the simulation data were compared and plotted together in Fig. 1d, showing that the model can trace the experimental data precisely.
Neural Network Construction. To implement PCA, we adopted a neural network structure using a
crossbar array of memristors as shown in Fig. 2, where the n input channels are connected to the rows and the m output channels are connected to the columns of the memristor crossbar network. In this study, a standard breast cancer data set from University of Wisconsin Hospitals, Madison was used as the input signal data18,19. The data set consists of breast cell mass properties in 9 categories including clump thickness, uniformity of cell size, uniformity of cell shape, marginal adhesion, single epithelial cell size, bare nuclei, bland chromatin, normal nucleoli and mitoses. The sensory data were derived from a digitized image of a fine needle aspirate (FNA) of a breast mass and each category has a range from 0 to 10. In a feature learning test, the measurement results from the 9 categories of a given cell are fed to the 9 inputs (n = 9) of the neural network, and the output is obtained from the 2 output channels (m = 2). The input signals are implemented as voltage pulses with fixed amplitude (0.2 V) and variable pulse widths proportional to the measured values in the corresponding category. Each training cycle consists of one hundred randomly sequenced data points (50 points from benign class, 50 points from malignant class). Afterwards, the ability of the network to successfully cluster the data and classify a cell as either benign or malignant was tested using 583 data points (not included in the training set). As discussed earlier, in this configuration the output vector is determined by the dot-product of the input vector and the memristor weight matrix. Additionally, the network learns the principal components by adjusting the memristor weights during training. In this study, starting from a memristor Scientific Reports | 5:10492 | DOI: 10.1038/srep10492
3
www.nature.com/scientificreports/ network with randomly distributed weights, we employ Sanger’s rule (also known as the generalized Hebbian algorithm) to implement online learning to learn the principal components of the input data set. Sanger’s rule is derived from Hebb’s learning rule20,21 and these model learning rules have been widely adapted in artificial neural networks. Specifically, Sanger’s rule utilizes the weight (g), output response (y) and present input (x) as shown in equation (3).
∆ g ij = η y j (x i −
j
∑g ik y k )
(3 )
k=1
where η is the learning rate and is typically a small positive value(