Data Mining and Automatic OLAP Schema Generation Muhammad Usman
Sohail Asghar
Simon Fong
Auckland University of Technology, Auckland, New Zealand
Mohammad Ali Jinnah University, Islamabad, Pakistan
University of Macau, Taipa, Macau SAR
[email protected]
[email protected]
[email protected]
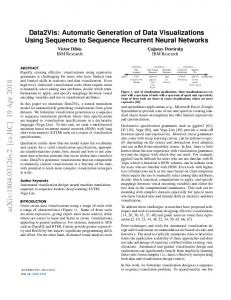
Abstract— Data mining aims at extraction of previously unidentified information from large databases. It can be viewed as an automated application of algorithms to discover hidden patterns and to extract knowledge from data. Online Analytical Processing (OLAP) systems, on the other hand, allow exploring and querying huge datasets in interactive way. These OLAP systems are the predominant front-end tools used in data warehousing environments and the OLAP system’s market has developed rapidly during the last few years. Several works in the past emphasized the integration of OLAP and data mining. More recently, data mining techniques along with OLAP have been applied in decision support applications to analyze large data sets in an efficient manner. However, in order to integrate data mining results with OLAP the data has to be modeled in a particular type of OLAP schema. An OLAP schema is a collection of database objects, including tables, views, indexes and synonyms. Schema generation process was considered a manual task but in the recent years research communities reported their work in automatic schema generation. In this paper, we reviewed literature on the schema generation techniques and highlighted the limitations of the existing works. The review reveals that automatic schema generation has never been integrated with data mining. Hence, we propose a model for data mining and automatic schema generation of three types namely star, snowflake, and galaxy. Hierarchical clustering technique of data mining was used and schema from the clustered data was generated. We have also developed a prototype of the proposed model and validated it via experiments of real-life data set. The proposed model is significant as it supports both integration and automation process. Index Terms—Automatic Hierarchical Clustering, OLAP.
O
schema,
Data
Mining,
I. INTRODUCTION
LAP technology refers to a set of data analysis techniques to view the data from all of the transactional systems in an interactive way in order to support the decision-making process. The growing complexity and volumes of the data to be analyzed impose new requirements on OLAP systems. According to [1] and [2] OLAP systems have rapidly gained momentum in both the academic and research
communities, mainly due to their quick and multidimensional analysis capabilities. It plays a vital role in data analysis to identify the key performance indicators of business and other application domains. In addition to this, it is an essential element of the decision support system and permits decision makers to visualize huge operational data for consistent and interactive analysis. Furthermore, it is becoming more accepted due to the recognition of the business value of exploring and querying huge amounts of data sets in a multi-dimensional way. During the last few years OLAP systems are predominant front-end tools used in data warehousing environments and OLAP system’s market grew rapidly. However, the growing complexity and volumes of the data to be analyzed impose new requirements on OLAP systems [3]. The major contribution of this paper is the attempt of combining OLAP and data mining. According to [4], data mining is a step in the overall concept of knowledge discovery in databases (KDD) and data mining techniques like Association, Classification, Clustering and Trend analysis can make OLAP more useful and easier to apply in decision support systems. More recently, data mining techniques have been applied in decision support applications in order to detect patterns and to extract knowledge form data. Several previous works [5, 6, 7 and 8] proved the likelihood and interest of coupling OLAP and data mining. Hierarchical clustering is one of the dominant data mining techniques. In this paper, we have applied the hierarchical clustering technique of data mining as a preprocessing step. Previously, hierarchical clustering has been used by [9, 10, 11, 12, and 13] in conjunction with OLAP systems for a number of reasons which include query optimization, physical data organization, fast data access and reduced storage cost. We intend to use the results of this hierarchical clustering technique in the form of data clusters to generate automatic schemas for enhanced OLAP system. As far as the automatic generation of OLAP schema is concerned, [14, 15, 16, and 17] reported the work in this area. To the best of our knowledge none of these works used hierarchically clustered data to generate OLAP schema. Furthermore, the authors used ER diagrams or conceptual graphical models to produce only star schema. Another major limitation in the automation work is that the tools and techniques used for schema generation only draws 1
or identifies the structure of schema. It doesn’t populate the actual data in the generated schema. In this paper, we are not only generating OLAP schema of three types namely; star, snowflake and galaxy; our automated schema builder tool provides automation in uploading the data from clustered files to relevant portions of the automatically generated schema. On the basis of these observations and limitations, we proposed a model for automatic schema generation. The proposed model, firstly, integrates OLAP with data mining technique of hierarchical clustering and secondly, enables automatic schema generation. A prototype of the proposed model is developed by using our schema generation algorithms. Validation has been done by performing experiments on a real-life data set. Experimental results prove that the proposed automatic schema generation process by integrating OLAP with data mining system can be achieved which makes significant advancement in the modern automation models. The remaining portions of this paper are organized as follows: Section II presents the literature review. Section III elaborates the proposed model for automatic schema generation. Section IV discusses the implementation and experimentation details of the developed prototype. Finally, section V provides conclusions and possible future research directions. II. LITRATURE REVIEW The purpose of this literature review is to introduce and identify the limitations of automatic schema generation process by the other researchers. Our focus would be on the use of hierarchical clustering to automate the process of OLAP schema generation. The review is categorized over three major themes: (1) combining OLAP with data mining, (2) use of hierarchical clustering with OLAP, and (3) automation in OLAP schema generation. A. Combining OLAP with Data mining Several previous studies [5, 6, 7 and 8] emphasized the possibilities and interest of coupling OLAP and Data Mining. The authors in [24] indicated the efficiency and effectiveness of integrating data mining into OLAP and OLAM systems. OLAM is a promising direction for mining knowledge from multidimensional databases [8]. Similarly, Hua [18] proposed and developed an interesting association rule mining approach called Online Analytical Mining of association rules. It integrated OLAP technology with association rule mining methods. The results lead to flexible multidimensional and multi-level association rule mining. Similarly, Joseph et al. [19] presented a methodology that derives the association rule of web pages click sequences according to the support level and confidence level of user requirements. This methodology was responsible for identifying a set of frequently accessed web pages on a website by a user. The result is a list of potential customers for a certain product or service on a target web page. Dzeroski et al. [20] combined OLAP and
Data Mining in a different way to discover patterns from a database of patients. Two data mining techniques, clustering and decision tree induction were used. Clustering was used to group patients according to the overall presence/absence of deletions at the tested markers. Decision trees and OLAP were used to inspect the resulting clustering and to look for correlations between deletion patterns, populations and the clinical picture of infertility. Dehne et al. [21] studied the applicability of coarse grained parallel computing model (CGM) to OLAP for data mining. Authors presented a general framework for the CGM which allows for efficient parallelization of the existing data cube construction algorithm for OLAP. Experimental data showed that this approach yields optimal speed up even when it runs on a simple processor cluster via a standard switch. The study shows that OLAP and data mining, when combined together, can produce greater benefits in a number of diverse research areas. Our proposed work is similar in terms of combining OLAP and data mining techniques. Our main focus however is on a particular data mining technique known as Hierarchical Clustering. Furthermore, we are using data mining as a pre-processing step to get a better understanding of data before passing it to the automatic schema builder and then generates schema for the OLAP engine. In the next section, our survey confines down to the relations of data mining techniques to hierarchal clustering, and their usages with OLAP. B. Use of Hierarchical Clustering with OLAP Hierarchical clustering of data is a well know mining technique and it has been used by a number of research communities in the past. Markl et al. [9] suggested that OLAP performance can be improved by using the Multidimensional Hierarchical Clustering (MHC) technique. Clustering was introduced as a way to speed up query aggregation without additional storage cost for view materialization. The authors identified the problem with queries which either select a very small set of data or perform aggregations on a fairly large data set. The sole contribution of their work is an encoding scheme for hierarchical dimensions that enables clustering of data with respect to multiple and hierarchical dimensions. The major strength of the work lies in the comparison of their MHC technique with the traditional bitmap indexing approach on the real world data (7GB in size) and finding an increase in the performance up to the factor of 10. Markl et al. [10], again utilized hierarchical clustering in the context of OLAP queries. Authors investigated the impacts on query processing in RDBMS when using UBTrees and multidimensional hierarchical clustering for physical data organization. Furthermore, they illustrated the benefits achieved by performance measurements of queries using star schema for a real world application of a SAP business information warehouse. Karaynnidis et al. [11], proposed a novel multidimensional file structure for organizing the most detailed data of the cube, the CUBE file. The CUBE file archives hierarchical clustering of data enabling fast access via hierarchical restrictions. It imposes low storage cost and adapts perfectly to extensive sparseness of data space. 2
Results show that the CUBE File outperforms the most effective method proposed up to now for hierarchically clustering the cube, resulting in 7-9 times less I/Os on average for all workloads tested. In the same context, Theodoratos et al. [12] claimed the Heuristic Optimization of OLAP in MHC (Multidimensionally Hierarchically Clustered) databases. They identified the problem that commercial relational database management systems use multiple one-dimensional indexes to process OLAP queries that restrict multiple dimensions. They presented architecture for MHC databases based on the star schema called ‘CSB’ star. The focus was to facilitate the user to query the typical star schema and to formulate the given query for ‘CSB’ star schema using query processor. The limitation of their work was that they only tested a particular class of typical OLAP queries over the CSB star schema to check efficiency. Tsois et al. [13], proposed cost based optimization of aggregation star queries on hierarchically clustered data warehouses. Hierarchically clustered data warehouses were used to apply a cost based method for the optimal application of the pre-grouping transformation. Authors identified the most suitable algorithms for the operations related to pre-grouping and derived detailed cost formulas for them. It is apparent from the review that various authors have used hierarchical clustering technique in different ways with OLAP to improve the functionality and to get better analytical results. The major difference of the proposed work with the reviewed work of this section is that the use of hierarchical clustering is to generate hierarchal clusters to get an insight of the data before passing it further for OLAP operations. This mining technique has not been applied on the cube for archiving cube data or for the optimization of OLAP queries. Instead of query optimization, OLAP performance has been improved in terms of cube construction time through the use of hierarchically clustered data. In the following section, the work done on the automation process of OLAP schema generation is discussed. C. Automatic OLAP schema generation Hann et al. [14], proposed the generation of tool specific schemata for OLAP from conceptual graphical models. Their work described the design and implementation of the generation component in the context of their own Bablefish data warehouse environment. The principle issues of designing and implementing such an automatic schema generation component and the possible solutions have been discussed by the authors. Further topics are the use of graph grammars for specifying and parsing graphical multidimensional schema descriptions and the integration of the generation process into a metadata cantered modeling tool environment. Peralta et al. [15], highlighted the existing work in the area of automation and claimed that automation is focused towards data models, data structures specifically designed for Data warehouse (DW), and criteria for defining table partitions and indexes. The major research contribution of
the authors is a step forward towards the automation of DW relational design through a rule-based mechanism, which automatically generates the DW schema by applying existing DW design knowledge. The proposed rules embed design strategies which are triggered by conditions on requirements and source databases, and perform the schema generation through the application of predefined DW design oriented transformations. For the sake of accomplishing the ease in the automation work, Tryfona et al. [16], built a conceptual model (StarER) for data warehouse design on the basis of user modeling requirements. The StarER model combines the star structure, which is dominant in data warehouses, with the semantically rich constructs of the ER model. Comparison of the proposed model with other existing models has been performed, pointing out differences and similarities. Examples from a mortgage data warehouse environment, in which starER is tested, that revealed the ease of understanding of the model, as well as the efficiency in representing complex information at the semantic level. For the purpose of achieving the automatic generation, Song et al. [17] introduced an automatic tool for generating star schema entity-relationship diagram (ERD). A prototype named SAMSTAR was presented, which was used for the automatic generation of star schema from an ERD. The system takes an ERD drawn by ERwin Data Modeler as an input and generates star schemas. SAMSTAR displays the resulting star schemas on a computer screen graphically. With this automatic generation of star schema, this system helps designers reduce their efforts and time in building data warehouse schemas. It is evident from the literature on automatic generation of schema that none of the previous works used hierarchically clustering to generate OLAP schema. Previous work on automation has a number of limitations as well such as support for only one schema type, dependency of ER diagram modeling and having to design rule based mechanism before the automation process. The work in this paper is different as compared to existing automation works. Firstly, the results of hierarchical clustering are used to generate any of the three types of schemas. Furthermore, the work is not limited to designing the schema but it also populates the data from the clustered data source to the automatically generated schema tables. In addition to this, the schema builder also communicates with database server and deploys the generated schema in the server as a complete database. To the best of our knowledge none of these works used hierarchically clustered data to generate OLAP schema. Most of the work is using ER diagrams or conceptual graphical models to produce only one type of schema which is mostly star schema. Another major limitation in the work is that the tools and techniques used for automatic generation of schema only draws of identify the structure of schema and doesn’t populate the corresponding data in the generated schema. Furthermore, we are not only generating OLAP schema of three types namely; star, snowflake and galaxy but our automated schema builder tool provides automation in uploading the data from clustered file to relevant portions of the schema. This feature along with 3
other specifications distinguishes the work done in this paper from the others. Table 1 highlights a summary of the literature review. III. PROPOSED MODEL It is evident from the literature review that none of the research works in the past targeted towards the integration of OLAP with data mining along with the automation in the schema generation process. A number of authors [5, 6, 7, 8, 18 and 22], in the recent years, have emphasized on the concept of combination of OLAP and data mining. Although this previously reported work justified the advantages of such combination, the major limitation in
their works is the absence of automatic schema generation process. We suggest an independent automatic schema generation layer that fulfils both the requirements of schema generation and transformation of data. Based on the above discussion, there is a strong requirement of a significant model that takes the data mining results to automatically generate schema, transforms mined data in the schema, and overcomes the existing limitations in schema generation models. Figure 1 depicts the proposed model for automatic schema generation using data mining results.
TABLE I SUMMARY OF LITERATURE REVIEW
4
Fig 1. Proposed model for automatic schema generation
The elaboration of the layers of the proposed model is as follows: A. Data Mining: Pre-Processing Layer This layer is responsible for the data mining process. The three components in this layer are as follows: Dataset: This component represents the data set. A large number of data sets exist. This component is responsible for the selection of a particular data set on which data mining is to be performed. Hierarchical Clustering: Once the data set is selected, the data mining technique which is hierarchical clustering is applied in this component on the data. This component also handles clustering parameters which include linkage method (Single, Complete or Average), clustering directions (rows, columns, both) and similarity/distance measure (Euclidean, Manhattan, Simple matching for nominal or Pearson correlation coefficient). On the given set of clustering parameters this component produces the hierarchical clusters. Clustered Data: The hierarchical clusters generated by the previous component are stored and saved in the form of clustered data. This component of the layer also saves the hierarchy relationship among the data along with the actual data in each cluster. The hierarchically clustered data become the input of the next layer which is responsible for the automation process of schema generation.
B. Data Mining: Pre-Processing Layer The purpose of this layer is to automate the process of schema generation. To achieve this purpose the data mining layer feeds the mined data or clustered data to this layer for the generation of schema from clustered data set. The layer has distinct components and the working of each component is explained as follows: Schema Builder: It is the major component of schema generation layer. The sole function of this component is to build a particular type of schema for the clustered data set. As this component has to perform numerous schema generation activities, therefore it has a number of subcomponents to achieve the purpose of building the schema. The sub-components of the schema builder are as follows: Clustered Data Reader: This sub-component of the schema builder reads the data generated by the hierarchal clustering and save it temporarily for future operations. Clustered Data Viewer: It allows viewing the clustered data read by the reader in the grid view. All the cluster hierarchy and the number of records present in each can be viewed through it. Schema Generator: After the clustered data has been read and viewed the data goes to the component called schema generator. The sub-components of the schema generator are explained below.
5
Dimensions and Facts Identifier: This is the first subcomponent of the schema generator. In the generation process of schema the first important step is the identification of dimensions and facts from the clustered data. For this important purpose the data in the schema generator goes to the Dimension and facts identifier, which identifies the dimensions and facts present in the clustered data. It also identifies the cluster hierarchy and the numeric type of data which are the facts or key performance indicators of the data. Dimensions and Facts Separator: The identifier component just identifies the various dimension and facts present in the clustered data. But in real life the dimension and the facts are to be separated in order to build the schema. For this purpose the Dimension and facts separator splits the identified dimensions and facts to be used for different types of schema generation. Schema Type Selector: At the stage when dimensions and facts are identified and separated the Schema type selector component handles the designing of a specific type of schema. This selector allows the selection of a particular type of schema which can be a star, snowflake or galaxy. Warehouse Builder: After determining the schema type to be generated the dimensions and facts along with the specific schema type goes in to another major and core unit of schema builder which is called the warehouse builder. The warehouse builder as its name implies, builds a warehouse of a particular schema type and consists of the following main sub-components. The functionality of each of the component in the warehouse builder is described below: Dimensional hierarchy handler: It is the first component of the warehouse builder and it serves the purpose of handling the hierarchy in the dimensions. As the clustered data has its own hierarchy and the dimensional data identified and separated previously have to be in some hierarchical order within each dimension. The dimensional hierarchy is different for different type of schemas that is why this handler component handles the hierarchy present within each dimension. Dimension and fact table creator: Because the warehouse builder automatically creates a warehouse in the form of a database so the creation of the dimension and fact table is a must. For this reason the dimension and fact table creator takes dimensional hierarchy from the previous component and the facts separated by the separator component and create the tables according to the specific schema type. Within each table created for a dimension the hierarchy structure is determined and created using the hierarchy handler output, which is different for each type of schema. Table relationship manager: For each type of schema the referencing of dimension and fact table is different. For star schema, the dimensions are connected directly. In Snowflake schema there exists a normalized relationship
between the dimensions whereas for Galaxy both types of relationships are being made. To handle this complexity of relationship among dimension and fact tables created by the warehouse builder for a specific schema type, the table relationship manager plays its part and manages all kind of relationships among the tables accordingly. Data population unit: When all the tables are created along with the hierarchy within each dimension and the relationship is being created among the dimensions and fact tables, the data population unit comes into play. The role of this unit is to load the clustered data in the schema intelligently. Therefore, this unit picks the clustered data and inserts it in specific columns of the dimension and fact tables so that this data can be used later for the OLAP operations. Schema Viewer: This component takes the generated schema from the schema generator and gives the view of the automatically generated schema in the form of schema diagram. IV. IMPLEMENTATION AND EXPERIMENTAL DETAILS In this section, based on our implementation, we discuss in details the steps involved in the implementation of the proposed model. Some tools and technologies have been used for the implementation of each layer of the proposed model. Each step of the implementation phase is discussed individually in the following sub sections with the help of an experiment. For the experimental purpose, ForestCoverType [23] data set has been chosen. This data set has 581,012 numbers of instances and 54 attributes. The attribute breakdown shows that it has 12 measures or facts with 54 columns of data from which 10 are quantitative variables, 4 are binary wilderness areas and 40 binary soil type variables. The main purpose of the experiment is to demonstrate the ability of using the proposed model with a real life data set. A. Hierarchical clustering of data The proposed model starts with the layer of data mining and the technique used for data mining is the hierarchical clustering. The first step of the implementation is the hierarchical clustering of data. To serve the purpose of step 1, we used Hierarchal Clustering Explorer (HCE) tool [24] for generating the hierarchical clusters of data. This tool takes input data file and allows the hierarchical clustering of given data based on different clustering parameters. At this point, user can select the parameters of his/her choice to perform specific type of hierarchical clustering on the data. Upon the selection of clustering parameters, the data as a result, is hierarchically clustered and the hierarchy details are shown in the HCE tool. We fed the ForestCoverType data set to the Hierarchical Clustering Explorer (HCE) tool. Various parameters can be set at this stage. A visualization map of the
6
ForestCoverType data is shown in Figure 6 (Appendix) as an example. The tool takes this data as input and produces the hierarchical clusters of data by setting different clustering parameters. With the help of this tool user can see the generated hierarchy of the clusters along with the data present in each cluster. For the experiment we selected the row wise clustering option and the algorithm used for this type of clustering was the Euclidean algorithm. The reason for this choice is that Euclidean distance is the most commonly used type of distance measure in cluster analysis. It uses raw data instead of standardized data to compute the distances. Using the complete linkage method, the hierarchal clusters are produced, it can be seen from the Figure 2 that 3 distinct clusters are produced where each one of them is having its specific hierarchy. B. Automatic Schema generation In this step, the cluster results file which was exported using the HCE tool becomes the input of the automatic schema builder. We developed a prototype to automate the process of schema generation. The prototype takes the clustered data and generates the schema of any particular type such as star, snowflake or galaxy/constellation. The prototype has been developed using the C sharp (C#) programming language in Microsoft Visual Studio.net 2005. Once the hierarchical clustering has been done, the next step is to extract this hierarchical information in the form of cluster information tables which are fed into the developed prototype called Automatic Schema Generator. Figure 3 depicts the main interface of the Automatic Schema Generator having the clustered relationship data. Cluster names are the abbreviations which are formed using the first letters of each cover type, for example, cluster name for C1 is PCD, which means cover types of Ponderosa pine, Cottonwood, and Douglas-fir (PCD). All other names are abbreviated by using the first alphabetical letters. After reading the cluster relationship file, the button of “Create Schema” as shown in the following diagram displays the schema selection window. Figure 4 shows the schema selection window of automatic schema builder. Using this selector window, cluster name and type of schema can be selected to build database in the database server. User can select from star, snowflake and galaxy or constellation options of schema type using the radio button. The “Generate” button on the bottom of schema selector window performs the following major functions: 1) Generates automatic database in the database server 2) Creates dimension and fact tables for the schema type selected 3) Manage relationships among the tables 4) Upload data in the fact and dimension tables from the clustered file After performing the above mentioned functions, the control is passed to the schema visualization window which gives a glimpse of the schema created automatically as shown in Figure 5.
Fig 2: Hierarchical clusters generated by HCE tool
Fig 3: User interface of automatic schema builder
Fig 4: Schema Selector window
7
Fig 5: Schema visualization window
V. CONCLUSION AND FUTURE WORK In this paper, we reviewed the literature regarding the integration of OLAP with data mining and automatic generation of OLAP schema. Literature review revealed the fact that none of the previous works targeted at the automatic schema generation from the mined data set. Furthermore the works in the past pose a number of limitations. The major limitation of the previous work was the absence of a model that can produce the three basic types of OLAP schema (star, snowflake and galaxy). Based on these observations we presented the model for the integration of data mining and OLAP along with the automatic generation of OLAP schema. We have developed a prototype for the automatic schema generation. This developed prototype takes mined data and produces the schema of user’s choice. Finally we implemented the proposed model and evaluated the results with the help of experiment. It is evident from the result that the prototype system overcomes the manual schema design and implementation requirement in the data warehousing environment. We are working on the enhancement of the proposed model for automatic schema generation. One possible way of enhancement is the use of other data mining techniques along with OLAP for the schema generation. Further more, we are exploring how OLAP can be further extended and enhanced to meet the new challenges and to make it more effective, efficient and intelligent OLAP. REFERENCES [1]. S. Chaudhuri and U. Dayal, An overview of data warehousing and OLAP technology, ACM SIGMOD Record, Vol. 26 (1997), pp. 6574. [2]. A. Cuzzocrea, D. Sacca and P. Serafino, A hierarchy driven compression technique for advanced OLAP visualization of multidimensional data cubes, in Proc. of 8th Int’l Conf. on Data Warehousing and Knowledge Discovery (DaWak), (Springer Verlag 2006), pp. 106-119. [3]. S. Mansmann and M. Scholl, Exploring OLAP aggregates with hierarchical visualization techniques, in Proc. of ACM Symposium on Applied Computing (2007), pp. 1067-1073.
[4]. Fayyad U M, Piatesky-Shapino G., Smyth P. and Uthurusany R., “From datamining to knowledge discovery: An overview,”in Proc. of Advances in data mining and knowledge discovery, MIT Press, pp. 134. [5]. S. Goil and A. Choudhary, “High performance OLAP and data mining on parallel computers,” Data Mining and Knowledge Discovery, vol. 1, no. 4, pp. 391-417, Dec. 1997. [6]. S. Asghar, D. Alahakoon and A. Hsu, “Enhancing OLAP functionality using selforganizing neural networks,” Neural, Parallel and Scientific Computations, vol. 12, no. 1, pp. 1-20, March 2004. [7]. R. B. Messaoud, O. Boussaid and S. Rabaseda, “A new OLAP aggregation based on the AHC technique,” in Proc. of the 7th ACM Int’l Workshop on Data Warehousing and OLAP (DOLAP), ACM New York, 2004, pp. 65-72. [8]. J. Han, “Towards online analytical mining in large databases,” ACM SIGMOD Record, vol. 27, no. 1, pp. 97-107, March 1998. [9]. V. Markl, F. Ramasak and R. Bayer, “Improving OLAP performance by multidimensional hierarchical clustering,” in Proc. of the 1999 Int’l Symposium on Database Engineering and Applications (IDEAS ), 1999, p. 165. [10]. V. Markl and R. Bayer, “Processing relational OLAP queries with UB-trees and multidimensional hierarchical clustering,” in Proc. of the Int’l. Workshop on Design and Management of Data Warehouses (DMDW), 2000, pp. 1-10. [11]. N. Karayannidis, T. Sellis and Y. Kouvaras, “CUBE file: A file structure for hierarchically clustered OLAP cubes,” Advances in Database Technology, LNCS, Springer Verlag, Berlin-Heidelberg, pp. 621-638, 2004. [12]. D. Theodoratos and A. Tsois, “Heuristic optimization of OLAP queries in multidimensionally hierarchically clustered databases,” in Proc. of the 4th ACM Int’l Workshop on Data Warehousing and OLAP (DOLAP), ACM New York, 2001, pp. 48-55. [13]. K. Hann, C. Sapia and M. Balaschka, “Automatically generating OLAP schemata from conceptual graphical models,” in Proc. of the 3rd ACM Int’l Workshop on Data Warehousing and OLAP (DOLAP), ACM New York, 2000, pp. 9-16. [14]. V. Peralta, A. Marotta and R. Ruggia, “Towards the automation of data warehouse design,” Technical Report TR-03-09, InCo, Universidad de la República, Montevideo, Uruguay, June 2003. [15]. N. Tryfona, F. Busborg and J. G. B. Christiansen “StarER: A conceptual model for data warehouse design,” Proc. of the 2nd ACM Int’l. Workshop on Dataarehousing and OLAP (DOLAP), ACM New York, 1999, pp. 3-8. [16]. Y. Song, et. al., “SAMSTAR: An automatic tool for generating star schemas from an entity-relationship diagram,” in Proc. of the 27th Int’l. Conf. on Conceptual Modeling, LNCS 2008, pp. 522-523. [17]. S. R. Maddi and V. Khan, “Comparative analysis of on-line analytical processing tools,” University essay from IT-universitetet I Göteborg, Sweden 2007. [18]. H. Zhu, “Online analytical mining of association rules,” Master Thesis, Simon Fraser University, 1998, pp. 1-117 [19]. J. Fong, H. K. Wong and A. Fong, “Online analytical mining Webpages tick sequences,” J. of Data Warehousing, vol. 5, no. 4, pp. 5967, 2000 [20]. S. Dzeroski, D. Hristovski and B. Peterlin, “Using data mining and OLAP to discover patterns in a database of patients with Y chromosome deletions,” in Proc. AMIA Symp., 2000, pp. 215–219. [21].F. Dehne, T. Eavis and A. Rau-Chaplin, “Coarse grained parallel online analytical processing (OLAP) for data mining, in Proc. of the Int’l Conf. on Computational Science (ICCS), 2001, 589-598 [22]. J. Han, S. H. S. Chee and J. Y. Chiang, “Issues for on-line analytical mining of data warehouses,” in Proc. of the SIGMOND Workshop on Research Issues on Data Mining and Knowledge Discovery (DMKD), Seattle, 1998, pp. 2:1-2:5. [23]. J. A. Blackard, D. J. Dean and C. W. Anderson, Forest cover type, The UCI KDD Archive [http://kdd.ics.uci.edu]. Irvine, CA: University of California, Department of Information and Computer Science (1998). [24]. J. Seo, et. al., “Interactive color mosaic and dendrogram displays for signal/noise optimization in microarray data analysis,” in Proc. of the Intl. Conf. on Multimedia and Expo-Volume 3, 2003, pp. 461-464.
8
Appendix
Fig 6: Forest Cover Types of the U.S. (Source. USGS, National Atlas of US)
Summary of Forest Cover Type Data Type Multivariate Abstract The forest cover type for 30 x 30 meter cells obtained from US Forest Service (USFS) Region 2 Resource Information System (RIS) data Data Characteristics The actual forest cover type for a given observation (30 x 30 meter cell) was determined from US Forest Service (USFS) Region 2 Resource Information System (RIS) data. Independent variables were derived from data originally obtained from US Geological Survey (USGS) and USFS data. Data is in raw form (not scaled) and contains binary (0 or 1) columns of data for qualitative independent variables (wilderness areas and soil types). Summary Statistics Number of instances (observations) Number of Attributes Attribute breakdown Missing Attribute Values
581012 54 12 measures, but 54 columns of data (10 quantitative variables, 4 binary wilderness areas and 40 binary soil type variables) None
9