Abstract: The increasing size of spontaneous report data sets and the increasing capability for ... mining plays an important role in the analysis of spontaneous reports, there is general ... and tools for finding associations and patterns of associ-.
C Basic & Clinical Pharmacology & Toxicology 2006, 98, 324–330. Printed in Denmark . All rights reserved Copyright C ISSN 1742-7835
MiniReview
Data Mining in Spontaneous Reports Andrew Bate and I. R. Edwards The Uppsala Monitoring Centre, WHO Collaborating Centre for International Drug Monitoring, Uppsala, Sweden (Received May 12, 2005; Accepted September 19, 2005) Abstract: The increasing size of spontaneous report data sets and the increasing capability for screening such data due to increases in computational power has led to a recent increase in interest and use of data mining on such data. While data mining plays an important role in the analysis of spontaneous reports, there is general debate on how and when data mining should be best performed. While the cornerstone principles for data mining of spontaneous reports have been in place since the 1960s, several significant changes have occurred to make their use widespread. Superficially the Bayesian methods seem unnecessarily complex, particularly given the nature of the data, but in practice implementation in Bayesian framework gives clear benefits. There are difficulties evaluating the performance of the methods, but they work and save resources in managing large data sets. The use of neural networks allows more sophisticated pattern recognition to be performed.
Data mining in spontaneous adverse drug reaction (ADR) reports is becoming more and more commonplace. There remain attitudes of unbridled optimism about their use (Szarfman 2000) and potential, but also considerable scepticism about the field (Hennessy 2004; Shapiro 2004). This paper addresses the current key controversies in the use of data mining in spontaneous reporting. A very important consideration is that data mining is not a single method or even approach. For this reason some prefer the more generic terms ‘knowledge finding’ or ‘exploratory data analyses’. To criticise objectively data mining one must avoid falling into the illogical trap of assuming that there is (or should be) a standard data mining method, that any imperfections of the data mined are miraculously removed, and that misuses of the methods, or misinterpretations of the results invalidate the methods themselves. Moreover, the logic of the various methods used must be considered separately from the IT platforms that support their use. Principles Why use data mining? Spontaneous reporting of suspected adverse drug reactions (ADRs) is performed with the aim of finding novel drug safety signals: new information after medicinal products has been approved and launched in the market place. It is well accepted that the nature of the data collection process Author for correspondence: Andrew Bate, Research and Development, The Uppsala Monitoring Centre, WHO Collaborating Centre for International Drug Monitoring, Stora Torget 3, S-753 20 Uppsala, Sweden (fax π46 18656088, e-mail andrew.bate/whoumc.org).
prevents estimation of incidence rates of ADRs, but spontaneous reporting of suspected ADRs is acknowledged as the best source of data available for signal detection. The WHO defines a signal as: ‘Reported information on a possible causal relationship between an adverse event and a drug, the relationship being unknown or incompletely documented previously’ (Edwards & Biriell 1994). The WHO database now holds over 3.1 million case reports of suspected adverse drug reactions. The ever rapidly increasing size of data sets of spontaneous reports has therefore made manual inspection as a sole method for signal detection increasingly impractical for global data: automated and quantitative aids are a necessity to make signal detection successful. Additionally from experience, a principal argument has evolved that, if important signals are not to be missed, the first analysis of information should be free from prejudice and a priori thinking. Data mining has evolved largely as a result of efforts by computer scientists to address the needs of ‘data owners’ in extracting useful information from massive real world observational data sets (Smyth 2000). It involves the development, testing and implementation of routine algorithms and tools for finding associations and patterns of associations in large data sets, where manual inspection is impossible. Data mining techniques are versatile tools to generate knowledge from large datasets, data mining has been described as ‘‘asking a processing engine to show answers to questions we do not know how to ask’’ (Kamrani 2001). The value of data mining to pharmacovigilance is clear, where really unexpected, previously unidentified adverse drug reaction signals are unlikely to be discovered by performing specific queries of spontaneous ADR databases based on precise hypotheses. The complexity of spon-
MiniReview
325
DATA MINING
taneous ADR information is readily underestimated. Each case report has up to 200 fields of information listed, and while there is often considerable missing data, this is not always so. Through the use of data mining more can be made of the data available. For example the combinations of several variables (such as pairs of drugs, or ADRs) are also important to consider, many different time functions need to be considered, including the time between different drug use and onset date, duration of treatment(s), and if several diseases presented, the temporal relation of these. Data mining has been used in many diverse applications such as monitoring for environmental risks (Scaringella 1999), meteorology (Bilgin & Camurcu 2004), computer hacking attacks (Barbara et al. 2001), internet searches (Thornton & Carrington 2003) and operational crime fighting (Adderley 2004). As appreciation of the benefits of data mining increases so does its uses. What’s new about data mining? Data mining has been an integral part of the routine signal detection process in use at the WHO database since 1998 (Bate et al. 1998) and is being tested or used in other sets of spontaneous ADR data. However signal detection itself is not new, nor are the principles behind the use of quantitative techniques to highlight potential signals solely using spontaneously reported data (Moore et al. 2005), much key research was done in the 1970s (Finney 1971 & 1974; Mandel et al., 1976; Levine et al., 1977; Patwary 1969). Although many of the fundamental principles behind the methods commonly used today for signal detection and data mining are not new, increases in computational power have opened up possibilities for extensive application of data mining methods far greater than were envisaged in the 1970s. The most commonly used measures are the Proportional Reporting Ratio (PRR) (Evans et al. 2001), Reporting Odds Ratio (ROR) (van Puijenbroek et al. 2002), Information Component (IC) (Bate et al. 1998 & 2002a; Orre et al. 2000) and Empirical Bayesian Geometric Mean (EBGM) (DuMouchel 1999; Szarfman et al. 2002) and are collectively known as ‘measures of disproportionality’ (van Puijenbroek et al. 2002). The IC is implemented in a Bayesian Confidence Propagation Neural Network (BCPNN), a neural network. All the measures look for unexpected frequencies of reports in the data set in comparison to general reporting frequencies. The observed number of reports of a particular drug ADR combination is compared to an estimate of the expected number based on other reporting in the same data set. When a high number of cases are observed relative to the expected then such combinations are flagged for further investigation. The principles of the methods are best exemplified by the pioneering work of Napke who built and used routinely a ‘pigeonhole system’ at the Canadian National Centre (Napke 1977) where reports were logged physically in different pigeon holes depending on the specific drug and suspected ADRs listed. By regular inspection Napke looked for unexpected increases in reporting of particular drugs
and events, rather than just total reporting, as a key filter for signal detection. This pigeon hole system was thus based on the same principles as the computer-based systems used today, and visual inspection of physical reports has been replaced by statistical algorithms implemented using computational tools. However major changes have occurred in the use of data mining methods in pharmacovigilance: O Easy- to-use tools and work flow processes and visualisation are now available. O Quantitative methods have been integrated into routine systematic processes for signal detection. O Much more extensive testing has been done (although more is needed). O There is more extensive understanding of the strengths and weaknesses of the methods. O There is more widespread need and use for early signal detection as more and more data are accumulated and searchable. O In addition to the detection of the previously unsuspected and clinically interesting, data mining is now also used systematically to provide other useful output, such as the analysis of reporting trends of known problems, for example to provide insights into the impact that publications have on the clinical concerns that are reported. O The capability for looking at disproportional complex patterns in data that may indicate high risk sub-groups of patients, disease relationships, drug interactions, amongst others. O Regular screenings are made routinely of large data sets, rather than just one-off runs examining specific hypotheses see for example (Moore et al. 1997; Stricker & Tijssen 1992). O Dedicated software available for ongoing user-driven interactive data screening. O Capability for highlighting patterns that help facilitate understanding data collection methods and classification schemes of the data set, allow for improvements to be made (e.g. finding two adverse reactions terms that are used systematically different, but that are synonymous such as ‘therapeutic response decreased’ and ‘medicine ineffective’). O The methods are used to clean the data, for example by the detection of duplicate case reports, and clusters of reports received from the same reporter can also be detected (Nore´n et al. 2005). O Data mining methods are no longer solely used on spontaneous ADR data but have also been applied to patient records such as the two million record IMS Mediplus Diseaze Analyzer (Bate et al. 2004a). Methods Why use complex statistical measures on spontaneous ADR data? The implementation of quantitative methods on spontaneous ADR data are a pragmatic approach for effective
326
ANDREW BATE AND I. R. EDWARDS
and fast filtering of large amounts of data, to focus more detailed human evaluation on combinations that are more likely to represent signals. Spontaneous ADR data has well known weaknesses, so the quantitative outputs must only be understood as a relatively accurate predictor of signals, which demand critical appraisal and further clinical investigation, rather than evidence of statistical significance that cannot be challenged. Issues such as confounding and differential reporting will sometimes explain apparent associations, but in general the large amount of data reduces the impact of reporting fluctuations increasing the effectiveness of quantitative filtering (Edwards 1997). Both the EBGM and IC have more complex formulae than the PRR and ROR. In practice this is a consequence of their implementation in a Bayesian statistical framework. The Bayesian implementation is different for the EBGM and IC, but both lead to a dampening or shrinkage of the measure of disproportionality towards the null value of no association, this shrinkage is particularly strong when there in no or little observed data on a combination. This shrinkage reduces the number of false positive associations flagged by the measures (DuMouchel 1999), and provides a major benefit of these approaches, at least this has been proven to be so on the WHO database and in using the currently tuned version of the BCPNN (see below). Implementation of the IC within a neural network architecture (Bate et al. 1998) while not essential for single drug-single ADR detection, provides a seamless connection to more complex pattern recognition (Orre et al. 2005) and this is discussed below. Use Does it work? Validation of data mining techniques would be ideal. Unfortunately an ongoing definitive list of known ADRs, and which drugs can cause them (and the date at which such causality was confirmed) does not exist. This lack of a ‘‘gold standard’’ makes comparative evaluation of the performance of different methods difficult. Testing is further complicated by trying to distinguish between limitations of the data and its collection, from the algorithms themselves. For example failure to detect a particular adverse drug reaction early might be due to limitations with the algorithm, but might also be due to lack of appropriate data in the reporting system, or its delayed receipt. Studies evaluating the different methods include those that describe differences between the methods such as the Gould (2003) method those that examine the level of concordance of results achieved by different methods when implemented on specific data sets such as performed by van Puijenbroek et al. (2002), and those which examine the performance of one or more methods to some definition of true or false ADRs (Lindquist et al. 1999 & 2000; Hauben & Reich 2004). The latter methods use surrogates such as labelling changes, other signalling systems or description in specific literature sources, as reference in the absence of
MiniReview
a gold standard, each have their own limitations. Comparison of performance on artificial data sets have also been performed (Rolka et al. 2005). Because of the different variables that have been included in these comparisons, and the different ‘tuning’ possibilities of the methods (e.g. levels of statistical significance used), the various evaluations can only consider whether a method works on a specific data set at a certain level of performance. Even comparisons of methods on standard data sets are problematic because the methods may have a deliberately inbuilt dampening, for a variety of purposes that are specific to the users and data sets. The main problem for testing is of contemporary comparison. If one tests a method by only checking that contemporary known ADRs are successfully highlighted, then the applicability of the method to detect currently unknown ADRs is still questionable. Even if one can show that the method can find known problems, this does not imply that currently unknown problems will be detected by the method. The act of being known, may lead to certain properties of reporting, which might cause such combinations to be highlighted. Consider if a method is better at highlighting those adverse events which are true signals but already known, or those that are true signals but currently unknown. If a combination is highlighted, but the combination is already listed in a reference source, then the combination was highlighted by the quantitative method correctly but too late to be a signal. If, however, the combination is not listed in a reference source, this may either be a false positive or a true positive newly discovered! Studies of data mining methods on historical data comparing the results to a prospective review of the literature at the time of analysis allow false positives to be distinguished from newly discovered true positives. Such a study of the BCPNN was performed in 2000 (Lindquist et al. 2000), drug – ADR combinations from the early part of 1993 were examined and comparisons made to general reference sources. For the purposes of the study, signals were defined as combinations unknown in 1993, but listed in the literature in 2000. All 95 drug ADR combinations highlighted by the BCPNN in early 1993 were examined, and 13 negatively highlighted (upper 95% confidence limit less than zero) by BCPNN were also analysed. In this study the positive predictive value reached 44.2% since 42 of the 95 cases would have been found with the BCPNN. The negative predictive value was 84.6%, since only two of the 13 combinations not highlighted, were found to be signals. Clinical review of the two apparent false negative combinations concluded that the combinations were sufficiently well-established pre-marketing not to be considered signals in practice. The results strongly indicated that data mining using the WHO database is beneficial and that the IC is a good predictor of future reference in the literature, a proxy for currently unknown true side effects. Note that in the study no clinical review was performed, while in routine use all associations must also pass a filter of clinical review to be considered signals. Thus in practice the positive predic-
MiniReview
DATA MINING
tive value can be expected to be higher, as all associations are clinically reviewed and many of the false positives can be expected to be discarded before signalling in the Uppsala Monitoring Centre’s routine work. In general all the measures have similar properties in highlighting signals particularly when three or more cases have been observed (van Puijenbroek et al. 2002). Differences between data sets, choices and use of terminology, and implementation decisions generally have more impact on signal detection than these small differences due to choice of measure. The method (whether data mining or not) should detect a high proportion of true positives and true negatives, while having a low proportion of false positives and very low numbers of false negatives. False positives are more acceptable than false negatives (in general, although this may vary from application to application) as false positive drug adverse combinations will in the main be rejected by clinical review, whereas complete reliance on the test method for filtering combinations of interest for review would mean that false negative would not be considered for clinical review. As there is no ‘gold standard’ for signal detection, absolute demonstration of the exact level of performance of the methods is difficult. There is truth in the view that the real demonstration of usefulness of these methods will be seen over time if we are increasingly effectively, or not, in highlighting prospectively new ADRs. Examples of such signals include the selective serotonin reuptake inhibitors (SSRIs) and neonatal malignant convulsions (Sanz et al. 2005) and topiramate-associated glaucoma. The antiepileptic topiramate was highlighted for clinical review with glaucoma by the BCPNN and was signalled by the Uppsala Monitoring Centre in April 2001. In July 2001 the first of several case reports on the association was published in the literature (Banta et al. 2001), and in October 2001 a Dear Healthcare Professional letter was sent out (Hulihan 2001). The development of the IC over time has been as follows:
327
We must particularly investigate how many true signals are missed by these methods. The volume of information analysed, and the need for speed in signal detection and communication, make the use of data mining approaches essential, at least on large data sets, even allowing for some doubt regarding their precise level of effectiveness. The studies and prospective signals found show that data mining works on WHO data, it is not necessarily as useful on other data sets, particularly small data sets, where case by case review is likely to remain a better method for signal detection. It should be noted that signal detection is likely to be more important for the detection of some types of adverse reactions than others, particularly the less serious adverse reactions where the number of reports is important. Receipt of a single case report of suspected drug-induced coughing would be very unlikely to prompt further investigation by a healthcare professional, even if the case report contained strong evidence, but a case series of several case reports might justify a signal. Does it save resources? If and to what extent data mining saves resources in signal detection will vary from organisation to organisation. Data mining has been used in the overall signal detection strategy of the Uppsala Monitoring Centre since 1998, and has been highly beneficial for analysing the WHO database. Its successful application has relied on its careful integration within an overall systematic strategy (Lindquist et al. 1999), where triage of the output plays a crucial role (Stahl et al. 2004). Trends and sudden increases in measures of disproportionality are very important in signal detection, and approaches to detect such changes are essential (Stahl et al. 2004). However a small pharmaceutical company data set, where detailed knowledge of the entire data set can be managed by individuals is very unlikely to benefit from data mining such a data set, as all patterns in the data will be transparent to the individuals. To the authors’ knowledge no published work has attempted to quantify the amount of time saved by the routine use of data mining in spontaneous reports. This can be explained by the difficulty in determining objectively the nature of success in signal detection. One can however anticipate that more work will attempt to address this issue in the future as organisations try to establish the usefulness of data mining in their routine signal detection practices. How should data mining be used and not abused?
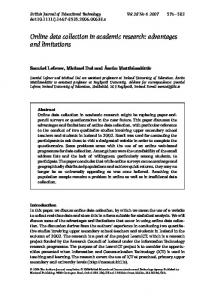
Fig. 1. The change in IC for reporting of topiramate and glaucoma over time, where time is the three monthly periods in which reports were entered into the WHO database. The upper and lower 95% confidence intervals are plotted.
Pharmacoepidemiology plays an important role in drug safety as a means of hypothesis testing, (and occasional hypothesis generation). However formal drug safety studies are often misleadingly portrayed as providing definitive answers to questions. There are considerations of how well studies were conducted, the generalisabilty of conclusions, and the subjective choices made in the design and analysis of the study. All studies have some measure of uncertainty in their conclusions, and will therefore sometimes, by chance, provide misleading results. Different studies addressing the same
328
MiniReview
ANDREW BATE AND I. R. EDWARDS
research questions can often give different results on the same data set! An example is the controversy of the risk of venous thromboembolism with oral contraceptives where the same research group published different results on the same topic using the same data set as discussed in Skegg (2002). The values of such studies are clear however, and we make the point that all types of study and analyses of postmarketing data are important, and together they contribute to an effective ongoing risk management plan adapted throughout the life-cycle of a drug product. No one, or a few studies, can provide definitive answers and allow adequate drug safety surveillance alone, and to suggest that data mining findings based on spontaneous ADR data should not be published is unacceptable (Hennessy 2004). This would greatly harm the pharmacovigilance community’s ability to build on the clinical suspicions of others and to confirm true drug safety signals as soon as possible. Within a pharmacovigilance framework, data mining of spontaneous ADR data is a tool to facilitate early signal detection, but as with the use of other pharmacovigilance and pharmacoepidemiology methods and tools, its findings should not be over-interpreted, and a discussion of how the findings might be used should always be made explicit, and clinical review of the plausibility of findings should always be provided. Spontaneous ADR data (and the application of data mining to it) is far stronger at generating hypotheses than rejecting them. Chance can provide a plausible alternative explanation for an apparent drug-ADR association. This demands a critical approach, and cautious further investigation. Some reasons why a negative quantitative finding may obscure a true signal include: downward confounding, unrepresentative over-reporting of the term of interest with other drugs, or unrepresentatively high reporting of the drug of interest for other ADR terms, and inappropriate blaming of other causes for the adverse reaction which seems to occur particularly for this combination. Data collection biases might also explain the lack of quantitative association. For a further discussion of the difficulties of interpreting negative findings see Spigset et al. (2003) who argued that other possible explanations of the negative IC were sufficiently unlikely to make it unlikely that SSRIs cause pancreatitis, an ongoing case control study does not at this time contradict this theory (Sundström et al. 2004). An investigation of antipsychotics and heart muscle disorder demonstrates the role of data mining. The benefit of the atypical antipsychotics over traditional antipsychotics had been reported as a reduced incidence and severity of side-effects rather than improved efficacy (Geddes et al. 2000). Concern had been raised about the combination of clozapine and myocarditis (Killian et al. 1999) without discussing the possibility of alternative therapies also causing heart muscle disorder, or even suggesting this should be considered. Data mining was used to examine this further. A quantitative association was discovered between the antipsychotics and myocarditis leading to the suspicion that other antipsychotics might also be related to heart muscle
disorder. After further quantitative analysis (Bate et al. 2002b), including clinical evaluation, the signal was published (Coulter 2001). While data mining on spontaneous ADR data was unable to prove or disprove that heart muscle disorder was a unique problem for clozapine, it was able to raise the question for investigation that had not been adequately considered before and make clear the case for further evaluation, thus significantly reducing the chance of inappropriate decisions and actions being made. Why complex methods such as neural networks? In addition to finding unexpected relationships between three variables, there is also a clear interest in finding patterns involving many more variables. One example is clustering of the symptoms that constitute a syndrome. In an ADR database the data are often sparse and rarely if ever will all constituent symptoms of a syndrome be listed on any single case report. The individual ADR terms that make up a syndrome do not necessarily show strong associations with the drug causing the syndrome. But may occur sometimes with the drug and have strong associations to other more commonly drug-related symptoms in the syndrome. Searching for co-reporting of all symptoms is therefore not useful, and a more sophisticated approach for unsupervised pattern recognition is needed to find such relationships. Such an approach is the use of a recurrent Bayesian Confidence Propagation Neural Network (BCPNN) (Orre et al. 2005). This method has been tested extensively and compared to other methods (Orre et al. 2005), the BCPNN performed favourably both in the quality of results, but also was much faster and scalable for large data sets. Pattern recognition on the suspected haloperidol case reports in the WHO database showed that clusters of ADR terms could be highlighted including clusters of ADR terms representing symptoms of the neuroleptic malignant syndrome (NMS), Parkinsonism and acute dystonia, despite no case reports in the data set having all the symptoms of any of the three clusters listed. Other patterns of interest have also been found (Bate et al. 2004b). As complex pattern recognition becomes a more frequently used routine tool, the benefits of data mining in spontaneous reports will become even clearer. Acknowledgements We thank Marie Lindquist, Niklas Nore´n, and Roland Orre for their critical roles in the development of data mining at Uppsala Monitoring Centre as a routine tool for drug safety.
References Adderley, R.: The use of data mining techniques in operational crime fighting. Intelligence and Security Informatics, Proceedings 2004, 3073, 418–425. Banta, J. T., K. Hoffman, D. L. Budenz, E. Ceballos & D. S. Greenfield: Presumed topiramate-induced bilateral acute angleclosure glaucoma. Amer. J. Ophthalmol. 2001, 132, 112–114. Barbara, D., J. Couto, S. Jajodia & N. N. Wu: ADAM: A testbed
MiniReview
DATA MINING
for exploring the use of data mining in intrusion detection. Sigmod Record 2001, 30, 15–24. Bate, A., I. R. Edwards, J. Edwards, E. Swahn, G. N. Noren & M. Lindquist: Knowledge finding in IMS Disease Analyser Mediplus UK database – Effective data mining in longitudinal patient safety data. Drug Safety 2004a, 27, 917–918. Bate, A., M. Lindquist, I. R. Edwards, S. Olsson, R. Orre, A. Lansner & R. M. De Freitas: A Bayesian neural network method for adverse drug reaction signal generation. Eur. J. Clin. Pharmacol. 1998, 54, 315–321. Bate, A., M. Lindquist, I. R. Edwards & R. Orre: A data mining approach for signal detection and analysis. Drug Safety 2002a, 25, 393–397. Bate, A., M. Lindquist, R. Orre, I. R. Edwards & R. H. Meyboom: Data-mining analyses of pharmacovigilance signals in relation to relevant comparison drugs. Eur. J. Clin. Pharmacol. 2002b, 58, 483–490. Bate, A., N. Nore´n, R. Orre, M. Lindquist & I. R. Edwards: Pattern detection for celecoxib and rofecoxib in the WHO database. Pharmacoepidemiol. Drug Saf. 2004b, 13, S323 (abstract). Bilgin, T. T. & A. Y. Camurcu: A data mining application on air temperature database. Advances in Information Systems, Proceedings 2004, 3261, 68–76. Coulter, D. M., A. Bate, R. H. Meyboom, M. Lindquist & I. R. Edwards: Antipsychotic drugs and heart muscle disorder in international pharmacovigilance: data mining study. Brit. Med. J. 2001, 322, 1207–1209. DuMouchel, W.: Bayesian data mining in large frequency tables, with an application to the FDA spontaneous reporting system. Amer. Stat. 1999, 53, 177–190. Edwards, I. R.: Adverse drug reactions: finding the needle in the haystack. Brit. Med. J. 1997, 315, 500. Edwards, I. R. & C. Biriell: Harmonisation in pharmacovigilance. Drug Saf. 1994, 10, 93–102. Evans, S. J., P. C. Waller & S. Davis: Use of proportional reporting ratios (PRRs) for signal generation from spontaneous adverse drug reaction reports. Pharmacoepidemiol. Drug Saf. 2001, 10, 483–486. Finney, D. J.: Statistical aspects of monitoring for dangers in drug therapy. Meth. Inf. Med. 1971, 10, 1–8. Finney, D. J.: Systematic signalling of adverse reactions to drugs. Meth. Inf. Med. 1974, 13, 1–10. Geddes, J., N. Freemantle, P. Harrison & P. Bebbington: Atypical antipsychotics in the treatment of schizophrenia: systematic overview and meta-regression analysis. Brit. Med. J. 2000, 321, 1371– 1376. Gould, A. L.: Practical pharmacovigilance analysis strategies. Pharmacoepidemiol. Drug Saf. 2003, 12, 559–574. Hauben, M. & L. Reich: Safety related drug-labelling changes: Findings from two data mining algorithms. Drug Saf. 2004, 27, 735–744. Hennessy, S.: Disproportionality analyses of spontaneous reports. Pharmacoepidemiol. Drug Saf. 2004, 13, 503–504. Hulihan, J. (2001) Important drug warning [letter], in, http:// www.fda.gov/medwatch/SAFETY/2001/topamax_deardoc.pdf. Accessed 2nd September 2005. Kamrani, A., W. Rong & R. Gonzalez: A genetic algorithm methodology for data mining and intelligent knowledge acquisition. Computers Industrial Engineering 2001, 40, 361–377. Killian, J. G., K. Kerr, C. Lawrence & D. S. Celermajer: Myocarditis and cardiomyopathy associated with clozapine. Lancet 1999, 354, 1841–1845. Levine, A., S. P. Mandel & A. Santamaria: Pattern signalling in health information monitoring systems. Meth. Inf. Med. 1977, 16, 138–144. Lindquist, M., I. R. Edwards, A. Bate, H. Fucik, A. M. Nunes & M. Ståhl: From Association to Alert – a revised approach to International Signal Analysis. Pharmacoepidemiol. Drug Saf. 1999, 8, S15–S25.
329
Lindquist, M., M. Stahl, A. Bate, I. R. Edwards & R. H. Meyboom: A retrospective evaluation of a data mining approach to aid finding new adverse drug reaction signals in the WHO international database. Drug Safety 2000, 23, 533–542. Mandel, S. P., A. Levine & G. E. Beleno: Signalling increases in reporting in international monitoring of adverse reactions to therapeutic drugs. Meth. Inf. Med. 1976, 15, 1–10. Moore, N., C. Kreft-Jais, F. Haramburu, C. Noblet, M. Andrejak, M. Ollagnier & B. Begaud: Reports of hypoglycaemia associated with the use of ACE inhibitors and other drugs: a case/non-case study in the French pharmacovigilance system database. Brit. J. Clin. Pharmacol. 1997, 44, 513–518. Moore, N., F. Thiessard & B. Begaud: The history of disproportionality measures (reporting odds ratio, proportional reporting rates) in spontaneous reporting of adverse drug reactions. Pharmacoepidemiol. Drug Saf. 2005, 14, 285–286. Napke, E.: Present ADR monitoring methods. In: Drug monitoring. Eds. F. H. Gross & W. H. W. Inman. Academic Press, London, 1977, pp. 1–10.. Nore´n, G. N., R. Orre & A. Bate: A hit-miss model for duplicate detection in the WHO drug safety database. In: Proceedings of the Eleventh ACM SIGKDD International Conference on Knowledge Discovery and Data Mining, Chicago, IL, 2005. Orre, R., A. Bate, G. N. Noren, E. Swahn, S. Arnborg & I. R. Edwards: A Bayesian recurrent neural network approach for finding dependencies in large incomplete data sets. Int. J. Neur. Systems 2005, 15, 207–222. Orre, R., A. Lansner, A. Bate & M. Lindquist: Bayesian neural networks with confidence estimations applied to data mining. Computational Statistics and Data Analysis 2000, 34, 473–493. Patwary, K. M.: Report on statistical aspects of the pilot research project for International drug monitoring. Report prepared for the World Health Organisation, Geneva 1969. Rolka, H., D. Bracy, C. Russell, D. Fram & R. Ball: Using simulation to assess the sensitivity and specificity of a signal detection tool for multidimensional public health surveillance data. Stat. Med. 2005, 24, 551–562. Sanz, E. J., C. De-las-Cuevas, A. Kiuru, A. Bate & I. R. Edwards: Paroxetine in pregnant women: SSRI and Neonatal withdrawal syndrome. Lancet 2005, 365, 482–487. Scaringella, A.: A data mining application for monitoring environmental risks. Machine Learning and Data Mining in Pattern Recognition 1999, 1715, 209–215. Shapiro, S.: Clinical judgment, common sense and adverse reaction reporting. Pharmacoepidemiol. Drug Saf. 2004, 13, 511–513. Skegg, D. C.: Oral contraceptives, venous thromboembolism, and the courts. Brit. Med. J. 2002, 325, 504–505. Smyth, P.: Data mining: data analysis on a grand scale? Stat. Meth. Med. Res. 2000, 9, 309–327. Spigset, O., S. Hagg & A. Bate: Hepatic injury and pancreatitis during treatment with serotonin reuptake inhibitors: data from the World Health Organization (WHO) database of adverse drug reactions. Int. Clin. Psychopharmacol. 2003, 18, 157–161. Stahl, M., M. Lindquist, I. R. Edwards & E. G. Brown: Introducing triage logic as a new strategy for the detection of signals in the WHO Drug Monitoring Database. Pharmacoepidemiol. Drug Saf. 2004, 13, 355–363. Stricker, B. H. & J. G. Tijssen: Serum sickness-like reactions to cefaclor. J. Clin. Epidemiol. 1992, 45, 1177–1184. Sundström, A., G. Sjölin-Forsberg & B.-E. Wiholm: Acute pancreatitis and serotonin specific reuptake inhibitors – A signal to evaluate further. Pharmacoepidemiol. Drug Saf. 2004, 13, S80 (abstract). Szarfman, A.: The application of Bayesian data mining and graphic visualisation tools to screeen FDA’s spontaneous reporting system database. In: Proceedings of the Section on Bayesian Statistical Science. American Statistical Association, 2000, pp. 67–71. Szarfman, A., S. G. Machado & R. T. O’Neill: Use of screening algorithms and computer systems to efficiently signal higher-
330
ANDREW BATE AND I. R. EDWARDS
than-expected combinations of drugs and events in the US FDA’s spontaneous reports database. Drug Saf. 2002, 25, 381–392. Thornton, K. E. B. & M. Carrington: The use of data mining techniques to classify styles and types of web-based information: Generation of style sheets using data mining. Adv. Web Intelligence 2003, 2663, 218–229.
MiniReview
van Puijenbroek, E. P., A. Bate, H. G. Leufkens, M. Lindquist, R. Orre & A. C. Egberts: A comparison of measures of disproportionality for signal detection in spontaneous reporting systems for adverse drug reactions. Pharmacoepidemiol. Drug Saf. 2002, 11, 3–10.