Data mining â Kohonen maps â Insulation monitoring â. Tap changer monitoring ..... developed commercial software using data mining for circuit breaker (CB) ...
15-107
21, rue d'Artois, F-75008 Paris http://www.cigre.org
Session 2002 © CIGRÉ
DATA MINING TECHNIQUES TO ASSESS THE CONDITION OF HIGH VOLTAGE ELECTRICAL PLANT A.J. McGRAIL National Grid Company
E. GULSKI Delft University of Tech.
(United Kingdom) D. ALLAN Powerlink Queensland
E.R.S. GROOT Nuon InfraCore
(The Netherlands) D. BIRTWHISTLE Queensland Univ. of Tech.
T.R. BLACKBURN* Univ. of New South Wales
(Australia) On behalf of WG 15.11 of Study Committee 15 ABSTRACT Increasing demands to fully exploit the capabilities of existing transmission equipment and systems require the best use from data assets in corporate databases and also require the development of new and comprehensive diagnostics for high voltage equipment. Data Mining allows extraction of new information or knowledge and development of new methods for visualising and analysing the data held. Consequently, data mining should be seen as part of a well-considered information and asset management strategy. This paper outlines some work which has been done to achieve such optimal use of diagnostic data on modern electrical plant. Two variations of data mining approaches are discussed using examples from different diagnostic measurements and tests. The use of Kohonen mapping applied to existing and new data is illustrated using examples of dissolved gas analysis, tap-changer monitoring and insulator testing. In addition, two other examples are given illustrating the potential for data mining to produce useful information from comprehensive modern diagnostic monitoring of high voltage cables and of circuit breakers. A new task force within SC15 has been established to embark on a coordinated and focussed approach to develop guidelines for data mining in practice. KEYWORDS Data mining – Kohonen maps – Insulation monitoring – Tap changer monitoring – Cable diagnostics – Circuit breaker monitoring - Dissolved gas analysis _____________________________________________ *School of Electrical Engineering. University of New South Wales, SYDNEY, NSW 2052, AUSTRALIA
1. INTRODUCTION Condition monitoring of high voltage electrical equipment provides valuable information on the insulation status of the equipment and its condition and potential life. The data obtained may comprise indicators of plant condition, either measured on-line using suitable well-established diagnostics or obtained off-line by measurement of component deterioration using appropriate physical, chemical or electrical tests. In addition to special indicators of plant condition, there is considerable data that may have been collected as part of equipment maintenance management. This data will include information about the frequency and nature of maintenance, changes to equipment, operational history and frequency of failure modes. The increasing use of computerised data storage and access techniques is providing ever larger databases that contain, or can store, an enormous amount of useful information on the condition of electrical plant. However the full potential of this data cannot always be realised using traditional techniques of data handling and analysis. There are often underlying trends or features of the data that are not evident from the usual analysis techniques. Such detail and trends can be important for the assessment of the equipment operation and there are increasing demands from operators and asset managers to fully exploit the capabilities of this data in order to optimize the utilization of high voltage electrical plant. The method of extracting full value from such extensive databases, using new analysis techniques, is commonly called Data Mining. The term ‘Data Mining’ is actually a key part in a broader process termed ‘Knowledge Discovery in
Databases’ (KDD) [1]. This process also involves the earlier stages of data selection and data transformation and the subsequent stages of validation and interpretation. In the electricity supply industry, data mining has already demonstrated much potential in electricity market operations and in the condition monitoring of electrical plant. Two aspects of data mining worth noting at the outset are: (i)
Data mining aims to provide an alternative to the traditional scientific method, where data analysis is largely directed by hypothesis and theory. The aim of data mining is to find intelligible patterns which are not predicted by established theory.
(ii) Formatting the output data in a visual form that human intelligence can interpret is important. For this reason, data mining encompasses a range of techniques suited to different applications and with differing levels of sophistication. A new CIGRE SC15 Task Force, ‘Data Mining of HV Plant Operation and Condition Monitoring Data’ was established in 2001 to address the activity areas of Study Committee 15, ‘Materials for Electrotechnology’. This Task Force is now attached to the SC15 Working Group 15.11, ‘Service Aged Materials.’ Some key tasks identified for this Task Force are as follows: (i)
Identify common data mining tools and practices for operational electrical equipment.
(ii) Review existing policies and experiences in data mining applications for condition monitoring, including validity and relevance of results. (iii) Comparison of these results with those obtainable from traditional statistical analysis and data analysis/interpretation tools. (iv) Investigate inherent limitations in data mining activities and constraints due to poor data quality, availability and reliability. (v) Review skills required of people involved in the data mining process. (vi) Describe and review those generic techniques which yield successful results for different plant types, manufacture and applications. This paper addresses the first three of these tasks using several illustrative examples from a variety of international research groups. The examples include both research developments and monitoring techniques which are already in operation in electrical utilities. The examples discussed also provide some detail of the different approaches to data mining.
2. DATA MINING TECHNIQUES IN USE In its basic essence, data mining is the application of relatively novel data-driven approaches to find patterns in data obtained from electrical equipment. The point of data mining is to find patterns which are not predicted by established theory. The data mining techniques are then used to relate these unusual patterns to the operational condition of the equipment. Data mining provides an alternative to the traditional scientific method, where data analysis is highly developed and directed by hypothesis and theory. 2.1 Cluster Analysis One approach to data mining is based on cluster analysis of data, the aim being to obtain an intuitive understanding of the problem data space. Such an approach is especially useful where the data records are unlabelled [2]. In an industrial situation, it can often be the case that records of plant measurements have no associated labels regarding the nature of the problem. A number of algorithms exist which can determine or graphically depict clusters, but one which is most often used is Kohonen's Self Organizing Feature Map (SOFM, also known as a Kohonen Net) - a form of unsupervised neural network [3]. The Kohonen Net is far from a new technique but the application of it to electrical equipment problems is still in its infancy. The Kohonen Net can be used in several ways, but for the purposes of importance here it is used mainly for data visualization. The resulting images can identify distinct clusters as on a map. Using expert knowledge of the equipment, these clusters are able to be identified with particular conditions of the equipment operation. This expert knowledge and opinion are then able to interpret the meaning of each of these clusters and their potential impact in the operational life of the equipment item. The Kohonen Net is a reasonably simple and robust method which is able to visualize multi-dimensional problems. The clustering of data might in reality involve a number of components (map dimensions). The Kohonen Net maps such a data space as best it can onto a two dimensional pattern by folding and stretching the mapping so as to minimize the inevitable mismatches between the display and the reality. The same technique is also capable of other target dimensionalities. For example, three dimensional "virtual reality" data displays are possible. The Kohonen Net optimizes its data-to-image projection by an iterative process, based not on a master algorithm but rather on a self-organizing heuristic technique. Here, each point in the map (represented by a neuron) learns incrementally on the basis of presented training data and the influences of its neighbours (other neurons). The Kohonen Net method has proved to be fairly robust in regard to arbitrary data, benefiting from, but not depending upon, some data pre-processing. This is a
useful quality when one does not know in advance what pre-processing is most appropriate. Also, unlike some clustering methods, it does not require the expected number of clusters to be defined in advance. In Section 3 below, Cluster Analysis techniques are outlined. Three examples are given of the utilization of Kohonen mapping techniques in use. These are: (a) Chemical ageing indicators for the condition monitoring of polymeric (EPDM) line insulators based on tests on surface samples: (b) Self Organizing Maps (SOM) used to enable an expert system for monitoring of transformer OLTC condition by analysis of acoustic signatures: (c) SOMs for data mining of dissolved gas data from transformers. 2.2 Other Data-Mining Techniques In addition to the mapping and cluster analysis techniques outlined above, other data mining procedures can be used on extensive databases available from both new and old monitoring techniques [4,5]. These can include neural network applications to databases [6] and other pattern recognition techniques such as partial discharge pulse sequence analysis [7]. Examples are given in Section 4 in this regard of the use of data mining techniques applied to the monitoring of distribution circuit breaker operational performance [9] and of distribution cable condition and operation [10]. In the latter case, use can be made of partial discharge data of cables. Partial discharges, because of their wide variation with equipment type, and with electrical configuration and material type, provide a very suitable vehicle for detailed data mining applications. In addition to the example given relating to cables, partial discharges are able to be used as the basis for neural network type data mining applications.
2
CLUSTER ANALYSIS : SELF ORGANIZING (KOHONEN) MAPS – EXAMPLES
have slightly higher ester/ketone ratios due to more extensive UV damage. Inland insulators from location R with prevailing sunny weather and intense UV radiation have the highest values of the ester/ketone ratio. Coastal insulators from locations B and I form an overlapping group with low values of the oxidation index and of the ester/ketone ratio.
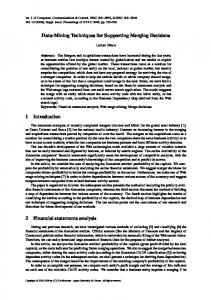
Fig. 1. Scatter plot relating the oxidation index to the ester/ketone ratio for manufacturer A insulators.
[Locations: B : Beenleigh, 15 km from sea, 6 insulators; G : Goodna, 40 km from sea, 1 insulator; I : Ingham, 5 km from sea, 1 insulator; M : Miami, 100 metres from sea, 3 insulators; R : Roma, 425 km from sea, 2 insulators.]
To detect clusters in more extensive data, the group average method of cluster analysis was used [8]. This method seeks natural groups in given data on the basis of similarities between individual samples. An average distance between two samples in a multi-dimensional input space is used as a measure of their similarity. The greater the distance between two samples, the smaller is the similarity. For example, the two dimensional data display in Fig. 2 shows that samples from coastal insulators from Goodna (location G) are more similar to each other than are samples from inland insulators such as those from Roma (location R).
3.1 Cluster analysis of chemical indicators for monitoring of outdoor insulators Pattern recognition techniques have been applied [8] to databases of chemical indicators derived from tests on small samples of EPDM material taken from the sheds of composite insulators using the technique described in [9]. The database was designed to link the numerical chemical indicators of insulation condition and type, age and location of insulators. Fig. 1 shows a two-dimensional scatter plot relating two of the important chemical indicators - the oxidation index and the ester/ketone ratio – for insulator samples from one manufacturer. Several distinct groups in the data can be identified. The sea-side insulators from location M and the coastal insulators from a foggy area (location G) have high values of the oxidation index due to dry-band arcing activity, though the coastal insulators
Fig. 2. Results from cluster analysis of condition indicators of 11 kV EPDM composite insulators from manufacturer A.
The group average method of data clustering displays similarities between individual samples in the form of a tree structure as shown in Fig. 2. In this case analysis was performed on insulators only from manufacturer A. In Fig. 2 each letter represents one sample. Thirteen insulators were analysed and several samples were taken from each insulator. The location annotation is the same as in Fig. 1. It can be seen that four distinct groups in the data were recognised. The first group consisted of insulators located in close proximity to the sea. The second group comprised samples from the insulator exposed to frequent fog at a coastal location close to a river. The third group consisted of insulators from coastal regions without frequent fog and further away from the sea. Inland insulators made up the fourth group. It was demonstrated [8] that cluster analysis of the chemical indicators of naturally aged EPDM insulators was able to distinguish between insulators from different locations, different manufacturers and with varying degrees of degradation. It was thus concluded that data mining using cluster analysis provided a useful automated computer-based tool whose application will be particularly valuable in managing data bases of condition indicators from large populations of ageing composite polymer insulators in electricity networks. 3.2 OLTC Condition monitoring using Kohonen Maps Vibration monitoring and analysis of transformer onload tap-changers (OLTCs) has been shown [10] to generate very large amounts of data: up to about 40 operation signatures may be received each day from online monitoring of a single transformer. It has been observed that each tap change operation generated a signal that contained information about the condition of the tap changer contacts and the drive mechanisms. Signals for every tap position were found to be different and there was considerable variability amongst normalcondition signals for the same tap position. Data mining methods have been applied to detect abnormal conditions and to estimate the nature of the abnormalities [10].
can adapt itself (self-organise) to intricate relationships between input data. The map is created in an unsupervised way. The U-matrix, which shows the distances between neighbouring units, is widely used to visualise the cluster structure of the map. High values in the U-matrix mean there are large distances between neighbouring map units, and thus indicate cluster borders. Clusters are typically uniform areas of low values. By plotting the trajectory of current data on a labelled map, the condition can be followed over time. The proper application of trajectory monitoring requires the map to be trained with both normal and faulty signatures.
Figure 3. A vibration signal of a selector-type transformer OLTC and the corresponding envelope. (C)
(B)
A typical vibration signature and its processed envelope are shown in Fig. 3. It has been shown [10] that features from the timealigned, normalised envelope can be used as input to a self-organising map (SOM) which provides the basis for detection and classification of OLTC faults. The SOM consists of a number of map units on a 1 or 2 dimensional grid [3]. It is a tool for mapping complex data in multi-dimensional space into one or two dimensional clusters while preserving the inherent topological relations among the input data. The SOM
(D)
(A)
Fig. 4. OLTC condition feature map. A: area of normal operation. B: area of weak springs. C: area of worn fixed and moving contacts. D: area of worn moving contacts. Axes refer to number of SOM map units.
From field monitoring experience, it was found [10] that there was a significant degree of inherent variability among the signatures of normal operational condition. Normalised auto-correlation functions of the envelopes of vibration signals of normal equipment condition were therefore used as feature patterns to train a SOM. A SOM-based OLTC condition feature map is shown in Fig. 4. The map indicates that different conditions of equipment produce well-defined clusters. Each hexagon in the map display represents a distance between two adjacent map units. The bright (lighter) colour shading indicates the cluster boundaries. The darker regions correspond to lower values of the distance between the map units, indicating data clusters of different equipment conditions. The moderate change in shading within the same cluster indicates the variability of the signatures within this cluster. The boundaries of the cluster areas, and the cluster identities corresponding to the conditions of equipment were marked and labelled using known signatures for different fault conditions.
b) An overheating cluster (at top-centre), dominated by the gases CH4, C2H4 and C2H6. The bottom-right corner corresponded to transformers with few problems. An unclear area just below the arcing cluster appeared associated with partial discharge problems and was noticeably higher only in hydrogen. This Map was consistently obtained for the given data set. Broadly similar results were obtained from other data sets on other units. The mapping also succeeded in revealing samples which were unexpectedly (at least to us) associated with possible transformer problems.
C2H6 H2 CO CH4 CO2
C2H4 C2H2
Condition diagnosis was performed by projecting newly acquired signatures onto the labelled map. The corresponding location of the signature on the map gives an indication of actual condition of the equipment. 3.3 Dissolved Gas Analysis and SOMs The National Grid Company in the UK has developed data mining techniques for the analysis of dissolved gas data from its 600 or so operational power transformers. While dissolved gas analysis as a diagnostic has been available for many years, it is only recently that data mining techniques have been applied to analyse the results in order to extract further information from the DGA database [11]. The aim of this technique is to analyse the data and to determine trends which are not obvious to the normal techniques of DGA analysis. Thus, data mining was applied with emphasis given to the use of Kohonen mapping methods. The preference was to use Kohonen's own research-grade tool, SOM_PAK, which is available for research purposes and, very usefully, as a source code (in both 'C' and Matlab). The availability of the source code allows direct control of the data mining process and permits problem-specific modifications and extensions (which soon became necessary). The main thrust of the task was to display a map including each of the monitored gases (H2, CO, C02, CH4, C2H4, C2H6 and C2H2). Such a map is shown in Fig. 5. The figure shows planes for each gas monitored and a combination of these in the form of the overall UNAMATRIX shown which indicates the combined effect. The most obvious features seen in the combined map are two intersecting part-circular shapes at the top of the map. These were found to represent clusters for two classic kinds of transformer problems: a) An arcing cluster (at the top-left corner), dominated by the gases H2 and C2H2.
Umatrix
Fig. 5 Kohonen Map of dissolved gas data from a transformer showing individual gases and there combined effect. All plotted samples falling within the problem-related clusters were indeed those known to be problems. However some samples labelled as problems did not occur in the problem-related clusters. Experts were invited to reassess the labels of the apparently stray samples but instead they reaffirmed them, typically because although some key gases were low in level, one or two particular gases were above normal. For example, C2H2 can only arise under high-temperature conditions, hence it is a strong indicator of problems regardless of other gases. Also, it was known that gases can be lost during sampling. The distance function used for plotting and training was then modified to allow experimentation with weighting of the influence of each variable and also to mimic the "pessimistic" attitude of experts - where the presence of a gas (especially acetylene) is regarded as more important than it’s absence. This reflects the fact that DGA gases can be lost to atmosphere but not gained. Given a way of plotting individual samples, the next step was to plot a temporal sequence of samples for a given transformer. The result for one transformer is shown in Fig.6. The time trajectory starts (the earliest sample) at the bottom part of the Map and moves progressively towards the focus of what is the Overheating cluster. In order to refine the mapping, a further exercise was conducted based on NGC's complete database. First, the variables were profiled to reveal their data distributions (mainly log-normal) initially by eye and
then by using the Excel spreadsheet add-on tool Crystal Ball. The variables were then normalized based on their profiles and variances.
in the Kohonen Network’s “distance” function – where the presence of a gas is of different significance to the absence of it (reflecting for example that gases can be lost in storage but not gained). The new map so obtained (Fig. 7) was more complex and more accurate: similarly labelled samples were clustered more tightly together and the map covered a greater part of the data space.
Fig.6 : Trajectory of a transformer DGA over time. Following some experimentation a number of data preprocessing issues were discovered and resolved, finally leading to a useful map. First, the map identified an "outlier" cluster - a set of samples with gas values wildly different to most other samples. This turned out to be an inappropriate sample set deliberately inserted by experts as a "blind test" to validate our method. Next, a study of gas distributions revealed that certain of the early data samples (obtained many years ago) had improbably frequent occurrences of certain specific round-number values such as 50ppm and 100ppm, suggesting a human factor had intervened in the recorded data. In consequence, samples from this period of time were removed from our study. Finally, an optimum data transformation (preprocessing) function was determined, to emphasize the more interesting aspects of the data, i.e. those states where a transformer was beginning to deteriorate. As previously stated, the ability to distinguish between subtle varieties of ‘O.K.’ transformers was of no interest. Likewise, once a particular degree of fault (of any type) was established, display of further deterioration was of little practical benefit. After many experiments, the best map was obtained by using an Scurve data transformation on each gas, the value then saturating on upper and lower values. For each gas, the S-curve was designed to focus on values associated with samples forming between 75% and 90% of the sample (not the transformer) population. In making this decision it was recognized that suspect transformers would have been sampled more frequently than others. In addition, acetylene was given greater weighting than the other gases and some asymmetry was incorporated
Fig. 7: Final mapping display shown and used as a Web-Based User Interface. A time trajectory is also shown. [In the full colour version, this map provides specific colours based on the IEC DGA interpretations of gas ratios and corresponding transformer condition.] Notably, the new map was able to identify three different kinds of partial discharge (instead of just one). Expert advice confirmed the existence and validity of these different PD conditions. Interestingly, the map also identified some states that the experts found difficult to classify. A production version of the mapping tool has been developed. This allowed one to superimpose coloured regions onto the map, revealing the interpretations of various standard assessment techniques such as Rogers' Ratio (RR), IEC 599 and Duval's Triangle. The colourings/shadings in Fig. 7 are based on IEC 599. As well as being a way to establish the meanings of the various parts of the map, this was also a way to compare and contrast the standard DGA ratio techniques revealing how their interpretations can differ over certain regions of the map (and hence the data space). A demonstration of the tool is available on the web, at using the username; 'DGANetDemo' and the password 'DGA'.
CABLE AND CIRCUIT BREAKER MONITORING USING DATA MINING
4.1
Data mining support for condition-based maintenance of circuit breakers The significant pressures on utilities to reduce costs, taking into account an acceptable level of risk, has brought about the introduction of condition-based maintenance (CBM). For supporting its CBM strategy Nuon InfraCore, a business unit of a Dutch utility, has developed commercial software using data mining for circuit breaker (CB) condition monitoring.
dried in a furnace. If tg δ is above 23% the circuit breaker may not be used again and the coqolite is looked upon as irreparably damaged. The ultimate goal of the research of this aging process was to find the different parameters of the failure mechanism of coqolite using data mining techniques. 40 35 30
TangensDelta (%)
4
Coqolite is irreparable
25 20 15
Coqolite has to be dried 10 5
Coqolite is good 0 0
5
10
15
20
25
30
Moisture level (ppm)
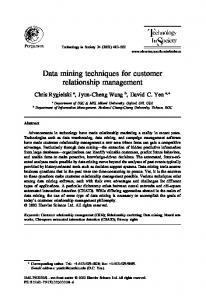
Fig. 9: Correlation between moisture level in the oil and the tg.δ of coqolite.
The general features of this method are shown in Fig. 8. This process provides three outcomes (A, B and C) of the data mining approach. Outcome A refers to new knowledge about aging mechanisms of CB components and outcome B to recommended maintenance activities on CB components, resulting from the database analysis. Due to the large amount of measurement data stored in the software data system, operating norms and criteria are continuously updated and fed back to workers in the field as determined by result C. These three outcomes will be explained in detail by practical examples in the following paragraphs.
4.1.1
Aging mechanisms (Outcome A)
In the Netherlands the average age of circuit breakers is about 30 years. Because of the expected re-investment wave there is a growing need for determination of aging models of circuit breaker components. A large amount of data, stored in CB database systems is being used for an investigation of the aging process of an insulation material called “Coqolite”. This material is applied in a large number of 30 year-old CBs and is considered a critical component because of the cost of replacement and the consequences for environmental safety in case of a CB failure (due to the potential for problems caused by the oil insulation). For measuring the condition of the coqolite a loss current (tg δ) measurement is being applied and if tg δ is above 10% the coqolite must be
40 35 30
TangensDelta (%)
Fig. 8: Schematic structure of data mining process for condition-based maintenance of circuit breakers.
Because the coqolite is enclosed by insulation oil a correlation was expected between the moisture level of the oil and the tg δ of the coqolite. As shown in Fig. 9 there is an increased influence of oil on the aging mechanism when the moisture level is above 11 ppm and a destructive influence above 24 ppm. However this Figure also shows a large deviation in the section between 24 and 30 ppm which means that other parameters besides moisture level also influence the aging process of the coqolite. Further research made clear that the substation location also influenced the aging of coqolite because of the different groundwater levels in the Netherlands. Fig. 10 shows the correlation between the moisture level of the oil and the aging mechanism of coqolite in a region with a high groundwater level.
Coqolite is irreparable
25 20 15
Coqolite has to be dried 10 5
Coqolite is good 0 0
5
10
15
20
25
30
35
Moisture level (ppm)
Fig. 10: Correlation between moisture level in oil and tg.δ of coqolite in high moisture level areas. Normally only the breakdown voltage of insulation of this type of circuit breaker is measured frequently.
Because of the influence of moisture level on the aging of the coqolite, a proven correlation between the moisture level and breakdown voltage might reduce moisture level measurements. However as shown in Fig. 11 there is no correlation between the breakdown voltage and moisture level of the oil which means that both breakdown voltage and the moisture level should be measured for circuit breakers with coqolite parts.
4
A: defect in damper
3,5
Norm curve 3
B: increased obstruction by bearing Velocity (m/s)
2,5
C: free space in mechanical drive 2
D:defect in hydraulic system 1,5
1
0,5
40
0
35
-0,5 1
11
21
31
41
51
61
71
81
91 101 111 121 131 141 151 161 171 181 191 201 211 221 231 241 251 261 271 281
Time (msec) 25
Fig. 12:
20
Deviations of the contact velocity curves
15
5
0 0
10
20
30
40
50
60
70
Breakdown voltage (kV/2,5mm)
Fig. 11: Correlation of moisture and breakdown Detailed data analysis as described has thus increased the knowledge about the aging process of critical components of circuit breakers. Extra attention for the moisture level of the oil of circuit breakers in areas with high groundwater level should extend the technical lifetime of critical components like the coqolite. The reconditioning of the oil above a moisture level of 11 ppm in these areas can be looked upon as a precautionary measure for slowing down the aging process and the postponement of re-investment costs. 4.1.2 Maintenance activities (Outcome B) To find a balance between cost reduction and environmental and personnel safety, condition-based maintenance is used world-wide to give support to these asset management responsibilities. Preventive maintenance activities are controlled by the results of condition measurements. In addition to manmade inspections, computerized contact velocity measurement has been shown to be one of the best tools to implement condition-based maintenance for circuit breakers. Velocity and acceleration curves give information about the condition of the driving system by showing any deviation, obstruction or incorrect damping during the switching operations. In practice most information is retrieved by comparison of the measured curve with standard curves stored in the monitor’s database. As shown in Fig. 12, many mechanical faults can be recognized and the proper maintenance action can be initiated on a detailed level. A total overhaul of the circuit breaker is now not necessary anymore and is being replaced by conditionbased maintenance activities at component level.
4.1.3 Norms and criteria (Outcome C) Due to the growing importance of measurements as an initiator for maintenance activities, the need for reliable norms and criteria increases significantly. Database analysis support thus requires the continuous improvement of norms and criteria. In the case of new measurements and diagnostics, this is often the only way to create reliable norms, due to the relative lack of detailed knowledge of manufacturers with regard to the new and evolving techniques. Switch of velocity
Chance density
10
1,5
2,0
2,5
3,0
3,5
4,0
4,5
Velocity (m/s)
Fig. 13: Probability density curve of switching velocity.
3,5
3,0
2,5
Velocity (m/s)
Moisture level (ppm)
30
2,0
1,5
1,0
0,5
0,0 0,0
5,0
10,0
15,0
20,0
25,0
C ontactpressure (kg)
Fig. 14: Correlation between contact pressure and velocity
Fig. 13 shows the determination of a norm for the switch velocity of a specific type of circuit breaker. From different speed curves, key quantities have been derived, including switching time, velocity and acceleration. Each quantity is put into probability curves for calculating a norm based on the average value and standard deviation as shown in the figure. In this case a norm for the velocity of 3.0 ± 0.3 m/s is derived. An example of updating norms for contact pressure of circuit breakers is shown in Fig. 14. Due to uncertainty about the influence of a high contact pressure on the switching velocity of the circuit breaker, a database analysis was applied to find the correlation between the two quantities. The correlation figure shows that there is no negative influence of a high contact pressure on the velocity of the circuit breaker contacts and so there was no reason to make the maximum norm for contact pressure dependent on the velocity. Probably the energy of the drive mechanism has no problem with the obstruction of the contact pressure at all. 4.2
DATA MINING ASPECTS OF POWER CABLE DIAGNOSTIC DATABASES
4.2.1 General For assessment of the insulation condition of power cables, some linkage between the following information has to be obtained, then combined and used to generate knowledge adequate for decision making [13,14]:
• Different Types • Different Ages • Different History
Fig. 15: Important service life elements of a cable section. [For practical reasons, a cable section may be constructed from multiple parts of a cable. These parts are connected to each other with cable joints. At both ends of the cable, a termination is mounted to connect the cable to HV installations]. 1. 2. 3.
Input of Measurement Data
Definition of Cable Structure
Component domain; consisting of specific insulation characteristics of the cable structure; e.g. cable insulation, accessories, Diagnostic domain; consisting of the type of diagnostics applied; e.g. general condition assessment, assessment of weak spots, Measuring data domain; defining specific diagnostic quantities used during condition assessment.
Measurement Data
Analysis of Measurement and Cable Data
Cable Data
Fig. 16: Schematic structure of a diagnostics database to support condition assessment. (1)Cable structure: whether one or more cable parts, two or more terminations, number of splices: etc.; (2) Network and service characteristics: different ages, and different service and maintenance histories. Inspections and measurements should be performed to obtain data about these parameters. To monitor the condition of components, suitable parameters should be selected. The selected parameters must give an indication of the component’s health. Besides the results from the diagnostics, a reference figure is necessary to interpret the results. From this reference level knowledge rules can be extracted with respect to the availability and remaining lifetime of components. Finally, specific levels (Norms) should be defined that trigger inspection, maintenance or possible replacement actions. [4, 12]
4.2.2
Cable Section: • Cable parts • Joints • Terminations
Because of the number of components, their diversity and the amount of data, information systems are needed for storage, correlation and comparison of measurement data on specific components. As an example for a distribution power cable, the following service life elements are important for data mining, (see Fig. 15):
Database Structure
The insulation condition assessment based on suitable diagnostic parameters requires knowledge rules and norm value levels. To develop these knowledge rules and to assess the norm levels, a suitable database system is necessary for storage and analysis of the data. Such a database system minimally exists of the following components, (see Fig. 16): 1. 2. 3. 4.
Module to input or define the cable data (structure, component types); Module to input measurements; Module for the analysis of the data; Database to store the data;
Separating the functionality of the system in these four blocks has certain advantages. Extra modules can be added to store data in or to use data from the database. Also this design anticipates a future multi-user environment. For example, multiple users could use multiple copies of the modules, while all the data resides only on one large central database.
old situation 1
A
B
new situation 2
1
A
C
D
2
Cable section Measurement data on whole cable section Measurement data on components of cable section
Time
t
Valid measurement data
Fig. 17: A cable-section in its original (left) and modified (right) form [with diagnostics data, and resulting valid diagnostics data. Section is modified at time t when joints C and D replace B. After time t not all data on the section is still valid.(data from cable-parts not shown for simplicity)] 4.2.3 Maintaining Integrity of the Data In a discussion of which format is preferable to store the measurement data, the following question has to be answered. What if measurement data in one file or from one measurement session contains information about a specific cable section and its components? The situation may then occur that one of the sub-components will be replaced. In this case the measurement data is no longer valid for the new combination of the component and sub-components. If this data stays in the database, it is no longer valid. However, if this data is deleted, useful information about the non-replaced components will be
PD level at U 0 for joint type A
2.5 %
Fig. 18: Example of diagnostics parameter statistical evaluation for a specific accessory type. lost. In relation to the physical world, the cable-section changes when components are replaced or when the cable-section is enlarged with another cable section or divided into two parts. The new cable-section is no longer the same cable-section as the old one. This situation also applies to the database schema. If a cablesection changes, a new cable-section will be entered into the database. The old cable-section will be marked as an ‘Historic’ item of data and will remain in the database. In this way cable-parts, joints or terminations can belong to multiple cable-sections in the database. Only one of the cable-sections in this group can be ‘Current’ because, physically, a cable-component can
belong only to one operating cable-section at the time. The older cable sections must be designated ‘Historic’. By using a reference to its former cable-section (or sections), the history of the cable-sections can be maintained. In addition, the measurement data that applies to the whole cable-section stays only linked to the cable-section that becomes ‘historic’. The new ‘current’ cable-section consists partly of components that are also part of the historic cable-section. Because quantity values are linked to the components themselves, the historic data from the components themselves is still accessible from the new ‘current’ cable section. An example of this is shown in Fig. 17. At time t, two joints C and D and a small cable-part replace joint B. The measurement data on termination 1 and 2, and joint A is the only data that remains valid in the new situation. The date when a cable-section became “historic” is also stored inside the database to facilitate the ability to view measurement data that only applies to the “historic” cable configuration. 4.2.4 Knowledge generation In order to achieve a good end-result it is necessary to have a number of sources of information, concerning the cable and accessories tested, available to support the operator in making a correct interpretation of the database of measured diagnostic signals. For instance, this data may include the results of dissection of tested cable components. For this purpose, samples of cable insulation and accessories are removed from service and analyzed in the laboratory. Based on the results obtained, a correlation between degradation evidence and on-site partial discharge results is made. This method is an expensive one and can be replaced by advanced data processing. Here the statistical analysis of historic data can be used to establish results to support data mining. In particular, by using statistical analysis, overall behaviour is taken into account, (see, for example, Fig. 18). The frequency distribution can be used to determine the norm levels. To set a norm level, a decision has to be made about which risk is acceptable. This is a consideration which is mainly a comparison between cost and reliability. From this decision follows a determination of which parts of the population of components should be regarded as being at risk. As a result, systems of norms are needed to manage the data from measurements and inspections. These systems can also be used to perform statistical analysis for determination of the norm levels over time. The system of norms also can be used to trigger certain alerts for inspection, maintenance or replacement actions, see Fig. 19. Moreover the norms of two or more diagnostic parameters can be combined as shown in Fig. 20. The ‘safe’ area is above and to the left of the boundary lines.
All diagnostic parameters are in the safe area of the chart until time t5. If the diagnostic trend crosses the 0……………PD critical
Intensity low Intensity medium Intensity high
0……………PDIV critical
Fig. 19: Based on statistical responses for identification of components typical condition threshold levels (norms) have to be generated.
calculates the service life from the two fields ‘MeasurementDateTime’ and ‘MountingDate’. The data obtained by this query can be processed and plotted in additional software, for example to enable cluster analysis, or to visualise the data as a histogram in which a possible moving distribution can be found (see Fig. 22, for example). Database support is an important element in obtaining relevant information for condition assessment of power cables. Based on this information, decisions can be made about levels for updating or maintenance. When these levels are applied on the database as Norm Levels, components are easily selected for condition based maintenance actions.
PDIV (kV)
t2 t1
t4 t3
t5
t6 PD level at PDIV (pC) Æ
Fig. 20: “Safe”and “at Risk”regions of the cable [“Safe” is the upper left side and “at risk” is the lower right side]
When the database is implemented in an SQL-compliant database, in order to create specific analysis cases, one can use SQL to extract data, and then process and visualise it with an additional software program. For example, this can be done with MS Access queries.
In Fig. 21, an example for a solution in the form of an MS Access query is shown. At top of the screen, the relations are shown from which a large table is constructed. At the bottom, we see the first two columns as output, and the last two columns just for filtering the large table to contain only values of ‘PD level at U0’ for joints of ‘Joint Test Type A’ only. The second column
2100 1800 1500 1200 Service Life 900 (Days) 600 300
40 30 N 20 10 0 8600
7200
0
0 1200
An example of this is to create a chart of the service life versus partial discharge level for a certain component. From this result, the service life can be calculated out of the mounting date and measurement date, and the large overall table can be filtered on a specific joint type and a quantity, resulting in a two column data-set on which we can perform statistical analysis. In the first column the numeric quantity values and in the second column the service life is shown in years.
Frequency vs PD level vs Service Life
6000
Query
4800
Structured
3600
4.2.5 Analysis through language (SQL)
Fig. 21: MS Access query to result in a dataset for the diagnostic parameter “ PD level versus service life”.
2400
‘green’ line, the values are outside their norm levels. The operation area to the right and below these lines is the most serious, having two processes both of which are outside their norm levels.
PD level (pC)
Fig. 22: 3-D plot of Frequency distributions versus service life. The frequency distributions are created from the measurement values in a certain time interval. This way aging effects could become visible. In this example, after 1500 days discharging defects become visible.
5 CONCLUSIONS Due to the pressure on utilities to reduce costs, taking into account an acceptable level of risk, an important change is brought about by the introduction of the condition-based maintenance strategy. For supporting the CBM process data mining has become an important component of power system operation. Based on a large amount of condition data, data mining techniques can give both new information about ageing mechanisms of components and act as a support for the initiation of maintenance activities and can also be used to update standard norms. Such database support is an important element in obtaining relevant information for condition assessment of insulating systems. Based on such information, decisions can be made about levels for maintenance. When these levels are applied on the database as Norm Levels, components are able to be easily selected for CBM action. Datamining is able to be applied either by use of existing sensors or monitors and their associated databases or by utilizing modern novel sensors and the powerful computing facilities that can now be brought to bear on condition monitoring (both on-line and offline) applications. In the use of existing techniques, data mining methods such as Kohonen mapping of data will allow extraction of information which was not previously available from the traditional methods of data analysis. The use of such mapping by NGC is an example of an increased level of equipment condition that can be achieved by such a technique using existing data in new ways. In the application of new monitoring techniques, the continuing development of continuous on-line monitoring systems and associated real-time analysis, coupled with the enormous capacity of modern data systems enables the development of powerful new techniques of monitoring and assessment. An example of this is the use of partial discharge monitoring techniques. The flexibility of modern PD techniques allows them to be displayed and analysed in a variety of ways which can be used to provide either simple alarm signals or can be used with much more sophisticated analysis to give sensitive indicators of equipment insulation deterioration. The discussion of a number of such applications in this paper illustrates the potential value of data mining techniques. With the increasing economic pressures on power system operation in the future, such developments in data mining will be an essential component of modern power system operation.
REFERENCES [1] U.M.Fayyard, G.Piatetsky-Shapiro, P.Smyth and R.Uthurusamy (editors), “Advances in knowledge discovery and datamining” , MIT Press, 1996. [2]Tarassenko, L. “A Guide to Neural Computing Applications ” John Wiley 1998 [3] T.Kohonen, “Self-organising Maps”, 2nd Edition, Springer, 1997 [4] A.G. Starr “A structured approach to the selection of condition based maintenance”, Factory 2000 – The Technology Exploitation Process, Fifth International Conf., 2-4 April 1997, paper 435. [5] J.J. Smit “Decision making experience with maintenance diagnosis of high voltage equipment”, 37th Cigre session, Paris 1998, paper 15-105. [6] B T Phung,, Blackburn, T R and James, R “Recognition of Partial Discharge Using Fuzzy Logic” Proc Intern Symp on Elect Insulating Materials pp 657660, Toyohashi, Sept. 1998 [7] H G Krantz, “ Ädvanced PD noise suppression and its relevance for computer Aided PD defect Identification” Paper S2, Proc. 2001 ISEIM conference, Himeji, Japan, Nov. 20-22, 2001. [8] A.Krivda, G.Cash, D.Birtwhistle and G.George, “Diagnostics of EPDM Polymer Insulators”, Conf. on Electrical Insulation and Dielectric Phenomena, Austin Texas USA, October 1999, [9] D.Birtwhistle, et al.., “Application of advanced chemical analysis techniques to the assessment of composite insulator condition”, CIGRE Paris, August 2000. Paper No. 15-307 [10] P.Kang. and D.Birtwhistle, “Condition monitoring of on-load tap-changers. Parts 1&2:”, IEE Proc.-Gen. Transm. Distrib., Vol. 148,(4), pp301-306, and pp307311, July 2001. [11] D.G.Esp & A.J.McGrail, “Advances in Data Mining for Dissolved Gas Analysis” ISEI 2000 Conference, Anaheim , California, 2000. [12] D. Kopejtkova, H.P. Ott, H. Rössler, F.Salamanca, J.J. Smit, A. Strnad, P. Wester, “Strategy for conditionbased maintenance and updating of substations”, 36th Cigré, Paris 1996, paper 23-105. [13] E. Gulski, F.J. Wester, W. Boone, N. van Schaik, E.F. Steennis, E.R.S. Groot, J. Pellis, B.J. Grotenhuis, ‘’Knowledge Rules Support for CBM of Power Cable Circuits’’ Cigre Paris 2002, SC 15 paper [14] F.J. Wester, E. Gulski, J.J. Smit, ‘’CBM of MV power cable systems on the base of advanced PD diagnosis’’, CIRED 2001. paper No. 1.29