In this chapter, we describe the application of data mining techniques on data obtained from e-learning courses based upon virtual learning communities. First,.
Data mining to support tutoring in virtual learning communities: experiences and challenges Elena Gaudioso1 , Luis Talavera2 1 Dept.
Inteligencia Artificial, UNED Llenguatges i Sistemes Inform`atics, Universitat Polit`ecnica de Catalunya 2 Dept.
Abstract Computers and Internet are becoming widely used in educational contexts. Particularly, the wide availability of Learning Management Systems (LMS) allows to easily set up virtual communities providing channels and workspaces to facilitate communication and information sharing. Most of these systems are able to track students interaction within the workspaces and store it in a database that can be later analyzed to assess student behavior. In this chapter we review some experiences using data mining to analyze data obtained from e-learning courses based upon virtual communities. We illustrate several issues that arise in this task providing real world examples and applications and discuss the challenges that must be addressed in order to integrate data mining technologies in LMS.
1 Introduction In recent years there has been a raising interest in using collaborative and communication tools in education. A new approach to e-learning has emerged with the concept of virtual learning communities. These are groups of people with common interests or goals that use the Internet resources to improve their communication and coordination. In education, virtual communities share a common goal of learning and are usually monitored by a tutor. A simple but commonly used pedagogical model consists of making a tutor and a set of students members of a web-based workgroup with course materials available online (and possibly also offline) and one or several shared services. These groups are supported by the so-
called Learning Management Systems (LMS). These platforms offer a great variety of channels and workspaces to facilitate information sharing and communication between participants in a course and therefore enable collaborative learning. Virtual learning communities offer a weaker form of collaborative learning than more structured interfaces that support collaboration, such as, for example, computer mediated conversations through the use of dialog tags or sentence openers. However, there are two aspects that support our interest in this approach. First, although providing less elaborated support, educational virtual environments enable teachers to set up structured collaborative activities. Secondly, these sort of settings are rapidly becoming popular because of the availability of powerful open source LMS allowing a relatively easy set up of the collaborative space and the flexibility they provide. A number of key issues arise in the use of virtual learning communities. One concern is that students could need some guidance in order to take full advantage of the communication services provided by the community. In addition, tutors should be supported in order to manage the community and to monitor student interactions. While the first issue has received some attention by researchers, the latter has been largely neglected in the literature. However, supporting tutors is very important to make learning communities effective. Although some platforms offer reporting tools, when there are a great number of students and a great diversity of interactions, it becomes hard for a tutor to extract useful information. Data mining techniques can build analytic models and uncover meaningful patterns from data. Usually, building data mining models require considerable expertise and cannot be done by regular course tutors. Therefore, achieving a seamless integration of these techniques into virtual learning platforms is a very desirable goal. In this chapter, we describe the application of data mining techniques on data obtained from e-learning courses based upon virtual learning communities. First, we provide a general description of the data mining process. Next we present a real application example and then describe how each of the stages of the process is carried out. We illustrate several issues raised by these experiences, and we close with the lessons learned and the challenges we have identified in order to develop embedded data mining applications for virtual learning communities.
2 Data Mining Classical data analysis is hypothesis driven. The user starts from a question and explores the data to confirm the intuition. In a first level, we can have a set of predefined reports that reflect trends that are known to be of interest. In a more elaborated setting, we can use analysis technologies that enable interactive exploration of the data, such as OLAP tools. While question driven analytics can be a useful tool to understand the data when a moderated number of factors are involved, it can be very difficult for the user to find more complex patterns that relate different aspects of the data. An alternative to traditional data analysis is to employ an inductive approach to
automatically discover significative patterns and tendencies. Data mining can provide these functionalities by building analytic models that summarize interesting patterns present in the data. From now on, we will refer to data mining not only as the analytical techniques used to build models, but as the whole process that must be carried out in order to use these technologies in a real application. Therefore, data mining can be viewed as a cycle that consists of the following steps: • Identify a problem where analyzing data can provide value. • Collect the data. • Preprocess the data to obtain a clean, mineable table. • Build a model that summarizes patterns of interest in a particular representation form. • Interpret/Evaluate the model. • Deploy the results incorporating the model into another system for further action. It is widely recognized that successful data mining projects require a careful formulation of the problem and to understand how data mining is going to provide added value to the users. Although this step is commonly left implicit or neglected in some research literature, it is important in order to implement a closed-loop approach. We think that it is desirable to express the problem in terms of the particular domain, rather that in terms of the technological approach. Following [1] putting data mining into context contributes to determine three important aspects: the role of the final system, the scope and distribution of the inputs to which the system will be applied and the performance criterion and standards by which the system will be judged. The application of data mining to educational problems and, particularly, to virtual learning communities is not much different for any regular industrial application. For example, a definition such as “a system to support the tutor in detecting and improving weak student performance” does not only suggest the use of a predictive modeling technique, but also determines the user of the system, the intended value that it is going to provide into the organization, how the results can lead to actions, and suggest that evaluation cannot be performed simply in terms of overall accuracy, since different situations may imply different prediction costs. The primary infrastructure of a virtual learning community is based upon web and internet technologies. Web-based environments can provide huge volumes of data about the user interactions through web server logs. There has been a significant amount of research on web usage mining from web logs [2] that unanimously recognizes the limits of this source of information. In the specific case of e-commerce it has been remarked a need to log higher-level events and not only page requests to better reflect user interaction in every particular context [3]. Although we focus on virtual learning performed through modern databasebacked LMS, we are not committing to any particular technological setting, but only remarking the general functionalities of a LMS that are of our interest. One important aspect that emanates from this setting is that we assume that in educational environments we are dealing with registered users. This has an important impact in the quality of the data gathered, since we remove the uncertainty asso-
ciated to user identification when processing web logs. Second, we assume the existence of a tracking module that stores user interactions at a higher level than simple page accesses. Particularly, we assume that it is possible to gather detailed access and usage information on any of the services offered (forums, chats, file storage, etc.) by the LMS. This structure is not uncommon in modern LMS and provides a much more reliable source of data than web logs. This reduces the amount of work required in the data preparation stage, especially regarding cleaning and error or inconsistency detection. However, data transformations that summarize the information at the required level (e.g. student) are still needed. As it happens with any other data mining application which data source is an operational database, the data model is not suited for analytical applications. Having a well-defined task and a mineable table including the potentially relevant data, we have to choose a data mining technique to build a model. A model can be viewed as a set of patterns that summarize the data under some representational assumptions. A number of basic representation formalisms or its combinations can be used such as probabilities, rules, trees, etc. Similarly, a number of algorithms from machine learning or statistics are available. We are not going to get into the specific details of the different families of algorithms. Rather, we emphasize the distinction between two approaches related to the intended function of the data mining model. The most popular use for a model is for prediction purposes. The patterns found are used to make generalizations that enable to perform predictions about previously unobserved data. Models can also be used for description purposes, so that they can be explored in order to find patterns and relationships that explain the data. Note that this is not a disjoint division, a predictive model can be descriptive as well. Finally, deployment depends on the particular problem. The most relevant aspect in both approaches is that results must be actionable, that is, they must provide knowledge that can lead to actions. Sometimes it is enough with providing non technical users with appropriate interfaces and indicators that are expressed in a comprehensible manner. In general, descriptive models tend to be deployed in this way, as text-based or graphic reports and require some user intervention before they can be put in use. Predictive models can also exploit this approach, but usually are also well suited to be integrated into the operational systems.
3 Defining data mining tasks for supporting tutoring In the early days of e-learning and, in general, of any web-based application, everything was based around contents. At that time, just putting some HTML contents on the web was enough to attract attention. The main addition on delivering courses through the web over traditional means that the student more control over navigation. Nowadays, and especially with the proliferation of LMS platforms, the situation is different. Content delivery, is still important, but there is also a concern in communication and collaboration issues. A virtual course is not only a set of contents anymore, but also may include a collaboration spaces and tools such as
forums, chats or shared document areas. The content oriented setting is basically a web version of the traditional intelligent tutoring approach and the problems more commonly solved using data mining are related to student guidance tasks [4]. The task of providing this kind of, possibly personalized, guidance is referred to as adaptive navigation support [5]. Usually, it provides the student with information such as the most appropriate links to follow in each stage of the learning process, building personalized pages or hiding some contents among others. Virtual learning communities can also provide contents and, therefore, take advantage of the mentioned adaptive tasks. But in this scenario, a student must work in collaborative activities carried out in a shared workspace. Actually, we can think on course settings in which relatively few contents are provided and most of the work is developed through collaborative activities. This shift is important in determining useful data mining tasks because in the content based course layout the main problems are related to supporting students. Of course, tutors can be fed with some information or analysis about student performance, but their ability to influence in the course development is limited once the contents are designed. Now there are two actors equally involved, a student that has to perform the proposed activities and communicate and collaborate with other students, and the tutor, who has to manage the group and organize the work. Obviously, collaborative workspaces pose again some problems for students, who may feel overwhelmed because of the diversity of interactions available or have difficulties in finding someone to work with, for example. But since collaborative activities require a regular work by the student, tutors need to follow more closely the activities carried out in the course and the usage of the collaborative services available in the community. Supporting students and tutors in their interaction with the group is an important factor to make virtual learning communities effective. This task is usually known as adaptive collaboration support (ACS), which is intended to support in groups that involve communication between multiple persons, and, potentially, collaboration towards common objectives [6]. Clearly, ACS can be the source for defining problems that can be solved with data mining techniques, especially since LMS provide very diverse data about user interactions. We have pointed out the need of formulating data mining tasks in a manner that states clearly the expected benefits in a particular domain, the intended users and, in general, the application context. ACS provides a convenient framework to achieve this goal. The notion of adaptive systems may appear to suggest that ACS tasks are mainly related to support students during a course. While this is true, we propose a wider view of ACS that includes also tutors, who in fact are part of the group albeit having a very particular role. Supporting tutors has largely been neglected in the literature, perhaps because sometimes it appears that simple reporting tools are enough to do the job. However, we think that this area is one in which data mining can have a significant impact.
3.1 A working problem The course from which we collected the data was aimed to teach the use of the Internet in education. We set up a workgroup for the students and instructors providing forums, news, chats, file storage areas and personal web-pages areas. At the beginning of the course, we presented the students with a survey in order to evaluate how familiar they were with educational software, the Internet and several computer applications. Additionally, they could fill another survey indicating their interests (distance education, psychology, pedagogy, web design, etc.). In most cases the students were in turn lecturers interested in the use of the Internet in education, and on the whole, they had little experience in the use of computers and Internet services. Tutors closely monitored the students solving, on demand, the difficulties that arose. They proposed several collaborative activities to the students, mainly forum discussions and promoted using the platform services to help their peers. These activities were part of a larger course project used to assess students, but collaboration was not mandatory. Although there was also the possibility of contacting the instructors by other means, the main channels of communication were the course forums and electronic mail. The instructors also visited the chat room established for the course to detect if the students had difficulties in the course. Given this scenario, our goal is to address the following ACS tasks for supporting tutors: • Support for the assessment of the course by characterizing patterns of student performance that help to determine profiles of weak students and how to detect and improve this type of behaviors in future courses. • Support in determining future activity levels during the course that might be indicators of student performance and in correcting undesirable behaviors. • Support for detecting and characterize behavioral patterns that may help to determine different student roles and manage groups in collaborative activities. The formulation of these problems is what should drive the modeling effort more than choosing any particular state of the art technique. We will refer to the particular implications of each of these tasks in preprocessing the data, choosing a modeling data mining technique or evaluating the results in later sections. However, note that tutor support tasks are not only defined in terms of dynamic, continuous adaptation during a course, as are more student support tasks. Supporting tutors lends also naturally to assessment tasks at the end of a course that can be approached with a more traditional one shot model building strategy.
4 Data Preprocessing The first step in any data mining application consists of gathering the relevant data. Under our assumptions, LMS manages all their services through a relational database. This setting provides an integrated source of data that saves some preprocessing effort compared to other data mining applications. Note that we are pre-
senting here a basic scenario. More sophisticated schemes that integrate additional information about students that might be available in an educational organization would require additional work. As it is the case in other environments, data collected by LMS is organized to optimize transactional performance, that is, updates of records in the database. This is achieved by designing highly normalized database schemes that break down the data into multiple tables in order to avoid duplications. Accordingly, student and interaction data is spread over several tables, which becomes a problem for mining algorithms that require data to be assembled into a single, integrated and, in short, mineable table. We will refer to this table as the analysis table. The contents of the analysis table are to some extend domain dependent and even, inside a particular domain, task dependent. An important initial decision is concerned with the granularity of the information contained in this table, or what we could refer to as the unit of analysis. For example, predicting student performance in a course may require a unit of analysis at the student level. That is, each row of the analysis table would represent the relevant information available for each single student. On the other hand, supposse we are analyzing student performance in a working session, that is, the period of time between logging in and out of the platform. If we try to predict whether the student is going to complete a given task at the end of a session, we could think on the session as the unit of analysis instead of the student. The schemes used in relational databases require an extensive preprocessing of data before obtaining a single analysis table, but they offer an advantage over data stored in plain text files, such as web logs. Processing the latter demands adhoc implementations and a deep understanding of the log structure while relational databases provide powerful and widely known means of manipulating data through SQL clauses. Furthermore, the structure of a relational scheme is much easier to understand that custom logs. Basic data preparation with SQL is performed by filtering sets of rows, selecting relevant columns, grouping rows to obtain aggregated columns and joining the tables resulting from several of these processes into a single analysis table. Frequently, the original data may contain errors and inconsistencies, so that a data cleaning process is also needed. Finally, we can enrich or transform the original data by adding new information or deriving new columns. It is interesting to remark here that the data gathered by a LMS may require less cleaning than data collected in other situations. Integrating data collection into a single source reduces the chance of inconsistencies and, assuming that the implementation has no flaws, data should not contain many errors. We will illustrate the process using our running example. As our first source of information we considered interaction data. Our goals required the unit of analysis to be the student, so we designed and executed a set of SQL queries in order to obtain aggregated data for each student in the course and each collaborative service. We ended up with a first set of columns reflecting the number of times that each student had used a given service or performed certain actions on the platform, as shown in Table 1.
Table 1: Columns reflecting data about user interaction with the system Number of sessions started Number of entrances to the course chat Number of messages sent to the course chat Number of messages sent to the course forum Number of files in the file storage area of the course Activated alerts in the forum of the course Created forum Published a web presentation Added bookmarks Sent a email to the whole course Registered in other courses Number of messages sent to other forums Number of entrances to other chats Number of messages sent to other chats Number of files in other file storage areas Activated alerts in other forums Number of static course pages visited Number of threads started in the course forum Number of threads replied by other students in the course forum Number of threads finished in the course forum
Since the main collaborative activities in the course were carried out in the forums, we considered this service a good source of information to extract additional columns. Particularly, we extracted the last three columns in Table 1 that included not only number of accesses, but more detailed use of the forum such as threads started, threads replied by other students and threads finished. Note than in a different setting additional information could be extracted if there is some intuition that it is relevant for the problem at hand. Although most of the columns might be considered as generic for many data mining goals, some preprocessing is always task dependent. In our case, we differentiated between two different problems, namely, performing analysis aimed to give tutors an insight of what happened on a full course and developing more dynamic analysis models that can be used to make predictions through the course. In this latter case, time frames play an important role because evaluating a data mining model that makes use of the data gathered at the end of the course makes no sense if we want to use the model to perform a prediction during the course, when only partial data is available. We take this fact into account by generating
an alternative analysis table that included service usage columns by periods determined by course activities. Another simple but important step is filter the data in order to exclude information that is not considered relevant in our particular task. For example, we removed responses from the student that started the thread and from the tutors, but these data could have been considered under a different point of view. Most of the previously described processes generate numeric columns. Considering that in our tasks the goal is support tutors, we regard comprehensibility of the resulting data mining models as a very important factor. Numerical columns may pose some problems for the interpretation of the models if they refer to magnitudes that tutors are not familiar with. For example, consider the following hypothetical rule characterizing student performance: IF NumMsgForum >= 15 AND ActivityGrade > 8 THEN FinalGrade = pass A tutor can quickly realize that the grade for the activity is high, because the ranges of the measurement are well known. However, it can be much more difficult to perceive whether 15 messages is an important quantity. A solution is to perform a discretization of numerical columns so that they are divided into a set of intervals that can be mapped to categorical values. We discretized our data manually by observing the histograms of each column, but there are several discretization algorithms available. Using automatic methods can simplify the process but, as in other preprocessing steps, specific knowledge of the mining task should be taken into account. For example, we could force to have a special category for the null value, because we consider interesting to distinguish students that have not used a service at all, independently of the automatically obtained intervals. The number of categories is another important issue if comprehensibility of the models is a requirement. After obtaining the information related to user interaction, we decided to enrich the data with two additional types of information. First, we included personal data about students such as having a portrait, a bio or an URL. Secondly, we included data about general user interests and computer related skills obtained from surveys. The latter needed some additional preprocessing since it is a typical case where null values have a different meaning depending if other options have been checked (they are negative responses) or not (they are nonexistent).
5 Building predictive models As in traditional classrooms, tutors in virtual learning communities, need to monitor student interactions. They need to detect or anticipate problems in student performance and to analyze and evaluate what had happened in the course to make improvements in future editions. In this section we describe how we applied predictive modeling to support three of the previously mentioned ACS tasks aimed to help tutors.
First, course assessment can be supported through predictive techniques by constructing models that characterize behaviors regarding some variable of interest (e.g. students that had failed the course). Although this goal has a descriptive modeling flavor, we include it in this section because we accomplish it by mean of predictive techniques. However, unlike in purely predictive modeling tasks, in this case, in addition to accuracy it is necessary to take into account the comprehensibility of the models. Anticipating a particular situation during the course differs from the previous task in that models cannot be constructed using all the data available at the end of the course. Since they should be able to provide predictions about a given variable during all the course, modeling techniques need to be evaluated as regard their capacity of reaching reasonably predictive accuracies at early stages of the course, when only partial behavior data is available. 5.1 Supporting tutors in course assessment There are many different possible ways of considering the problem of course assessment but in our case, we set the goal of characterizing students who had failed the course. The idea is to get insight into the behavior of these students and find patterns that may confirm or deny tutor intuitions about the course and, possibly, particular cases of interest. Given these goals, we considered that simply measuring overall accuracy was not a good performance indicator. Instead, we were concerned with obtaining the best characterizations regarding a particular label value, namely, failing students. Therefore we aimed at maximizing the accuracy of predicting if a student will fail. We aimed to cover as much weak students as possible, even though this meant to label as failing some students that actually passed the course. Additionally, we wanted to minimize the number of failing students labeled as passing the course. These notions can be formalized by using a confusion matrix and focusing on the true positives (TP) of predicting students that fail, and the false positives (FP) of predicting students that passed the course. As we remarked above, since our aim is to gain insight into the students behavior, it is important to employ predictive techniques that build models that can be easily inspected by the tutors. Particularly we employed three type of modeling techniques included in the Weka library [7] : decision trees (J48, the C4.5 implementation in Weka [8]), rule generation (PART [9] and JRip, the Weka implementation of Ripper [10]) and Naive Bayes [11]. Since Naive Bayes models consist of the set of conditioned probabilities between each feature and the class, we employed a wrapper feature selection method to obtain the list of the most relevant features which are presented to the users in order to provide a more simple interpretation of the model. In our first attempt we employed all the data available from the preprocessing step described in section 4 including personal information, survey responses and usage data. We will refer to this data set as DS1. Table 2 shows the results obtained for each algorithm. Looking at the overall accuracy seems that J48 is the best
Table 2: Results of applying several prediction algorithms to different versions of the data. Data set
DS1
DS2
DS3
Algorithm
Accuracy
Failed
Passed
TP
FP
TP
FP
J48
0.72
0.64
0.19
0.81
0.36
PART
0.70
0.67
0.26
0.74
0.33
JRip
0.69
0.78
0.41
0.59
0.22
Naive Bayes
0.70
0.75
0.37
0.64
0.25
TP
FP
TP
FP
J48
0.71
0.67
0.26
0.74
0.33
PART
0.68
0.72
0.36
0.64
0.28
JRip
0.71
0.76
0.35
0.66
0.24
Naive Bayes
0.70
0.78
0.40
0.60
0.22
TP
FP
TP
FP
J48
0.72
0.81
0.38
0.62
0.19
PART
0.66
0.76
0.47
0.53
0.24
JRip
0.72
0.82
0.40
0.60
0.18
Naive Bayes
0.64
0.76
0.50
0.50
0.24
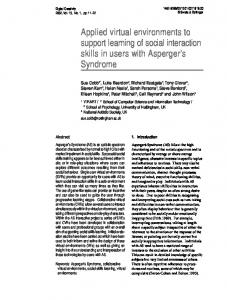
algorithm. However, a closer look at the confusion matrix reveals that most of this accuracy is achieved by correctly predicting if students passed the course but the accuracy of predicting failure is mediocre. Actually, JRip and Naive Bayes provide the best combined results following our particular criteria for this task. Exploring the resulting models revealed that they are too simple in order to provide interesting explanations about student behavior. Figure 1 (a) shows an example of the rules obtained with JRip. Although it suggest that students that provided an URL as personal information tended to pass, and that this feature is probably an indicator of interest on the course, there is not much more insight provided. Note that no rule describing failing performances is obtained, since they are covered by the default. Looking at the most relevant features detected by Naive Bayes, we also observed the presence of several survey related and the previously noted related to the student URL that were difficult to interpret. From these results, we created a second data set, DS2, in which we removed the personal information and the responses to the survey. In order not to discard completely all this information, we added two binary features indicating whether the preferences and skills surveys were answered or not. Results in Table 2. Again, JRip and Naive Bayes were the best performers, although the other two algorithms provided improved results.
(a) IF NumMsgForum = medium THEN pass IF URL = yes THEN pass default: fail ----------------------(b) IF NumMsgForum = medium THEN pass IF NumMsgForum = low and ThreadStarted = none THEN pass IF NumSessions = high THEN pass IF CreatePresentation = yes THEN pass default: fail ----------------(c) NumSessions = veryLow | EntranceChat = veryFewOrNothing | | ThreadStartedNotReplied = yes | | | Spam = yes: pass | | | Spam = no | | | | EmailAlerts = veryFew: fail | | | | EmailAlerts = medium | | | | | EntranceOtherChats = yes: fail | | | | | EntranceOtherChats = no: pass | | | | EmailAlerts = many: pass | | ThreadStartedNotReplied = no: fail | EntranceChat = few | | MsgForumOut = no: pass | | MsgForumOut = yes: fail NumSessions = low | TicketSent = yes: pass | TicketSent = no | | MsgForumOut = no: fail | | MsgForumOut = yes: pass NumSessions = medium | TicketSent = yes: pass | TicketSent = no | | ThreadsOutReplied = yes: fail | | ThreadsOutReplied = no | | | PreferenceSurvey = no: pass | | | PreferenceSurvey = yes | | | | EmailAlertsOut = yes: pass | | | | EmailAlertsOut = no | | | | | EntranceOtherChats = yes: pass | | | | | EntranceOtherChats = no: fail
Figure 1: Examples of different models obtained: (a) JRip with DS1, (b) JRip with DS2 and (c) part of the decision tree of J48 with DS3.
The obtained models were somewhat better at explaining student behavior, particularly those obtained with J48 and PART, but they still trade too much accuracy compared with the other two algorithms. Figure 1 (b) shows the new set of rules obtained by JRip. While it provides some additional insight with respect to the results obtained with DS1, they are still limited. We observe that creating a presentation in the course and a high number of sessions are good indicators. This results match the relevant features obtained by the Naive Bayes model. A problem that appeared to be in both datasets is that the number of messages sent to the forum was a very strong predictor of performance, so that alternative features that could described failing students were discarded. Although this makes sense due to the type of activities proposed in the course, this is a more or less obvious information for tutors so that it does not provides information. Therefore, we generated a third data set from DS2 that we call DS3 in which the number of messages to the forum were removed. Results are now much better under our criteria for J48 and JRip, even though overall accuracy is largely unaffected. Figure 1 shows part of the decision tree obtained from which several patterns can be observed. For example, a pattern suggests that students who fail are not only those who have a low number of sessions, but also are relatively unaware of the development of the course, as indicated by not having activated alerts or notifications (Spam and EmailAlerts). 5.2 Supporting tutors in anticipating student activity levels The shift from traditional content based courses to virtual learning communities is not merely a technical change, but means a course design oriented toward group work with strong emphasis in communication issues. Monitoring students is not only a matter of gathering and evaluating qualifications. Tutors need to observe their activity to determine their implication and participation in the course. In our running example, collaborative activities were developed mainly through forums and chats and, therefore, the eagerness to interact with these services should be a good indicator of the student performance. Although monitoring activity could simply be a matter of manually observing access statistics for these two collaboration services, predictive models could help to improve performance at least from two points of view. First, we could have students that can be labeled as active even though their use of these services is limited, because they make use of other communication tools. Secondly, some unexpected patterns may arise that can be captured by the predictive model and improve overall performance. Refining the formulation of the goals for our particular case, we found some differences with the task presented before. In this case, we were interested in a good overall prediction rate because we require to detect both weak and very active students. In the first case, tutors can correct the situation encouraging students to interact more. On the other hand, potentially active students can be good candidates as leaders or moderators of collaborative activities. In our example, tutors labeled each student at the end of the course regarding
their subjective assessment on their level of activity. In this case, modeling cannot be performed over the final data set that includes the student data over all the course. The correct model assessment need to simulate different situations during the course in which only partial interaction data is available. As we described in the preprocessing section, we generate different data sets by periods with accumulated information corresponding to the time frame of activities of the course. We conducted some preliminary experiments using a decision tree to predict at different stages of the course the level of activity of each student. Without many specific tuning of the data sets we were able to reach an accuracy around 65% from early stages of the course, which turns out to be difficult to improve beyond 70% by observing more student interactions.
6 Building descriptive models Predictive models are powerful analysis tools, but they still require defining a particular target of interest in advance. Sometimes, though, there is no particular variable to predict and the goal is to discover structure in the data and gain some insight. Although we have reviewed the explanatory approach in the previous section, here we will focus on unsupervised methods which are descriptive in nature. In our experiences, we built descriptive models to address two different goals. First, tutors needed some support in determining student profiles in order to exploit them when assigning roles in collaborative activities. We employed clustering techniques to discover groups of students that show common behavioral trends [12]. Secondly, we wanted again to provide support in assessing the course, but this time without focusing in any particular target variable as we described in section 5.1. We achieved this goal by simply adding a different interpretation to the clusters that allowed to assess if behavioral patterns were correlated with known goals. 6.1 Supporting tutors in determining behavioral patterns There exists a large number of clustering algorithms and the choice depends on the particular application. For our purposes, we require an algorithm capable of dealing with categorical data. Model-based clustering is an approach that has gained wide popularity in the literature for both continuous and discrete data [13]. To help instructors interpret the clustering results in terms of the input features, we provide two pieces of information. First, we list all the features ordered by the degree of discrimination they provide between the different clusters. Additionally, we show a measure indicating how different the probability of each feature value in a given cluster is from the average probability in the full data. This measure of lift, commonly used to determine the interestingness of rules in association rule mining, reflects subsets of data inside a cluster that represent a behavior departing from the general tendency. The first information serves for the purpose of a general and comparative characterization of the groups while the second detects more particular behaviors derived from the segmentation obtained.
Table 3: Student profiles including discriminant features, interesting features and an external profiling feature (pass/fail). Cluster (%)
Discriminant
Interesting
External
1 (0.10)
High initiative, promote discussions, high participation in forum
Create forum, publish presentations, participate in external forums
Pass (0.77/0.23)
2 (0.07)
Medium/low initiative, do not promote discussions, high participation in forum, high participation in chat
Participate in external chats, create bookmarks, high number of sessions
Mixed (0.49/0.51)
3 (0.41)
Low initiative, low participation in forum and chat
Mixed (0.57/0.43)
4 (0.32)
High initiative, promote discussions, low participation in forum, low participation in chat
Fail (0.25/0.75)
5 (0.03)
Average in all areas
High number of visits to static pages, activate external alerts, participate in external forums, activate spam
Pass (1.0/0.0)
6 (0.07)
Low initiative, average participation in forum, low/high participation in chat
Activate alerts, use file storage area
Pass (0.89/0.11)
An examination of discriminant features for our first results indicated that the main characteristics used to form the clusters were the responses to the interests and skills surveys. While this clustering could make sense for some particular purpose, in our case we found difficult to obtain some insight. This is the same problem observed in previous section, so we used the data set we referred to as DS2 in section 5.1. With this modification we not only reduced the influence of this sort of features, but also changed the perspective of the data. After some experiments, we obtained a final set of 6 clusters that seemed to be reasonably explanatory. Table 3 shows examples of group profiles obtained from the most discriminant features. Additionally, it includes interesting properties found in each cluster (differing from the average) but not covering all the members and the external profiling feature. They can be used by tutors, for example, to identify some effects derived from group behavior. For example, students in cluster 1 are highly collaborative and appear to help
their peers promoting discussion and, in some cases, creating new forums or publishing presentations. This cluster tends to represent our ideal collaboration profile. In cluster 2, students tend to participate but at the same time their contributions do not generate too much interest. Since students appear to be motivated, a instructor could encourage this group to work harder in the course contents to better exploit their interactions. Students in cluster 3 exhibit a passive behavior. They could be representative of free-riders, learners that do not know how to work in the group or simply lack of motivation for social work. Additional information on passive interactions (e.g. reading messages) would help to determine whether they are taking profit of their peer contributions or just worked alone. Depending on the interpretation, an instructor could encourage this group to work harder or provide clues about how to contribute, among other actions. In intermediate steps of the course, we could have used these profiles to help the tutor in creating groups of students to perform collaborative activities. They can also exploited to assign roles into groups. For instance, members of cluster 1 could be a choice for moderators. Similarly, it can be taken into account that if cluster 3 represent free-riders, it may be counterproductive to join several of their members with a member of cluster 1, since this can promote the sucker effect. Obviously, these decisions would depend on the particular pedagogical strategy to be applied. 6.2 Supporting tutors in course assessment To assess the course we should help tutors in understanding the groups obtained in the previous section in terms of known measures of interest. A strategy sometimes employed in data mining applications consists in defining a set of external characterization features that are not used to build the model. In our experiments we follow this scheme using an external feature that indicates whether a student has pass or failed the course. It is important to note the differences between this approach and using predictive modeling to develop explanatory models. The patterns obtained in the previous section were aimed to explain a particular target while using unsupervised techniques we obtain first general patterns and then verify if they correlate to domain knowledge. We have used grades in this example, but other course dependent measures could have been added as well. Note that there is no need to change the data mining technique and it is just a matter of enriching the interpretation provided to the user. As a result (see the last column in Table 3), we obtain a profile for each cluster described both in terms of the input features as before and the value of the profiling feature. Results do not allow to conclude that collaboration patterns are always correlated with performance. For example, cluster 4 contains students with high initiative and that promote discussions but were not engaged in the forum activities. This suggests that collaborative activities may have some impact in student performance. On the contrary, cluster 3 consists of a group of students exhibiting low participation but with mixed results. In this case, this seems to evidence that collaboration was not necessary to pass the course.
7 Lessons learned and challenges Learning Management Systems provide a suitable infrastructure to build e-learning courses offering a range of communication, information sharing and content delivering and evaluation facilities. However, they tend to not provide much support to tutors besides simple activity reports. In this context, we think that there is an opportunity for developing specific applications of data mining technology that unveil and predict student behavioral patterns. The ultimate target of our research is the development of embedded data mining applications that fulfill the previous goals and are integrated seamlessly into a LMS. This objective requires incorporating all the data mining process into these tools while hiding most of the particular technical details to users. Along this chapter we have described several experiences of applying data mining aimed to different tutor problems and using different assumptions and techniques. Next we review the lessons learned from these experiences and the challenges ahead. 7.1 Definition of data mining tasks A concise definition of the problem to be solved using data mining is recognized as an important issue, but it gains even more importance if we are to automate the process. In this regard, we think that research should advance towards defining generic ACS tasks that can be shared between courses of different disciplines and that can benefit from applying data mining techniques. The tasks we have proposed are along these lines, but their generality stems from the fact that they include few domain specific knowledge. The support that they provide to tutors can be adapted to virtually any e-learning course over the same LMS and using typical services such as forums or chats. Solving problems relying on more specific domain knowledge appears to be desirable to build fully vertical applications, but, on the other hand, excessive specialization may cut down flexibility. Some LMS provide not only basic services, but specialized activities which have their own pedagogical structure but, at the same time, can be applied to different contents. We think that future research should follow this idea by defining general templates that include collaborative activities together with ACS tasks and goals that can be solved with data mining techniques. 7.2 Data preparation Creating a mineable table requires significant data transformations from operational systems. Usually, in business applications, beyond the technical complexities of the process, preparation is challenging because it needs to integrate data from different areas, each with its own focus and orientation. Using modern databasebacked LMS for e-learning provide us with a single and uniform source of data that alleviates some of these problems. Several common data preparation stages are greatly simplified or unnecessary, because there are few inconsistencies and errors.
Working with a common data model for any e-learning course, independently of its contents, should lead to a better automation of the preparation process. For example, we could provide a standard set of features out-of-the-box from a given service such as a forum. We should be able to provide easily not only simple measures such as the number of messages sent by a student, but many other derived features such as ratios by session, deviations from averages, etc. We should point out here that in our experiences we made a very limited use of derived features and that this is an issue seldom explored in the literature of data mining in our particular domain. It is known that generating derived features that provide a different perspective of the data can improve mining models, so experimenting with different alternatives to decide a good set of predefined preparation steps is an important research direction. As it is the case in defining generic goals, data preparation is still too complex and diverse to guarantee a complete automation of the process. A particularly challenging problem is that data preparation is intimately intertwined with the model building process so that data mining is usually a refinement process that iterates between these stages. A way to go could be to provide intuitive model validation measures so that end users are only required to iterate between model building and feature selection from a wide set of predefined features. Following this approach, an important research issue would be the impact and utility of automatic feature selection techniques [14]. As we have described, selecting the proper feature set has proved to be an important part in obtaining good models. However, while most of the feature selection research is aimed to simply improve predictive accuracy, we have also seen that in this domains there are other important concerns, such as comprehensibility. 7.3 Model building The problem of shifting the responsability of model building from a technical data analyst to a end user is that the latter has the domain knowledge needed for the task but lacks the technical expertise. Although we have not given details in parameter selection for the different algorithms, once a validation measure is defined, this is not difficult to automate. We have seen that depending on the problem, the choice of a particular model is not only made taking into account total predictive accuracy. In our experience distinctions among different type of errors turn out to be important. Using a confusion matrix is only one simple way of tackling the problem, but other approaches could be tested such as different measures or cost-based learning systems. Depending on the intended use of the model, the goal might not be to reach the higher possible score of a given quality measure. Adaptive applications that are supposed to be used and refined over time may ask for other desirable properties such as rapid learning [15], even sacrificing some global performance. In any case, defining good validation measures for this domain is an important research issue. Ideally, the definition of generic data mining tasks should help to define associated validation strategies to fulfill each particular goal. We have found interesting that comprehensibility for end users may not always
be correlated with the common technical interpretation of the term, i.e., simplicity. Sometimes, a somewhat larger set of rules can provide a better insight to characterize student behaviors. Moreover, some models with high predictive values can rely on a few good predictors that are obvious in a particular setting and provide little real value. In this sense, there are several type of models that are commonly considered as more comprehensible but that, in practice, show some drawbacks. For example, decision lists such as those generated by the PART algorithm are not so easy to interpret because they are ordered and each rule depends on not matching the previous ones. Additionally, typical strategies to generate rule sets or decision trees select a single feature at each step discarding others that might be similarly relevant but that are considered redundant for prediction. For characterization purposes, redundancy may be in fact useful because it provides different interpretations of the model. This suggest either studying modifications to existing algorithms or –possibly more reasonable direction– developing postprocessing procedures that generate different model views. Finally, as pointed out in [1], while in many business applications one of the main concerns is dealing with a large number of observations, in virtual learning courses this may be the exception rather than the rule. The need for larger data sets is also a recognized problem in machine learning for user modeling [16].
8 Concluding remarks In our experience, data mining has proven a potentially useful tool to provide a good support for tutors in virtual learning communities. Nevertheless, automating data mining functionalities into LMS still requires to solve some research problems. On one hand, LMS provides a very desirable capability, integrated data collection and management. By developing general ACS task definitions and data preparation templates, we could hide part of these processes to end users. However, we have also seen that in order to obtain the best results, a high degree of expertise and user interaction is still needed. In any case, once we have a working mining model, we think that the final deployment to support tutors in a LMS could be a relatively easy task. For example, for a given cluster we could easily obtain from the database the corresponding list of students and perform some action such as role assignment. In general, the only requirement would be to develop some integrated interfaces linking model descriptions to the LMS database.
References [1] Lavrac, N., Motoda, H., Fawcett, T., Holte, R., Langley, P. & Adriaans, P., Lessons learned from data mining applications and collaborative problem solving. Machine Learning, 57(1-2), pp. 13–34, 2004.
[2] Srivastava, J., Cooley, R., Deshpande, M. & Tan, P., Web usage mining: discovery and applications of usage patterns from web data. SIGKDD Explorations, 1(2), pp. 12–23, 2000. [3] Ansari, S., Kohavi, R., Mason, L. & Zheng, Z., Integrating e-commerce and data mining: architecture and challenges. The 2001 IEEE International Conference on Data Mining, ICDM01, pp. 27–34, 2001. [4] Weber, G. & Specht, M., User modeling and adaptive navigation support in www-based tutoring systems. Proceedings of the Sixth International Conference on User Modeling, pp. 289–300, 1997. [5] Brusilovsky, P., Adaptive hypermedia. User Modelling and User Adapted Interaction, 11(1), pp. 87–110, 2001. [6] Paramythis, A. & Loidl-Reisinger, S., Adaptive learning environments and e-learning standards. Second European Conference on e-Learning, pp. 369– 379, 2003. [7] Witten, I.H. & Frank, E., Data Mining: Practical Machine Learning Tools and Techniques with Java Implementations. Morgan Kaufmann: San Francisco, CA, USA, 1999. [8] Quinlan, J.R., C4.5: programs for machine learning. Morgan Kaufmann: San Francisco, CA, USA, 1993. [9] Frank, E. & Witten, I.H., Generating accurate rule sets without global optimization. Proceedings of the Fifteenth International Conference on Machine Learning, ICML98, pp. 144–151, 1998. [10] Cohen, W.W., Fast effective rule induction. Proceedings of the Twelve International Conference on Machine Learning, ICML95, pp. 115–123, 1995. [11] Langley, P., Iba, W. & Thompson, K., An analysis of bayesian classifiers. Proceedings of the Tenth National Conference on Artificial Intelligence, pp. 223–228, 1992. [12] Talavera, L. & Gaudioso, E., Mining student data to characterize similar behavior groups in unstructured collaboration spaces. Proceedings of the Workshop on Artificial Intelligence in CSCL. 16th European Conference on Artificial Intelligence, (ECAI 2004), Valencia, Spain, pp. 17–23, 2004. [13] Meila, M. & Heckerman, D., An experimental comparison of model-based clustering methods. Machine Learning, 42(1/2), pp. 9–29, 2001. [14] Kohavi, R. & John, G.H., Wrappers for feature selection. AI Journal, Special Issue on Relevance, 97(1–2), pp. 273–324, 1997. [15] Langley, P., User modeling in adaptive interfaces. Proceedings of the Seventh International Conference on User Modeling, Banff, Canada, 1999. [16] Webb, G.I., Pazzani, M.J. & Billsus, D., Machine learning for user modeling. User Modelling and User Adapted Interaction, 11(1), pp. 19–29, 2001.