DATA MINING TOOLS AND APPLICATIONS IN POWER SYSTEM. ENGINEERING ...... Monitoring is a very broad application eld, ranging from the monitoring of ...
DATA MINING TOOLS AND APPLICATIONS IN POWER SYSTEM ENGINEERING Cristina OLARU, Pierre GEURTS, Louis WEHENKEL Department of Electrical Engineering - University of Li�ege Sart-Tilman B 28 B-4000 Li�ege - BELGIUM olaru@monte ore.ulg.ac.be
Keywords: data mining, machine learning, dynamic security assessment Abstract: The power system eld is presently facing an explosive growth of data. The data mining (DM) approach provides tools for making explicit some implicit subtle structure in data. Applying data mining to power system engineering is an iterative and interactive process, requiring an acquainted user with the application speci cs. The paper describes data mining tools like statistical methods, visualization, machine learning and neural networks, exemplifying by results obtained with a DM software developed for dynamic security assessment studies. Power system engineering applications where data mining would be useful are reviewed in the second part of the paper.
for a general approach that is supported to varying degrees by a set of technologies: statistics, visualization, machine learning and neural networks. Classi cation, regression, clustering, summarization, dependency modeling, deviation detection, and temporal problems are expected to be solved by DM tools. Why would data mining tools be useful in the power system eld? There are a few DM related aspects: large scale character of power systems (thousands of state variables), temporal (from milliseconds to minutes, hours, weeks, years) and statistical nature of data, existence of a discrete (e.g. events such as topology changes or protection arming) and continuous (analog state variables) information mixture, necessity of communication with experts through means of visualization, on-line operation time restrictions for fast decision making, existence of uncertainty (noise, outliers, missing information). This paper aims at reviewing power system engineering applications where data mining approaches would be very useful, starting rst by describing speci c DM methods and tools which have been developed in order to enable power systems data mining. For a detailed presentation of data mining tools and applications in power systems we invite the reader to have a look at [2] and the references therein.
1 INTRODUCTION Like many other application areas, the power system eld is presently facing an explosive growth of data. In power systems, irrespectively of the particular application, there are three main sources of data: (i) eld data, collected by various devices distributed throughout the system, such as digital records; (ii) centralized data archives, such as those maintained by control center SCADA systems; (iii) data from simulations, carried out in planning or operation environments. Trends in technology (e.g. in digital protection and recording, control center architectures, simulation software and hardware . . . ) result in more and more data generation, and dramatic cost decrease of mass storage devices makes it possible to store them e�ciently (terabytes - 1012 bytes - of data). The massive raw material needs to be managed appropriately, preferably recycled. The idea is to process the information from the enormous stock of data we have, developing the possibilities for better ways to handle data and support future decision making. Sometimes, the patterns to be searched for, and the models to be extracted from data are subtle, and require complex calculus and/or signi cant speci c domain knowledge, or even worse, there are situations where one would like to search for patterns that humans are not well-suited to nd [1], even if they are good experts in the eld. In situations like power systems related problems where one is faced with high dimensional data sets that are not well understood on the whole, algorithms capable of synthesizing structures from data become a necessity. Developing such algorithms, implementing them into a complete software environment, and applying them to real problems are the purposes of the so called data mining eld. DM is a term calling
2 DATA MINING 2.1 Data Mining process Data mining [3, 4, 5] is the process of extracting valid, previously unknown, comprehensible, and useful information from large data bases and using it. It is an exploratory data analysis, trying to discover useful patterns in data that are not obvious to the data user. DM takes two forms [6]: veri cationdriven data mining, which extracts information in the process of validating a hypothesis postulated by a user and discovery-driven data mining, which automatically extract information novel for the user. Both approaches need an acquainted user with the application speci cs. The quality of the mined information is a function of both the e�ectiveness of the data mining techniques used and the quality (often size) of the data base. A data base is composed of a certain number of objects each one of which is described by a certain number of attributes. For a power system dynamic security assessment DM application for example, each object of the data base, called security scenario, essentially corresponds to a (simulated) dynamic trajectory of the studied system under some particular conditions [2]: the initial operating point (available 1
equipments in operation, topologies . . . ), external disturbances (outages, load disturbances or faults) and dynamic modeling hypothesis (system parameters and automatic/manual actions behavior). Additionally to these attributes, each scenario is provided also with information concerning its security (discrete e.g. secure/insecure, numerical e.g. security margin), temporal behavior of some variables . . . . Once the data base has been developed, the data mining process falls in ve basic steps. Data selection. The step consists of choosing the goal and the tools of the data mining process, identifying the data to be mined, then choosing appropriate input attributes and output information to represent the task. Data transformation. Transformation operations include organizing data in desired ways, converting one type of data to another (e.g. from symbolic to numerical) de ning new attributes, reducing the dimensionality of the data, removing noise, \outliers", normalizing, if appropriate, deciding strategies for handling missing data. Data mining. The transformed data is subsequently mined, using one or more techniques to extract patterns of interest. The user can signi cantly aid the data mining method by correctly performing the preceding steps. Result interpretation and validation. For understanding the meaning of the synthesized knowledge and its range of validity, the data mining application tests its robustness, using established estimation methods and unseen data from the data base.
Conditional histograms of Cct-Sbs Vs Security Critical Clearing Time Of Three-Phase Fault At Machines Ehv Bus
(a) Nb.cas 500.
400.
300.
200.
100.
0.0 0.1
0.2
0.3
0.4
--- Cct-Sbs --10000 objects (Total) Mn= 7.0000E-4 Mx= 0.4595 mu= 0.2106 sd= 8.7328E-2 6971 SECURE objects Mn= 0.1558 Mx= 0.4595 mu= 0.2537 sd= 6.5945E-2 3029 INSECURE objects Mn= 7.0000E-4 Mx= 0.1548 mu= 0.1112 sd= 3.1814E-2
(b) 1.0 Delta[0.0] Delta[0.6] Cct-Sbs Omega[0.6] Pu Omega[0.01] Qu Xinf Vinf Vl Pl
0.9
0.8
0.7
0.6
MIN
0.4
0.3
0.2
0.1
0.883 0.713 0.024 0.999
0.002 0.000
0.981 0.008
1.0
0.9
0.8
0.7
0.6
0.5
0.4
0.3
0.2
0.1
CCT-SBS °° °° ° ° 0.4 °°°°°°° °° ° °°°° °°° °°°°°°°° °° °°°°°°°°°°°°°° 0.35 ° °°°° °°°°° °°°° °°°° °°°°°° °°°°°°°°° °°° °°°° ° ° °°°°°°°°°°°°°°°°°°°°°°°°° °°°°° 0.3 ° °°°°°°° ° °°°°°°°°°°°°°°°°°°°°°°°° °°°° °°°°°° °°°°°°°°°°°°° °°° ° °°°°° °°°°°°°°°°°°°°°°°°°° °° ° ° ° °° °°°°°°° °°°°°° °°°°° °°°°°°°°°°°° °° ° 0.25 ° °°°°°°°°°°°°°°°°°°°°°°°°°°°°° °°°°° ° °°°°° °°°°°°°°°°°°°°°°°°°°°°°°°°° °°°°°° ° ° ° ° °°°°°°°°°°°°°°°°°°°°°° ° ° °°°°°°°°°°°°° °° °° °°° 0.2 °°° °°°°°°°°°°°°°°°°°°°°°°°°°°°° ° ° °°° °°° °°°°°°°°°°°°°°°°°° °°°°° ° ° °°°°°°°°°°°°°°°°°°°° °° ° ° ° ° °°°°°°°°°°°°°°°°°°°°°°°°°° °°° ° °°°°°°°°°°°°°°°°°°°°°°°°°°°°° ° ° ° 0.15 °°°°•°••°°•••°••••°••°•••°•°•••°••°• • •••••••••••••••••• ••••••••••••••••• • ••••••••• •• •••••••••••••••••••• •• •••••••••••••••• 0.1 •••••••••••••• •••••••••• ••• •••••• •••• •••••• • •• ••• 5.e-2 • •••••
Incorporation of the discovered knowledge.
0.0
Correlation ((DELTA 0.0),CCT-SBS) vs. SECURITY
(c)
This consists of presenting the results to the decision maker who may check/resolve potential con icts with previously believed or extracted knowledge and apply the new discovered patterns. The whole DM process is iterative, interactive, and very much a trial and error activity. DM techniques are di�erent one from another in terms of problem representation, parameters to optimize, accuracy, complexity, run time, transparency, interpretability. Visualization plays an important role - it may provide preliminary understanding of data, domain speci c visualizations or can present the results of the mining techniques.
0.0
0.987 0.966
30.
€
40.
50. --- DELTA ---
60.
••• •• 70.
•• •
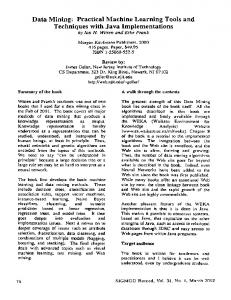
Figure 1: Example of statistical visualizations for an academic transient stability assessment problem: (a) histogram; (b) dendrogram; (c) scatter plot. in data mining in order to nd the most similar object in a data base with a given one (e.g. nding the most similar scenario in the data base with an unseen situation encountered on-line), or to estimate probability distribution for a certain numerical attribute given a set of objects. Taking a transient stability problem for example, gure 1a presents an example of one-dimensional conditional histogram built for 10.000 states of a simple One-Machine-In niteBus (OMIB) system temporal data base, considering the critical clearing time (CCT) attribute space and given a three-phase short-circuit in the EHV substation normally cleared after 155ms. The system is insecure if the CCT is smaller than 155ms (dark grey on the picture) and secure otherwise. Hierarchical attribute clustering approach (dendrogram approach), the algorithm of dynamic clusters (K-Means, ISODATA) and mixture distribution tting algorithm (AutoClass) fall into the class of unsupervised learning statistical methods and support data mining operations like evaluating similarities among data (e.g. among security scenarios), building a set of representative prototypes, analyzing correlations between attributes. Figure 1b shows a dendrogram for the same example of transient stability, in fact a correlation analysis between some
2.2 Statistical methods
Statistical data analyses are involved in many stages of the DM process: data cleansing (retaining outliers which may arise from human or measurement errors, estimating noise parameters), data selection (sampling facilities to reduce the scale of computation), data mining (model search), result evaluation (by descriptive statistical measures). Statistics provide a number of data-analysis tools, like parametric and non-parametric statistical methods (supervised learning) and clustering methods (unsupervised learning) [2, 7]. Parametric methods, like discriminant analysis for classi cation or regression and projection pursuit regression technique, aim at obtaining decision rules or regression models. Distance based methods (like K nearest neighbors), the Kernel density estimation approach, histogram approach or \naive" Bayes approach are referred as non-parametric methods and they may be employed 2
numerical attributes: CCT, active (Pu ) and reactive (Qu ) power of the generator, transient machine rotor angle (delta[t]) and speed (omega[t]), voltages, reactance. Looking at such a correlation analysis one may decide which attributes to select for the next step of data mining, keeping only those which are highly correlated with the output and which, in the same time, present low mutual correlation. Another part of DM operations involving statistics is the extraction of basic statistical summarizations: � in numerical forms - simple descriptive statistical measures (see gure 1a) like mean (for location), standard deviation, minimum, maximum (for spread); � in graphical forms like scatter plots or cumulative distribution graphics. Figure 1c shows a scatter plot, a visualization tool providing information on the relation between two numerical attributes (the transient machine rotor angle at time zero and the CCT) and a discrete attribute (security levels).
Topnode: 7000.0
Delta[0] > 50.433 T2: 2171.0 Y
N
Pu > 1011.0
Delta[0] > 49.468
T3: 1951.0Y
Delta[0] > 51.245 Y L1: 1812.0
N
T4: 139.0
Pu > 1089.0 Y N L2: 114.0 L3: 25.0
T8: 4829.0
N
T5: 220.0
Delta[0] > 51.928 Y T6: 151.0
N
L7: 69.0
Delta[0] > 53.232 Y L4: 95.0
N
T7: 56.0
Y
T9: 226.0
N 4603.0 L11:
Pu > 1184.4 Y N L8: 66.0 T10: 160.0
Pu > 1154.4 Y
N
L9: 17.0 L10: 143.0
Pu > 919.51 Insecure: 2124 Secure: 4876
L5: Y 44.0 L6: N12.0
Figure 2: Decision tree for OMIB transient stability assessment. pretable results and in particular, able to identify the most representative attributes for a given task.
2.3 Visualization techniques Because we nd it di�cult to emulate human intuition and decision-making on a machine, the idea is to transform the derived knowledge into a format that is easy for humans to digest, such as images or graphs. Then, we may rely on the speed and capability of the human user visual system to spot what is interesting, at every step of the data mining process: preliminary representation of data, domain speci c visualization or result presentation. Power system speci c data mining tools for visualization are mainly using two-dimensional maps, colors in order to highlight groups of data which share a common property (same voltage level, same island, same status on/o� . . . ), numerical information (voltage magnitudes, power ows, percentages . . . ). In this context of a large scale power system visualization [8], graphical maps should provide easy to use zooming, focusing, object and group oriented searching, navigation mechanisms between di�erent levels of the information display, incremental editing facilities in case of con guration changes, graphical selection possibilities, simultaneous visualizations for reasons of comparison analysis, time skipping facilities, if appropriate. All the gures provided in the paper are examples of data mining visualization tools. They are incorporated in a data mining software developed in the context of applying automatic learning techniques to power system dynamic security assessment.
2.4.1 Basic Decision Trees
Figure 2 shows a decision tree technique applied to the same transient stability OMIB temporal data base. The transient machine rotor angle and active power of the generator attributes where chosen to explain the output classes de ned on the CCT basis: secure and insecure. In a decision tree, a test built upon one attribute at a time is attached to each interior node, and each terminal node (leaf) is labeled with an output class. To classify a new scenario, one starts at the top node and applies sequentially the dichotomous tests encountered to select the appropriate successor. Finally, a unique terminal node is reached and the class stored there is assigned to this scenario. Note that the tree may be translated into an equivalent set of mutually exclusive rules, each one corresponding to a path from the top node to a terminal node. For numerical attributes, starting with a given learning set, each step of the tree growing algorithm consists in selecting an attribute together with a threshold [2], in order to split the input space into non-overlapping subregions of objects which have the same class. Figure 2 presents every node of the resulting tree by a box area proportional to the size of the learning subset corresponding to this node (the exact size of this subset together with the name of the node are indicated above the box) and the horizontal division of each box shows the proportion of secure versus insecure states in this subset. The test used to divide a node is written under the box and each arc leading to a successor is labeled with a possible answer to this test (here, Yes or No). To determine the generalization capabilities, the tree is tested on a test set of 3000 states di�erent from the 7000 learning states, yielding only 7 states declared erroneously secure and 17 false alarms, i.e. an error rate of 0.8%. \Oblique" decision trees are re ned decision trees using linear combinations of attributes in its test nodes. Regression trees are extensions of the induction technique, predicting a continuous numerical output, rather than a discrete class (e.g. the CCT).
2.4 Machine Learning Machine learning (ML) [2, 4] is the center of the data mining concept, due to its capabilities to gain physical insight into the problem, and participates directly in data selection and model search steps. Assessing problems like classi cation (crisp and fuzzy decision trees), regression (regression tree), time-dependent prediction (temporal decision tree), ML eld is basically concerned with the automatic design of if-then rules similar to those used by human experts. Decision tree induction, the most known ML framework, was found to be able to handle large scale problems due to the computational e�ciency, providing inter3
discriminator
Collapse: 36 Stable: 164
β
TOP-NODE: 200.0
attribute α < α−0.5β
attribute
> α+0.5β
U-bus11.5 | 0
T2: 34
L3: 20
Figure 3: A test node in a fuzzy decision tree.
2.4.2 Fuzzy Decision Trees
Fuzzy decision tree technique is quite useful in the context of a data base with imprecise information from uncertain measurements or human expert linguistic knowledge translation. The tool exploits fuzzy attributes and/or fuzzy classes providing input - output mappings in the form of membership degrees. A class de nition like unstable, stable, very stable in the form of a fuzzy set is more rich and valorous for an operator, than the YES/NO type of answer of the crisp classi cation. Looking to a classi cation problem in the context of continuous numerical attributes [9], a binary fuzzy tree growing identi es the test in a node such as to de ne a transition region between the left and right successors. This supposes the identi cation of two thresholds in the domain of the chosen attribute, not only one, like for crisp decision trees. The input space is split in overlapped subregions of objects. It is in fact a fuzzy discretization of the attributes, based on a priori chosen shape of a \discriminator" function: gaussian, sigmoid, or piecewise linear. Figure 3 shows a test node in a fuzzy tree: � and are the parameters to be identi ed, corresponding to the two attribute thresholds: � ? 0:5 and � + 0:5 . Any new object is propagated through the tree in parallel, along numerous decision paths, and it reaches multiple terminal nodes which are then aggregated to obtain the nal estimated membership degree to the target class. This causes increased computational burden, but in the same time it offers continuity of the output with respect to inputs, fact which permits a global parameter optimization process for the nal tree, thus, a better tree accuracy.
U-bus2