Data-Oblivious Graph Drawing Model and Algorithms Michael T. Goodrich1 , Olga Ohrimenko2 , and Roberto Tamassia2 1
arXiv:1209.0756v1 [cs.DS] 4 Sep 2012
2
Dept. Computer Science, Univ. of California, Irvine.
[email protected] Dept. Computer Science, Brown University. {olya,rt}@cs.brown.edu
Abstract. We study graph drawing in a cloud-computing context where data is stored externally and processed using a small local working storage. We show that a number of classic graph drawing algorithms can be efficiently implemented in such a framework where the client can maintain privacy while constructing a drawing of her graph.
1
Introduction
Technologies developed under the paradigm of cloud computing enable users to access their data seamlessly across devices of vastly different computational power. Moreover, these technologies support computations on a large data set using a small device whose storage capacity is insufficient to simultaneously hold all the data, since the data is held in its entirety on an external server. In this paper, we present techniques that allow a client to efficiently execute various classic graph drawing algorithms, and variations of them, in a cloud computing environment, where the storage of the graph is outsourced to an online storage service. We are particularly interested in allowing a client to access her data and perform computations on them in a privacy-preserving way. For example, an administrator for a fast-growing company may be revising (and visualizing) the organizational chart for the leadership of her company, and leaking this chart to the press or a rival could negatively impact the company. Thus, we view the storage server as an honest-butcurious adversary, who correctly performs the storage and retrieval operations requested by the client, but is nevertheless interested in learning as much from her data as possible (indeed, some cloud computing companies are basing their business model on this goal). Of course, in a cloud computing scenario, the client would encrypt the data she outsources, decrypting it when she retrieves, it and re-encrypting it when she stores it back (using a probabilistic cipher that is unlikely to repeat the same cipher text for a re-encryption of the same plaintext). But she may also be leaking information to the server from the pattern of her data accesses to the storage server. For example, accessing the memory associated with a certain department while preparing a new organizational chart leaks the fact that that department is being reorganized. So the client should additionally aim at completely hiding her access patterns in order to achieve privacy protection for her data. 1.1
Oblivious Algorithms and Storage
The general techniques of oblivious RAM simulation and oblivious storage allow a client to simulate an arbitrary algorithm in such a cloud-computing environment so as to hide both the content and access patterns for her computation (e.g., see [3, 8, 12, 20, 22–25]). But these solutions involve fairly complicated simulation techniques for generic algorithms that increase the running time of the client’s algorithm by a polylogarithmic factor when the client has a small amount of working storage. Privacy-preserving algorithms in the cloud computing scenario with no asymptotic time overhead have been developed for sorting [21] and for fundamental computational geometry problems on planar point sets, including convex hull, well-separated pair decomposition, compressed quadtree construction, closest pairs, and all nearest neighbors [16]. These algorithms also hide the access pattern from the server and are referred to as data-oblivious. In this paper, we develop simple privacy-preserving algorithms for some classic graph drawing problems that fully obfuscate the access pattern from the data server. Our algorithms are provably data-oblivious and utilize small working storage.
1.2
Related Work
There are existing web-based systems that can perform graph drawing services for clients, such as the Brown Graph Server [9] and Grappa [5]. These differ from the framework we are describing in this paper in two ways. First, our model involves the client storing her data in an outsourced data server and accessing that data remotely, whereas the web-based graph drawing services involve a client storing her data locally and temporarily shipping it to the server. Second, in the framework we are describing here, the client performs the graph drawing algorithm herself, not the server (because of privacy concerns), whereas the web-based drawing services employ their own graph drawing algorithms to produce layouts for the client. Abello and Korn [1] describe a system of clustering and hierarchical representations for visualizing large graphs that do not fit in main memory. In addition, Abello et al. [2] discuss at a high level, in a SIGGRAPH column, some of the challenges of dealing with the visualization of large graphs with small working storage. Likewise, there is a large body of work on external-memory graph algorithms, where one solves a problem that is too big to fit in main memory by dividing it into blocks and accessing data in way that takes advantages of localities of reference (e.g., see [10, 30]). The present paper can be viewed as an approach for dealing with the challenge of drawing large graphs with small local memory, but in a different way than using clustering or external memory approaches. In particular, our approach involves accessing items individually, not in blocks, and it involves computing exact drawings, not approximate, clustered, or hierarchical drawings. Our approach is probably most similar to prior work on computations on data streams (e.g., see [4, 26, 28]). In this model, data is presented in single stream, which arrives in an arbitrary order and is processed in an online, read-only fashion using a workspace of small size. Each time an item is considered, all the processing involving that item has to be completed before considering the next item. Henzinger et al. [26] introduce a version of this model that allows for a small number of passes over the data using a small workspace, but their approach still assumes that data is presented in a read-only fashion in an arbitrary order (although they do leave as an open problem whether allowing for alternative orderings can reduce workspace memory size in some cases). In addition, Feldman et al. [17] define the MUD model for describing MapReduce algorithms, which also involves scans and small local memory, but in their model scans are only over small local memories rather than a large set of data. In the context of graph drawing, Binucci et al. [7] describe a framework for drawing trees in the streaming model, where one draws trees using a single scan of the edges, using a framework that is similar to our approach but nonetheless has some important differences. Specifically, as in the traditional data streaming model, their approach only allows for a single scan of the edges of a tree in an order that is not under the control of the algorithm. In our case, the client can make multiple scans of her data and specify the ordering of the scan each time. In addition, in their model, once a node is placed it cannot be moved, whereas we allow for the client to make tentative assignments of coordinates in one scan that can be refined or changed in a future scan, since this more naturally fits the approach of cloud computing. 1.3
Our Results
To enable data-oblivious algorithms for graph drawing problems, we introduce compressed scanning, an algorithmic design framework based on a series of scans. Our method is related to the massive, unordered, distributed (MUD) model [17] for efficient computation in the map-reduce framework. We assume that the server holds a set of n data items and the client has a small private working storage of size O(log n). The data items at the server are encrypted with a semantically secure (probabilistic) cipher so that it is hard for the server to determine whether two items are equal. An algorithm for the compressed-scanning model consists of a sequence of rounds, where in each round the entire data set is scanned in some order specified by the client. During the scan, each item is processed exactly once by the client: first the client downloads the item from the server into working storage; next, the client performs some internal-memory computation on the item and the content of the working storage; finally the item is written out to an output stream at the server. When a round is completed, the output stream is either confirmed as the algorithm’s output or it is used as the input data set for the next round. The efficiency of such an algorithm is measured, therefore, by the number of rounds needed and the size of the local working storage that is required. Ideally, the number of rounds should be O(1) and the working storage should be logarithmic or polylogarithmic in size. As shown in Section 2.2, an algorithm designed in
the compressed scanning framework can be implemented in a data-oblivious way by randomly shuffling the items in between scans. Using the compressed-scanning approach, we provide efficient data-oblivious algorithms for a number of classic graph drawing methods [14], including symmetric straight-line drawings and treemap [27] drawings of trees, dominance drawings of planar acyclic digraphs [15], and ∆-drawings of series-parallel graphs [6]. Our methods result in privacy-preserving graph drawing algorithms whose running times are asymptotically optimal and better than could be achieved by applying general-purpose privacy-preserving techniques (e.g., see [3, 8, 12, 20, 22–25]).
2
Compressed-Scanning
In this section, we formally define the compressed-scanning model for designing client-server algorithms that can be efficiently implemented using a small working storage, W , at the client. We assume that the server holds an array, S, of n data elements. 2.1
Model
An algorithm for our model consists of a sequence of t rounds. A round involves accessing each of the elements of S exactly once in a read-compute-write operation. This operation consists of reading an element from the server into private working storage, using the element in some computation, and writing a new element to an output stream, O, at the server. When a round completes, either the output stream O and/or a set of values in W are confirmed as the output of the algorithm, or we assign S = O and start the next round. This size of the working storage, W , is a parameter of our model, and is intended to be small (e.g., constant or O(log n)). The name of our model is derived from the fact that each round scans the set S and computations are performed using a small, or “compressed”, amount of working storage. Simple examples of algorithms that fit our model include the trivial methods for summing n integers in an array or traversing a linked list from beginning to end, which can be done with a constant-size working storage, or any algorithm in the standard data streaming model, which would have W being equal to the working storage for that algorithm. 2.2
Privacy Protection
Suppose we are given a compressed-scanning algorithm, A, which runs in t rounds using a working storage, W , and a data set, S, of size n. We can implement A in a privacy-preserving way as follows. The first essential step in ensuring privacy is the encryption of the elements in S. From now on we assume that the input stream, S, is stored encrypted at the server and whenever we write elements to the output stream, O, we also encrypt them. We use semantically secure encryption [19], which takes as input the plaintext and a random value. Thus, if the same element is encrypted twice, the resulting ciphertexts are different. This is useful when we read an element, decrypt it, possibly modify it, re-encrypt and write it back. With semantically secure encryption the server will not be able to distinguish whether two data elements are equal or whether the output element of a read-compute-write operation is equal to the input element. The next step in ensuring privacy is hiding the access pattern from the server. For each round, i, of A, we use a new pseudo-random permutation [18], π, to assign a random integer, π(x) between 1 and n, to each element, x, in S. Value π(x) is stored encrypted next to item x. We then perform a random shuffle (e.g., using an oblivious sort [21]) to move each element x to location π(x) so that the server cannot figure out where each element was moved to. (Recall that the elements are reencrypted each time they are accessed.) This step takes O(n log n) time. We now put the elements in a lookup table using the π(x) values as keys, since the adversary will have no way of correlating these values to the original locations of the elements. Finally, we simulate round i, where we use π(x) to do the lookup for element x. Since each element in S is accessed exactly once in the round, each lookup is independent and random; hence, it cannot be correlated with previous or subsequent lookups. For each lookup, we do any necessary local computation, and then write an element to our output stream. Even if we have nothing to output, we can always write a dummy element, for the sake of being oblivious.
In conclusion, we simulate each round of algorithm A in O(n log n) time while fully hiding the pattern of access to the items in S. Thus, the simulation of A takes time O(tn log n) and uses working space of size proportional to that of A. Definition 1. A probabilistic algorithm A is data-oblivious if given two inputs of the same size, I1 and I2 , the accesses that A makes to the memory for I1 and I2 have the same probability distribution. In other words, one cannot distinguish between I1 and I2 by just looking at their access patterns. For example, consider an algorithm that scans the elements of a sorted array and writes to the output stream, O, only distinct elements. This algorithm is not data-oblivious since, given inputs (1, 1, 1, 2) and (1, 2, 2, 2), the write accesses to O happen after a different number of read accesses are made to the input stream. A data-oblivious algorithm would write a value to O for every element it reads from the input: a dummy element if the same element as the previous one is read, and a real one, otherwise. One can then make a simple sorting pass over O to bring real items to the front of the list. A workspace of constant size is used to store the last read element. Theorem 1. Let A be an algorithm in the compressed-scanning model for an input of size n that uses a working space of size k. Algorithm A can be simulated by a data-oblivious algorithm if the number of rounds and the number of elements written to the output stream at each round depend only on n. Also, the simulation uses a working space of size O(k) and runs in time O(T (n)n log n), where T (n) is the running time of A. Proof. (Sketch) Each round is simulated by reading elements from S, writing elements to O, and reshuffling the next input set. Accesses to locations in S are made only once in a random order. This ensures that accesses to S in a single round are data-oblivious. Write accesses to O are also data-oblivious, since they happen on every access to S. After every round, the input sequence is reshuffled (data-obliviously); hence, one cannot correlate accesses between rounds as well. Thus, accesses to S and O depend only on size of S while the number of rounds is fixed by the algorithm regardless of S. t u In the next section we describe graph drawing algorithms that fit the compressed-scanning model and, hence, can be implemented in a data-oblivious manner. These algorithms guarantee that their access patterns do not reveal the combinatorial structure of the graphs that are given as inputs (e.g., number of outgoing or incoming edges for a particular node) and run in a constant number of rounds using W of logarithmic size.
3
Graph Drawing Algorithms
Most existing graph drawing algorithms are designed without privacy concerns in mind; hence, if they are run in a cloud-computing environment, they can reveal potentially sensitive information from their access patterns. For example, a recursive binary-tree drawing algorithm implemented in the standard way can reveal the depth of the tree from the access patterns used for the recursion stack, even if all the nodes in the tree are encrypted. In this section, we present several graph drawing algorithms modified to fit the compressed-scanning model. In order to build a graph drawing algorithm that fits this model, we modify the representation of the graph so that we never access the same location more than once in the same round. For example, consider a tree represented with a set of nodes and pointers from each node to its children and a parent. Traversing the tree in this case involves accessing an internal node several times depending on its degree, which reveals information about the tree. 3.1
Euler Tours in the Compressed-Scanning Model
Traversing a tree in the compressed-scanning model requires that we access each memory location exactly once; hence, we need to reorganize how we normally perform data accesses, since, for example, we cannot access a parent again when coming from its left child after we have already visited it and its right child. Given our small private workspace, W , we cannot store previously accessed nodes. Thus, we need a representation of a tree that allows for a traversal where elements are accessed only once. For this purpose, we construct an Euler tour over a tree that is based on duplicating edges and defines a left to right traversal of a tree.
Each copy of an edge contains a pointer to a copy of the next edge in the tour so we can go to the next edge without using recursion and visiting each edge of the tour only once. For an ordered tree, T = (V, E), we store an Euler tour as a set of items, C, where |C| = 2|E|. Each item represents an edge of the tour and stores information related to the tree, e.g., parent, child node names, and the order of the child among all its siblings. Additionally, it stores information related to the actual cycle of the Euler tour: (a) tag: a unique tag associated with this item, 0 ≤ tag < 2|E|. This is used to locate and permute items. (b) direction: up or down. This indicates which direction in the tree we are following. (c) next: tag of the next edge in the cycle. We assume that tag = 0 for the leftmost edge of the root of T . Suppose we shuffle the items in C using a permutation, π, over the tag field. Then a traversal of C starts with an access to location π(0), following access to π(π(0).next). The items in C are accessed only once and the tree layout is hidden behind the permutation π. Thus, the traversal is data-oblivious and reveals only the number of edges and nodes in the tree. 3.2
Computation over Euler Tour Representations
Many graph drawing algorithms collect information from a tree representation of the graph to determine the layout. Such information could be the height, width, or subtree size of each node of the tree. We now show how one can use an Euler tour representation of a rooted tree to compute for each node of the tree, the size (number of nodes) of it subtree in a data-oblivious manner. For this computation, we add a new field subsize for every edge in the Euler tour C. The algorithm maintains in local memory, W , a variable, total subsize, initially set to 0. Edges in C are traversed as described in the previous section. However, every time we now read an edge, i, we update i.subsize with the value stored at total subsize and write it back. When we are going up, i.e., i.direction = up, total subsize is incremented by 1. Once the traversal finishes, we observe that for every two items, i and i0 , that represent a traversal of the same edge, i.e., i.parent = i0 .parent, i.child = i0 .child, i.direction = down and i0 .direction = up, the value (i0 .subsize − i.subsize) is the size of the subtree rooted at i.child and the final value of total subsize is subsize of the root. However, we need to associate nodes of the tree T with these values in the compressedscanning model as well. For this purpose, we obliviously sort the values in C using the fields, parent and child, to bring items that correspond to the same edge next to each other. We then simply scan the resulting sorted list and after reading a pair of items, i and i0 , output a pair (i.child, i0 .subsize − i.subsize). (See Figure 1.)
a
0
0
c
0
d
5
e
6
6
h
4
g
1 1
7
b
1 2
2
3
f
Fig. 1: Computing the size of the subgraph via Euler tour. During the tour total subsize is incremented when the tour goes up the tree (red numbers in currently visited edge. The size of the node’s subgraph is the counter at the minus the counter of the duplicate of this edge. For example, the size for g is
a locally maintained variable the figure) and is assigned to edge going up from this node (4-1) = 3.
The above computation consists of two rounds: the first round reads one item of C at a time, modifies it and writes it back. The second round starts after the sorting is complete, where items are read one at a time and a new item is written to the output after every two reads. We can compute the depth of each node using a similar technique.
3.3
Drawing of Planar Acyclic Digraphs
We adopt an algorithm for dominance drawings of planar acyclic digraphs from [15], which is simple and elegant but is not data-oblivious. To find the x-coordinate of each node, one builds a spanning tree based on leftmost incoming edges of the nodes and then traverses this tree from left to right, numbering each node in this order. The resulting numbering of each node is its x-coordinate. The algorithm to determine the y-coordinates uses the rightmost spanning tree. Input: We assume that the graph, G, is given as a set of edges, E, where e ∈ E is an edge directed from node a to b storing indegree, the number of incoming edges to b, and child num, the order of a among all incoming edges to b; the leftmost edge has order 0. Data-oblivious algorithm: Following the original algorithm, we show how one can construct a spanning tree and number the nodes to get the final drawing. Our first task is to augment each edge with information about a spanning tree of G. We augment e with additional fields, left spanning and right spanning, which are set to true or false depending on which spanning tree e belongs to. In the compressed-scanning model, one simply accesses e, sets e.left spanning to true if e.indegree equals e.child num or e.right spanning to true if e.child num is 1, and writes e back. Given annotated edges, we construct an Euler tour over each spanning tree. Note that given that the number of nodes in G is revealed, we do not need to hide the number of edges in either of the spanning trees. For ease of explanation, we say that we traverse an edge down when we follow an edge of the spanning tree in its direction in G. The left spanning tree is traversed starting with the leftmost outgoing edge of the root, and rightmost outgoing edge for the right tree. We are now ready to make a tour traversal and assign coordinates to the nodes. We adopt a compressed version of the algorithm that minimizes the area of the drawing and start with traversal of the left tree. In private memory, a counter for x-coordinates is maintained, set to 0. Initially, we output (source, 0, x). For every edge e that has direction = down, and e.indegree > 1 or e is the first traversed edge of a, we output (e.b, counter, x). If e has down direction but is not the first edge of a traversed (in Euler tour this corresponds to remembering the latest visited edge) or is the only incoming edge to b, then we increment the counter by 1 and output (e.b, counter, x). If e.direction is set to up, then we output (dummy, 0, x). The algorithm for computing y-coordinates is similar and outputs values with (e.parent, counter, y). Note that access pattern of reads and writes is always the same: read an edge of the Euler tour and output a tuple of three values. The output of the above procedure contains tuples of real and dummy values. We can remove dummy values and bring x, y coordinates of each node together by obliviously sorting tuples by the first field (node name) such that string dummy is always greater than any real node name. The resulting list contains all dummy tuples at the end. Also, each node has its x- and y-coordinates adjacent. See Figure 2 for an example.
f
f d
e
g
d
c
b
4,1
11,2
Le* and right spanning trees
f
b
e
d
c
b
a
g
c a
(a)
e
3,1
6,1
b
f g
g
5,1
a
d
9,2 10,2
1,0 2,0
e 8,2
c
b
2,0
12,2
a
7,2
d
2,1
f
2,2
g
1,1
e
1,2
c
0,2
0,0
visit order, counter value
(b)
a
0,0
(c)
Fig. 2: (a) A planar acyclic digraph with its left and right spanning trees. (b) The order of the visit to each edge of Euler tour of the left spanning tree and the counter of x coordinate for child nodes, e.g., edge a-g is visited third and g is assigned x coordinate of 1. (c) The final drawing.
3.4
Treemap Drawings
Treemaps are a representation designed for human visualization of complex tree structures, where arbitrary trees are shown with a 2-d space-filling area. Here, we present how one can draw a treemap using an algorithm from [27] adapted to the compressed-scanning model. The original algorithm takes a rectangle area and splits it vertically into two sections. The area of the first section is enough to fit the first child, child1 , of the root and the rest is enough to fit the rest of its children. The next step is to divide the first section among children of child1 but this time splitting the area horizontally. The algorithm continues in the same manner for all decedents of child1 . Once finished, it proceeds to splitting the second section between second child of the root, child2 , and the rest of root’s children. Input: A tree, T , where each node also contains a value area and the size of a rectangle area, w × h, where T should be drawn. We build an Euler tour, C, from T and add two fields parent area and child area to each edge in C. Output: Each node is labeled with (x, y) coordinates of the top-left corner, P , and bottom-right corner, Q, of the rectangle area where the node should be placed in. Data-oblivious algorithm: The original algorithm labels the nodes with values P and Q via pre-order traversal of T . The algorithm we propose here first goes down the leftmost subtree computing values P , Q and labeling the nodes on the way. In private memory, it maintains only one copy of the last two assigned values of P and Q, prevP and prevQ. It then goes up the tree “undoing” all the computations made to prevP and prevQ. We do it in such a way that when going up and reaching some node, we recover its P and Q values as they were before we visited any of its children or other nodes in its subgraph. This algorithm fits the traversal of Euler tour C of the tree T . When going down the tree, we read each item i of tour C and output P, Q values corresponding to i.child. However, when going up we cannot retrieve earlier written P, Q values, since this will not be data-oblivious and we reveal that we are going up, which consequently reveals the depth of the tree. This is where “undoing” computations when going up on prevP and prevQ helps. This is possible since the information used to compute P and Q is stored twice in C: once for edge with direction set to down and once for up. The pseudocode of the algorithm appears in Algorithm 1. Figure 3 shows an execution of the algorithm on a small tree.
a,b,10,5 down
a 10 c 3
b 5 e 1
f 4
d 2
h 1 l 2
k 2
dummy.P =(0,0) dummy.Q = (0,0)
b 5
i 1
e 1
a 10
a.P = (0,0) a.Q =(10,4)
f 4
dummy.P =(2.5,0.8) dummy.Q = (5,4)
(a) e k
l
c
h i
(b)
k 2 l.P =(2.5,0.8) l.Q = (5,4)
prevP = (5,0) prevQ = (5,4) axis = 0 unit = 1
l 2 prevP = (2.5,0.8) prevQ = (5,4) axis = 1 unit = 1.25
prevP = (0,4) prevQ = (5,4) axis = 1 unit = 0.8
(c)
Fig. 3: Treemap graph drawing. (a) The original graph. (b) The final drawing. (c) Execution of algorithm in Section 3.4 on the graph in (a) on a 10×4 rectangle area. The values in dashed rectangles are written for every edge and are never accessed. Variables prevP, prevQ, axis and unit are kept in memory.
3.5
Series-Parallel Graphs
A series-parallel (SP) graph is a directed acyclic graph that can be decomposed recursively into a combination of series-parallel digraphs. The base case of such a graph is a simple directed edge. A series composition
Algorithm 1 Data-oblivious algorithm to compute a treemap drawing of an arbitrary tree. out.node ← root, out.P ← [0, 0], out.Q ← [w, h] write out read π(0) into e . Get an edge corresponding to the leftmost edge from the root of T axis ← 0, unit ← w/e.parent area . prevP, prevQ, unit, axis are maintained in private memory, W prevP ← [0, 0], prevQ ← [w, h] while e.parent 6= root and e.direction 6= up do if e.direction = down then prevQ[axis] ← prevP[axis] + unit × e.child area out.node ← child, out.Q ← prevQ, out.P ← prevP if e.child outdeg = 0 and e.child num < e.parent outdeg then prevP[axis] ← prevQ[axis] . Move the top left corner for the next child else if e.child outdeg > 0 then . Go further down the branch unit ← (prevQ[1 − axis] − prevP[1 − axis])/e.child area axis ← 1 − axis end if else if e.child num = e.parent outdeg then . Going up again. Undo previous P , Q changes. branch size ← unit × e.parent area unit ← (prevQ[1 − axis] − prevP[1 − axis])/e.parent area prevP[axis] ← prevQ[axis] − branch size prevP[1 − axis] ← prevQ[1 − axis] axis ← 1 − axis end if out.node ← dummy, out.Q ← [0, 0], out.P ← [0, 0] end if write out read π(e.tag) into e end while Sort all output values by node field such that dummy values are in the end.
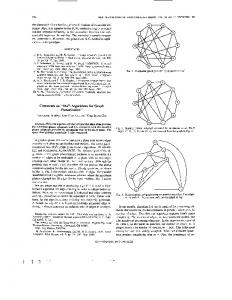
consists of two series-parallel graphs G1 and G2 where the sink of G1 is identified with the source of G2 . A parallel composition of two series-parallel graphs G1 and G2 is the digraph where source of G1 is identified with the source of G2 and similar for their sink nodes. For example, consider the series-parallel digraph shown in Figure 4a. The subgraph S 0 induced by its edges c-d and d-a is a series composition of graphs c-d and d-a. While S 0 and edge c-a is a parallel composition. An SP graph G can be represented with a binary tree (SPQ tree) with three types of nodes, S, P and Q. Q nodes are leaves of the tree and correspond to individual edges of G. An internal node is of type P if it is a parallel composition of the children digraphs. If a node corresponds to a series composition it is called S node. Here, we use a right-pushed embedding of G such that a transitive edge in parallel composition is always embedded on the right. (Figure 4b shows the SPQ tree of the graph of Figure 4a.) Original ∆-drawing algorithm: We adopt the ∆-drawing algorithm from [6]. This algorithm recursively produces a drawing of G inside a bounding triangle 4(G) which is isosceles and right-angled. In the drawing of a series composition, the two bounding triangles, 4(G1 ) and 4(G2 ), are placed one on top of another and, hence, produce a bounding triangle big enough to fit them both. For a parallel composition, 4(G2 ) is placed on the right of 4(G1 ) and a larger triangle is drawn to fit this parallel composition. The algorithm works by traversing the SPQ tree and identifying the size of the bounding triangles of each node. The length of the hypotenuse, b, is enough to store this information. Each Q node is assigned a triangle with b = 2, while for series and parallel nodes b is the sum of b values at the children nodes. When traversing the tree we also compute value b0 , which makes sure that in a drawing of a parallel graph G the edge that goes from the source of G to G1 , the left subgraph of the composition, does not intersect the drawing of G2 . This value b0 for a Q node is simply b, for S node it is b0 (4(G1 )) and for P node it is b0 (4(G1 )) + b0 (4(G2 )). Note that for a parallel node it is the sum of b0 values of both graphs since we want to make sure that if subgraph
a
ca, P 12,12
ca, P
a
ca, Q
10,4
b
2,2
ca, S
ca, S cb, S
e c
2,2
(a)
ba, Q
cd, Q
e
da, Q
d
2,2
4,2
ce, Q
b
4,2
6,2
d
2,2
eb, Q
2,2
2,2
c
(b)
(c)
Fig. 4: (a) A series-parallel graph. (b) SPQ tree representation annotated with values b and b0 (dashed rectangles). (c) The final drawing.
G is later a part of a parallel composition no node will intersect either G1 or G2 . If G is a transitive edge then b0 (4(G)) = b(4(G)). (See Figure 4b.) Once b and b0 are computed for every node, i.e., every bounding triangle, the algorithm computes the (x, y) value of the bottom node of each triangle. The outer most triangle is positioned at (0, 0). Given coordinates (x, y) of a triangle corresponding to the S node with hypotenuse of size b and children with hypotenuses b1 and b2 , we place the first triangle at (x, y) and second at (x, y + b1 ). Given coordinates (x, y) of a triangle corresponding to a parallel node, we place the first triangle at (x − 0.5b2 , y + 0.5b2 ) and second at (x, y + b01 ). Given that we know the coordinates of each triangle, we can now assign coordinates for individual nodes. The source of G is placed at (0,0) and sink is placed at (0, b(4(G))). We then look at each node in G and place it at (x, y +b(4(Gnode ))) where Gnode is a subgraph and node is its sink. (See Figure 4c for an example.) We are now ready to explain the algorithm in compressed-scanning model. Input: SPQ tree from a right-pushed embedding of SP digraph G and nodes that are annotated as S, P or Q. We convert this tree into an Euler tour with addition of parent and child node type: parent spq type and child spq type which are either S, P or Q. Data-oblivious algorithm: The above algorithm makes several computations over the tree to annotate the nodes of the SPQ tree with values b, b0 and (x, y). Value b can easily be computed in the same manner as we computed the subgraph size in Section 3.2. Value b0 of the left child is added only for parents of P nodes. When an Euler tour is going up the tree we can always check the value of parent spq type to know if b0 of the left subgraph should be carried to the right one. Coordinates (x, y) for each node are computed from a small modification of the Euler tour: the left child needs know value b(4(G2 )) and right child needs to know b0 (4(G1 )). It is easy to do this by always reading the next edge and remembering the last edge. Given that we know the coordinates of each triangle, we can now assign coordinates for individual nodes. Recall that every leaf node of SPQ tree is associated with an edge while an internal node is either a DAG or a path of edges in the subtree rooted at this node. Hence, we can associate each internal node of SPQ tree, and edges in the corresponding Euler tour, with two nodes of the series-parallel graph that correspond to the source and the sink of the underlying subgraphs. Given a parent node of SPQ tree and source and sink and csource are equal then node csink is placed at (c1 .x, c1 .y + c1 .b). nodes of its children, c1 and c2 , if csink 1 1 2 Otherwise, we output a dummy. 3.6
Drawing Trees with Bounding Rectangles
In this section, we present an algorithm that draws a binary tree T using a bounding rectangle approach from [11], adapted to the compress-scanning model. This algorithm is slightly different from the approaches we took in previous sections and involves a more complex way of converting it to fit data-oblivious mode. The original algorithm recursively assigns bounding rectangles to nodes of the tree. A leaf node is assigned a rectangle of size 2×1, while an internal node is assigned a rectangle that fits the bounding rectangles of its children. Each rectangle is represented by its width, height and (x, y) coordinate of the left top corner, which we refer to as reference point refpoint. For leaves, the width is 2, and width of internal nodes is the sum of the width of its children. The height of the rectangle is defined as 1 + maxi childi .height. The bounding
rectangle of the root node P is assigned to refpoint of (0, tree height). The refpoint of ith child of node p is assigned to (p.refpoint.x + j