Data-oriented Abstraction of Virtual Sensors for Energy-aware Embedded Software Systems Kaliappa Ravindran , Michael Iannelli
∗
Department of Computer Science City Univ. of New York (City College), USA 160 Convent Avenue, New York, NY 10031, USA
ABSTRACT
1.
Categories and Subject Descriptors
To cater to the user-level needs of diversity and resilience in the sensing apparatus, virtualization mechanisms are needed to provide an data-oriented adaptation capability in the sensor nodes. The sensor virtualization purports to operate on large-dimensional raw input data, with an ability to adjust their data-oriented parameters of sensor nodes as per the accuracy and timeliness requirements. An example is the adjustment of track resolution when processing a radar imaging data to detect objects of interest, based on the situational parameters such as threat levels and weather conditions in the terrain. We employ layered sensing methods to determine the offloading of sensor tasks to cloud machines.
We analyze the computing and communications as incorporated in networked objects (IoT): such as sensors, with focus on the performance and QoS aspects (e.g., latency of sensor data delivery to end-user). We advocate the offloading of complex computational tasks from the field-deployed lowcapability sensor devices to cloud-based remote machines when feasible. In addition to the improved latency performance, the offloading of complex sensor tasks lowers the energy consumption of sensor devices. A key element of our IoT system architecture is the use of layered sensing techniques to determine the offloading of sensor tasks and the network transfer of sensor data. The computational cycles expended and network data transfer overhead vis-a-vis the energy consumption incurred therein, are factored in the partitioning of sensor tasks. Given the large-dimensionality of sensor input data, our architecture incorporates the accuracy and timeliness of sensor outputs as the controllable application-level quality parameters. The paper describes a case study of Optical Character Recognition to corroborate our approach.
C.2.1 [Computer Systems Organization]: Trusted systems, Sensor Data Collection; M.4 [Service-oriented Architecture]: QoS & Reliability, Data Security.
General Terms
Sensor Replication Systems, Distributed Control & Management
INTRODUCTION
In today’s environment of smart sensors and mobile devices, end-users need an abstraction of unlimited computing power accessible at their fingertips. The field-deployed sensor devices that interface with the external physical environment (such as ocean-buoys and UAVs in a coastal surveillance application) are however limited in their computational capabilities (CPU cycles, storage, and network bandwidth) to perform compute-intensive tasks on the raw data collected from the field. Examples of compute-intensive tasks are the image registration and feature recognition to detect objects of interest (using a reference image library): say, for homeland security surveillance. So, methods are being studied to off-load the compute-intensive sensor processing tasks to the back-end cloud VMs [1] for enhanced performance and information quality.
Besides the timeliness and accuracy of sensor reports, energy consumption aspects are also factored in our design of IoT system architecture. We advocate the offloading of complex computational tasks from field-deployed low-capability sensor devices to cloud-based remote machines. In addition to the improved latency performance, the offloading of complex sensor tasks lowers the energy consumption of sensor devices. The computational cycles expended and network data transfer overhead vis-a-vis the energy consumption incurred therein, are considered in the partitioning of sensor tasks. System support mechanisms for such adaptive sensors include the hosting of user-specified surrogate computations on the VMs in back-end clouds.
Keywords
Adaptive Sensing, Large-dimensional Data, Replica Voting, Sensor Faults & Data Errors. ∗K. Ravindran and M. Iannelli are also affiliated with CUNY Graduate Center. Permission to make digital or hard copies of all or part of this work for personal or classroom use is granted without fee provided that copies are not made or distributed for profit or commercial advantage and that copies bear this notice and the full citation on the first page. Copyrights for components of this work owned by others than ACM must be honored. Abstracting with credit is permitted. To copy otherwise, or republish, to post on servers or to redistribute to lists, requires prior specific permission and/or a fee. Request permissions from
[email protected]. SMARTOBJECTS’16, October 03-07, 2016, New York City, NY, USA. c 2016 ACM. ISBN 978-1-4503-4254-4/16/10 ...$15.00. ⃝ DOI: http://dx.doi.org/10.1145/2980147.2980157
Our IoT system is based on a publish-subscribe architecture that allows virtualized sensors to post summarized events from an external environment for processing by one or more applications. See Figure 1. A virtual sensor consists of:
53
Computational & communication structure of a virtual sensor
event subscription interface
deliver output result (i.e., event report)
END-USER
Event repository
logical topology of processing nodes and data flow paths (realized on a cloud)
event e3
sensor 3
Pre-processing on raw data (noise removal, filtering, . . .)
physical sensing elements
collect temperature, moisture, pressure data
sensor 2
sensor 1
event e1
event e2
Pre-processing on raw data
physical data collection elements
Pre-processing on raw data
(feature recognition, target detection, . . .)
physical sensing elements
exercise function-level control
collect imaging and tracking data
Management software stubs for sensor reconfiguration
(trace analysis, anomaly detection, . .)
physical sensing elements
Data gateway
collect data from other systems
data units
RAW INPUT DATA FROM EXTERNAL ENVIRONMENT
L RN A N INTE EM-UTATIO P S YS T COM
RNALNT EXT E ONME ENVIR
Logical functions implementing computational algorithms to process input data
Event processing based Distributed System
Figure 2: Feature-based object sensing (functional view)
EXTERNAL SYSTEM
2.
Figure 1: Pub-Sub structure for virtual sensors
SYSTEM STRUCTURE FOR SMART IOT
We provide a software-oriented model of sensors that enables the transition from an IoT to a smart software system.
1. Physical sensing elements that collect the raw data from an external environment (e.g., radar tracking data); 2. Computational functions that process the raw data to extract useful information for posting as an event of interest (e.g., detection of a plane). The system may have multiple sensors reporting different events through a shared repository that is accessed by the application modules for dissemination purposes. In the radar tracking example, an event reporting the detection of an enemy plane may be processed by a Command & Control module that sends alerts to a military commander for defensive actions. In a system-of-system setting, the event processing may also interface with other external systems via information gateways.
2.1
Object-oriented model of sensors
Consider an object space 𝒪 for detection by a sensor device 𝑉𝑖 deployed in the field. We denote the ’data classifier’ implemented by a device 𝑉𝑖 as 𝑀𝑖 (𝐹𝑖 , 𝐿𝑖 ), where 𝑀𝑖 is an algorithmic procedure operating on a feature set 𝐹𝑖 to describe objects of the class 𝒪. For example, 𝑀𝑖 may employ ’Hidden Markov Models’ for object classification [4]. A canonical functional form of 𝑀𝑖 may be given as: 𝑀𝑖 : 𝐹𝑖 × 𝐿𝑖 −→ 𝒪, where 𝐿𝑖 is a set of logical formulas applied on the feature values instantiated for 𝐹𝑖 . The mapping is many-to-one — see Figure 2. 𝑀𝑖 often employs ’statistical pattern recognition’ techniques to obtain a functional view of the data space of 𝐹𝑖 sensed by 𝑉𝑖 , as captured through the logical formulas 𝐿𝑖 . Consider an example of detecting aircrafts flying over a terrain. Here, 𝐹𝑖 may depict the features (say): speed of movement, horizontal & vertical shapes, noise level (from aircraft engine), and heat intensity (caused by fuel burns); whereas, 𝒪 depicts the various flight patterns that can possibly occur over the terrain. The procedure 𝑀𝑖 may use, say, speed as the primary feature to first distinguish aircrafts from helicopters: such as a rule clause ′ speed′ > 200 𝑚𝑝ℎ; thereafter, the shape and noise level can distinguish a civilian aircraft from a military fighter — 𝐿𝑖 is a set of such clauses.
The event repository is a data abstraction module that separates the physical sensing of raw data from the computational aspects of information extraction therein — as advocated in [2, 3]. This separation of functions allows the offloading of computational tasks to VMs hosted on a remote cloud, which offers many advantages such as sensor extensibility, reconfigurability, and reusability. The paper demonstrates the benefits of sensor virtualization with an application case study: OCR (Optical Character Recognition) based document analysis. The paper is organized as follows. Section 2 provides the architecture for an IoT system of networked sensors. Section 3 outlines how sensor redundancy & heterogeneity impacts the energy-aware task offloading on clouds. Section 4 describes the infusion of error adaptation capability in the sensing apparatus. Section 5 studies the data-oriented features of OCR sensors. Section 6 concludes the paper.
With layered sensing in our IoT system, sensor task allocation involves the selection of [𝑀𝑖 , 𝐿𝑖 , 𝐹𝑖 ] for processing.
Layered sensing vs performance & energy 𝐹𝑖 is a set of (type,value) tuples, with the value field being the ’data’ component for the feature type, as mined from 2.2
54
the accuracy and timeliness of event reports, subject to the resource allocations needed therein. The data processing layer consists of 𝐾 different algorithms: {𝑀𝑖 (𝐹𝑖 , 𝐿𝑖 )}𝑖=1,2,⋅⋅⋅ ,𝐾 , with each algorithm potentially operating on a different feature space of the input data. Based on the external environment conditions and the input data range, the NFV module chooses the optimal algorithm that yields a low probability of mis-detecting events, i.e., a high confusion probability 𝑝𝑖 .
the raw sensor data. In the radar example, a track number is associated with the scanned image data that pertains to the swath area covered by a scan. The multiplicity of these types of data manifests as potentially large volumes of data to be transferred to the cloud for processing. National weather service data, for instance, may run in the range of 130 kbytes to 3 mbytes [5]. Pre-processing of such data to generate actionable information involves a trade-off between transmitting the data to a cloud-hosted VM versus doing the processing on the local device itself. Energy consumption on the local device is a major factor in this decision vis-a-vis the latency involved in moving data to the cloud. With a support mechanism to process selective data types based on the accuracy needs, the data movement & processing on the cloud is controlled by a management entity in our system architecture — c.f. Figure 2. ∗
∗
∗
With knowledge about the mapping of 𝑀𝑖 (⋅ ⋅ ⋅ ) onto resource needs and the system-level resource availability, a management logic in the application chooses right algorithms that meet the accuracy needs (i.e., a lower bound on 𝑝𝑖 ) under resource availability constraints.
2.4
OCR: a case study of cloud-hosted sensor
As a case of data-oriented virtual sensors, we chose Optical Character Recognition (OCR) software for the purpose of hosting a CPU-intensive computation on cloud-based VMs. OCR electronically converts a scanned image of handwritten or typewritten text into a machine-readable text [8] — say, for text search applications. This software can be viewed as performing a sensor task, where the raw data is the scanned handwritten text and the output event is the machine encoded text (the latter is then processed for a summarized interpretation)1 . We employed Tesseract: an open source OCR engine to process the document images [9]. Tesseract software works by first conducting a connected component analysis where the outlines of components are stored for later analysis. This makes Tesseract’s OCR task computationally intensive, beyond the capabilities of hand-held devices. Mobile clients can however invoke the remote server nodes to run OCR software with simple command signals2 .
∗
Suppose 𝑜 = 𝑀 (𝐹 , 𝐿 ) is a ’data classifier’ that detects an object 𝑜∗ ∈ 𝒪 with 100% accuracy. Here, 𝐹 ∗ is an exhaustive enumeration of features in terms of which 𝒪 can be described exactly using an appropriate set of logical formulas 𝐿∗ . Relative to this ideal case, a data classification algorithm 𝑜𝑖 = 𝑀𝑖 (𝐹𝑖 , 𝐿𝑖 ) has ∣𝐹𝑖 ∣ ≪ ∣𝐹 ∗ ∣ and ∣𝐿𝑖 ∣ ≪ ∣𝐿∗ ∣. Though the non-represented features 𝐹 ∗ − 𝐹𝑖 are deemed as less important by 𝑀𝑖 , they do have some impact on the ability of 𝑀𝑖 to distinguish one object from another in certain value regions of the missing feature space. We then say that ∥ 𝑜𝑖 − 𝑜∗ ∥ is a measure of the accuracy of the device 𝑉𝑖 . The uncertainty in the detection of an object by 𝑉𝑖 is captured by a confusion probability parameter 𝑝𝑖 , i.e., the probability that an object 𝑜𝑖 reported by 𝑉𝑖 indeed matches with the physical world object 𝑜∗ within an accuracy 𝛿 — where 0.5 ≪ 𝑝𝑖 < 1.0. Such a specification of sensing quality (i.e., QoS) is associated with each virtual sensor to cater to the individual application needs. See [6, 7] for an information-theoretic analysis of sensor accuracy.
A logical sensor is created that accepts the image of a document as input, runs this input through a filter, runs the filtered output through Tesseract, and returns the OCR string output summary. The latter is then compared to the ground truth using tf-idf vectors to calibrate the accuracy of each sensor3 . See Figure 3. The software yields more accuracy when identifying text and backgrounds of different colors.
2.3 Sensor reusability and reconfigurability
We allude to the reuse of sensors from a software perspective. Given the separation of physical sensing elements from the software processing on sensed raw data, it is possible to make incremental changes to the software in two forms: i) the choice of data dimensions 𝐹𝑖 to be processed, and ii) the choice of computational functions [𝑀𝑖 , 𝐿𝑖 ] to act upon the data. Consider an example of obstacle detection in automobile collision avoidance systems which employ microwave radars, high resolution cameras, and infrared imagers as alternative modes for sensing an obstacle on the road. Based on weather and ambient light conditions, the obstacle detection sub-system may switch to a most effective sensor: say, the infrared imager under foggy weather and the other devices when it is non-foggy: the microwave radar at night and the camera during daylight. Furthermore, the features to look for in the obstacle detection algorithm can be changed: say, based on the geographic region of road terrain. As can be seen, it is possible to have multiple instances of sensor functionality superposed on the raw physical sensing elements to offer various levels of event detection capabilities.
As can seen, virtualized sensors employ networked functions (NFV) that map the accuracy and timeliness needs of event reports onto the system-level resource allocations.
3. 1
SUPPORT FOR SENSOR REDUNDANCY
OCR is useful in applications such as check-clearing in banks, vehicle license plate recognition by Law Enforcement, and searching of printed/handwritten documents in Adobe Reader and Google Books. It is also useful in assisted-living scenarios where a computer can read out a machine-encoded text for the visually impaired. 2 Our system structure was studied on the PlanetLab testbed, where multiple VMs (3#s) are created to realize the complex data processing tasks as part of object detection. These VM nodes are located at different remote locations interconnected with hand-held devices by a hybrid of low and high speed links (ranging from 300 kbps to 4 mbps). 3 In document processing, ”tf” and ”idf” stand for ”term frequency” and ”inverse document frequency” respectively. They indicate how important a word is in a document, and is often used as a weight factor in text mining (say, to rank documents in a search engine).
Principal Component Analysis (PCA) techniques can be employed to determine the feature spaces deemed as important when processing the raw input data. This in turn determines
55
summary generator
An example document (input/output) Representation of text as image Representation of text in ASCII (hard to look for specific words/phrases) (easily searchable texts/phrases)
‘data buffer’ controller propose data YES vote
device 1 (ga)
Helvetica
Helvetica
Lorem ipsum dolor sit amet, consetetur sadipscing elitr, sed cliam nonumy eirmod tempor invidunt ut labore et dolore magna aliquyam erat, sed diam voluptua. At vero eos at accusam et justo duo dolores et ea rebum. Stet clita kasd gubergren, no sea takimata sanctus est Lorem ipsum dolor sit amet, Lorum ipsum dolor sit amet, consetetur sadipscing elitr, sed diam nonumy eirmod tempor invidunt ut labore et dolore magna aliquyam erat, sed diam voluptua. At vero eos et accusam et justo duo dolores et ea rebum. Stet clita kasd gubergren, no sea takimata sanctus est Lorem ipsum dolor sit amet. Lorem ipsum dolor sit amet, consetetur sadipscing elitr, sed diam nonumy eirmod tempor invidunt ut lanore et dolore magna aliquyam erat, sed diam voluptua. At vero eos et accusam et justo duo dolores et ea rebum. Stet clita kasd gubergren, no sea takimata sanctus est Lorem ipsum dolor sit Amet.
Lorem ipsum dolor sit amet, consetetur sadipscing elitr, sed diam nonumy eirmod tempor invidunt ut labore et dolore magna aliquyam erat, sed diam voluptua. At vero eos et accusam et justo duo dolores et ea rebum. Stet clita kasd gubergren, no sea takimata sanctus est Lorem ipsum dolor sit amet. Lorem ipsum dolor sit amet, consetetur sadipscing elitr, sed diam nonumy eirmod tempor invidunt ut labore et dolore magna aliquyam erat, sed diam voluptua. At vero eos et accusam et justo duo dolores et ea rebum. Stet clita kasd gubergren, no sea takimata sanctus est Lorem ipsum dolor sit amet. Lorem ipsum dolor sit amet, consetetur sadipscing elitr, sed diam nonumy eirmod tempor invidunt ut labore et dolore magna aliquyam erat, sed diam voluptua. At vero eos et accusam et justo duo dolores et ea rebum. Stet clita kasd gubergren, no sea takimata sanctus est Lorem ipsum dolor sit amet.
Figure 3: OCR as a cloud-hosted logical sensor
device 2 (gb)
NO vote
device 3 (gc)
d-1 d-2 d-3 raw data from external environment
N=3
raw data from external environment
Machinereadable ASCII text
Tesseract
(A)
deliver data (say, d-2, later)
Spatial replication
(B)
function 3 (gc) function 2 (gb) function 1 (ga)
faulty
device D
': timeliness constraint on data delivery cost incurred for replication :(N)
Filter
USER
[‘cost’ is determined by the amount of: 1. computational efforts expended at system design level (to replicate device functions); 0 2. deployment/maintenance efforts expended in physical world (to install multiple devices).]
compare outputs (outlier analysis)
(PDF, scanned image, . .)
Output report
Input document
QoS-oriented spec: data miss rate { how often [TTC > '] ?? voting box
reference strings to search for
Logical sensor
Temporal replication of e el re lev ity g - e de ice en v g de tero (x) he
(a large value)
n co
3
4
5
6
.
x ve
x>y
ha be
r vio
of ee el gr ev de ce-l eity vi en de erog ) t he (y
.
10
.
# of replica devices (N)
Figure 4: Redundancy support for sensor devices Resorting to sensor heterogeneity in system measurements interplays with the control functions that rely on the accuracy and timely detection of events. A device 𝐷 may run different algorithms 𝑜𝑎 = 𝑔(𝐷)𝑎 (𝑀 ), 𝑜𝑏 = 𝑔(𝐷)𝑏 (𝑀 ), ⋅ ⋅ ⋅ on a raw input data 𝑀 (sequentially or concurrently), and then extract an accurate information 𝑜𝑎 , 𝑜𝑏 , ⋅ ⋅ ⋅ about an event occurrence there-from: say, by voting or outlier analysis on 𝑜𝑎 , 𝑜𝑏 , ⋅ ⋅ ⋅ . Furthermore, 𝐷 may survive against software errors and/or targeted attacks on a specific algorithm, say, 𝑔(𝐷)𝑎 (.), because the other functions 𝑔(𝐷)𝑏 (.), ⋅ ⋅ ⋅ may continue running [10]. To survive against severe device-level failures (such as machine crashes and malicious attacks), a spatial replication of the device-functions is employed: such as 𝑜𝑎 = 𝑔(𝐷1 )𝑎 (.), 𝑜𝑏 = 𝑔(𝐷2 )𝑏 (.), ⋅ ⋅ ⋅ . Figure 4-(A) illustrates the temporal and spatial redundancy to infuse resilience of the sensing process against device failures and errors4 .
Voting among 𝑁 -replicated sensor devices provides an overall confidence level Γ that is higher than the per-device confidence level in the system, i.e., max({𝑝𝑖 )}𝑖=1,2,⋅⋅⋅ ,𝑁 ) < Γ < 1.0, where 𝑝𝑖 is the confusion probability of 𝐷𝑖 in reporting an event. In an example of collision avoidance system for automobiles, multiple sensors may be employed to detect the presence of road obstacles and fuse their results by voting (for improved vehicle safety) [11]. A voting-based improvement in the quality of sensing is expressed as: ( ) 𝑁 −1 (1 − 𝑙1 [1 − 𝑝𝑖 (𝑒)]𝑙1 +1−𝑙2 ) > Γ, (1) where 𝑙1 /𝑙2 are the number of consents/dissents about an event occurrence 𝑜 ∈ 𝒪 proposed by 𝐷𝑖 (i.e., candidate data) — assuming that all sensors have the same capability for event detection. For instance, 𝑝𝑖 = 0.85 and 𝑁 = 10 can achieve a confidence level of 98% with replica voting. With only an inexact knowledge about the ground truth on measurements, the confidence depicted above indicates the sensing accuracy: which is determined by 𝑁 .
Figure 4-(B) shows the cost of device replication from a system designer perspective. In a relative measure, the cost of 𝑁 -replication may be given as: 𝒪(𝑘[𝑥].𝑁 2 ), where 𝑘[𝑥] > 0 is a constant for a given degree of heterogeneity 𝑥 such that 𝑘[𝑥] > 𝑘[𝑦] for 𝑥 > 𝑦. The heterogeneity of an algorithm 𝑀𝑖 (⋅ ⋅ ⋅ ) may be measured on a scale [0, 1]: with 0 and 1 respectively indicating exactly identical and completely different implementations of 𝑀𝑖 . A higher degree of redundancy & heterogeneity improves the sensing accuracy and timeliness but incurs more operational cost. A higher cost arises due to the increased field-deployment & maintenance efforts and the run-time algorithm software overhead to handle 𝑁 devices and their mutual interactions. Device-level energy consumption is a major factor in this cost.
The run-time overhead for 𝑁 -replication of sensor devices in a voting apparatus manifests as the device-level CPU cycles expended for data pre-processing and the data & control messages sent/received by devices over a wireless network — and the device-level energy consumption incurred therein [12]. Also, other experiments conducted at CUNY on an in-house network testbed shed insights on the performance of replica voting among Sharp-Zaurus, HP-iPaQ, and Dell-Axim Pocket-PCs. The experiments show a direct correlation between the data processing & network data transfer and the Pocket-PC energy consumption. For 𝑁 = 10, the algorithm-level software overhead incurred for 7500 repeated runs of voting-based data collection from 4-of-10 de-
4 Function-level heterogeneity with replication offers a higher protection against device failures and data errors, when compared to a homogeneous device replication employed in existing fault-tolerance approaches.
56
.
vices (i.e., 𝑙1 = 4, 𝑙2 = 0) over approx. 1-hour period drains the device battery energy by a significant amount. Relative to a base case of 28%-drain in the idle mode, an algorithmic scenario of 75 𝑚𝑠𝑒𝑐 data pre-processing on each Pocket-PC drains the battery energy by about 42% for data size of 3325 𝑏𝑦𝑡𝑒𝑠 and 33% for data size of 320 𝑏𝑦𝑡𝑒𝑠 (about 18 control messages of 50 𝑏𝑦𝑡𝑒𝑠 each are exchanged per run for inter-device coordination). Such a benchmark5 allows the system designer to factor in the energy consumption aspects when determining the level of sensor redundancy needed.
4. ADAPTIVE SENSOR CONFIGURATIONS
The QoS parameter Γ depicts the end-user’s expectation on the IoT system for accurate notification of external events: say, for surveillance needs. In the voting algorithm, Γ can be improved by: i) Increasing 𝑁 (i.e., the number of replicas); ii) Increasing the system resources 𝐵 allocated for the voting tasks, and iii) Increasing the quality of component sensors with layered sensing techniques (i.e., increase 𝑝𝑖 ). These solutions have their own costs: such as device installation & maintenance and device-level energy consumption. The resource/administrative costs need to be weighed against the penalty accrued otherwise from reductions in Γ.
!
Factoring in these aspects, we autonomically control the degree of replication 𝑁 and system-level resources 𝐵. Two control variables are associated with our replication management: the set of replicated devices participating in data collection and their confusion probability of these devices. This sensor configuration meta-data is denoted as: {(𝐷𝑖 , 𝑝𝑖 )}𝑖=1,⋅⋅⋅ ,𝑁 . A configuration is safe if it satisfies a variant of the condition (1) that allows a distinct quality index 𝑝𝑖 for each device 𝐷𝑖 — where 0.5 ≪ 𝑝𝑖 < 1.0. An autonomic management of replication to meet the performance & QoS needs while lowering the replication cost and energy consumption manifests as an optimization problem6 .
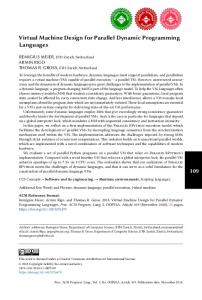
Figure 5: A sample case of hand-written digit ”6”, and neural net classifiers used
5. CASE STUDY: OCR AS SENSOR
classifier. When the system requirements change, such as entering a status of high alert mode, the sensor may switch to models of higher complexity. These models consume more energy and require more time to function, but provide greater classification accuracy. In a similar manner, if the system timeliness requirements become more stringent, the logical sensor may step down to a classifier of lower complexity in order to provide more frequent updates.
The logical sensor utilizes convolutional neural networks for object classification. It consists of a set of five pre-trained models of varying complexity, only one of which is active at any given moment. Convolutional neural networks or CNNs, are a specialized kind of neural network for processing data that has a known, grid-like topology, such as time series or images (Goodfellow, Bengio, Courville).
We consider the case of digit classification on the MNIST (Mixed National Institute of Standards and Technology) database of handwritten digits, consisting of 60,000 examples of handwritten digits ranging from 0 to 9 [14]. Five different convolutional neural networks were trained, each with 7 hidden layers (it is a case of ’deep learning’ [15]). In order of increasing complexity, the networks contained 1718, 2714, 4328, 6200, and 7994 learnable parameters as well as 4, 6, 8, 10, and 12 convolutional layer filters respectively. Figure 5 shows these filters in a sample case for digit 6.
As an instance of data-oriented virtual sensors, we consider the case of Optical Character Recognition or OCR on scanned handwritten digits. In this particular case, the goal of OCR is to correctly classify the image while concurrently meeting certain timeliness and energy constraints.
The logical sensor utilizes adaptive sensing in order to balance its accuracy, energy, and time-lines requirements. In order to conserve energy, the sensor typically operates using one of its simpler models with fewer parameters as its active
The networks were trained on the first 50,000 examples and tested on the remaining 10,000 examples. The energy consumption and timeliness of each classification were measured as well as the accuracy of classifier on the test set as a whole.
5 The experimental results on energy consumption are provided by Mr. Mohammad Rabby, Ph.D. student at CUNY, as part of his work on replica voting based data collection in fault-tolerance settings. 6 An earlier work from our group at CUNY [13] considered deterministic sensing methods (i.e., 𝑝𝑖 = 1.0) in faulttolerance settings.
Timeliness is measured simply by running the classification on each testing example a total of 25 times (for statistical precision) and dividing over the total amount of classifications. Energy is calculated using the Apple Open Source
57
Sensing accuracy vs Timeliness
Sensing accuracy vs Energy Consumption
0.98
0.98
0.97
0.97
0.96
0.96
0.95
0.95
0.94
0.94
0.93
100
150
200
250
300
(msec)
0.93 0.01
7.
0.015
0.02
0.025
0.03
.0.035
X 100
Neural network model
# of Filters (convolution layer 1)
Learnable parameters
Energy consumed per classification (normalized units)
Time elapsed per classification (microseconds)
Accuracy
Net1
1718
4
0.014571085
125.0397959
0.9354
Net2
2714
6
0.019660931
166.9127522
0.9581
Net3
4328
8
0.025340644
251.8664522
0.9724
Net4
6200
10
0.028654028
250.1750841
0.9749
Net5
7994
12
0.03205615
291.7479191
0.9772
Figure 6: OCR results with neural net classifiers Top utility bundled as part of OSX distributions. Power consumption is defined (on a normalized scale [0,1]) as: power consumed =
functionality is incorporated in a system-wide mechanism for autonomic control of sensor replication, under performance, QoS and energy constraints. A case study of OCR (Optical Character Recognition) corroborates our approach.
𝐶𝑃 𝑈 𝑢𝑠𝑒 𝑡𝑖𝑚𝑒 + 𝐶𝑃 𝑈 𝑖𝑑𝑙𝑒 𝑡𝑖𝑚𝑒 × 0.5 , 𝑒𝑙𝑎𝑝𝑠𝑒𝑑 𝑡𝑖𝑚𝑒
where the elapsed time refers to the length of a sample period. This translates to the amount of time a process runs during a sample period with a penalty of 500𝜇𝑠𝑒𝑐 for each wakeup call to the process. Figure 6 shows the experimental results on accuracy vs timeliness of OCR sensor under different types of neural network classifiers (energy consumption is also shown). The accuracy attained is higher than the typical 80-90% rate with PCA-type classifiers [8]. An application of such OCR-type sensor calibrations and accuracy assessment is for Law Enforcement in major cities where a large number of social media postings and YouTube clips are examined for text extraction purpose. In this light, our earlier work at CUNY studied the concept of virtual sensors in video surveillance applications [16].
6. CONCLUSIONS
We consider the system-level mechanisms to support the evolution from a passive IoT (i.e., networks of objects) to a performance & energy conscious IoT software system (ISS). Existing works on IoT deal primarily with computing and communications as incorporated in the networked objects. Our paper infuses performance & QoS awareness as part of a data abstraction layer to enable system-wide configuration control of the networked objects. Our focus is on the system-level mechanisms to transition from a passive IoT to a smart ISS. A key element of our approach is to deal with the data fuzziness and system uncertainty with replicated and distributed sensing techniques. This data-oriented
58
REFERENCES
[1] P. Bahl, R. Y. Han, L.E. Li, M. Satyanarayanan. Advancing the State of Mobile Cloud Computing. In proc. ACM conf on Mobile Comp. Sys. (MCS’12), 2012. [2] S. Kabadayi, A. Pridgen, and C. Julien. Virtual Sensors: Abstracting Data from Physical Sensors. Tech. Rep. 2006-01, U. Texas Austin, 2006. [3] W. Kang, S. H. Son, and J. A. Stankovic. Quality-aware data abstraction layer for collaborative 2-tier sensor network applications. Real-Time Systems 48(4): 463-498 (2012). [4] D.G. Stork, R.O. Duda, P.E. Hart Pattern Recognition Systems. Chap. 1.3, Pattern Classification, 2000. [5] National Weather Service. http://www.srh.noaa.gov/gis/kml/ National Oceanic and Atmospheric Administration. [6] K. Ravindran, K. A. Kwiat, P. Hurley. Information-theoretic Treatment of Sensor Data Collection: a Perspective on Processing and Comm. Tradeoffs. Proc. Intell. Sensors, Sensor Networks, and Inf. Proc. (ISSNIP), Melbourne (Australia), 2007. [7] K. Ravindran and M. Rabby. Replica Voting based Mechanisms for Dissemination of Multi-modal Surveillance Data. In proc. workshop on Assured Distributed Systems and Networks (ADSN), held as part of IEEE-ICDCS, Macau (China), June 2012. [8] Optical Character Recognition. Wikipedia: https://en.wikipedia.org/wiki/Optical character recognition. [9] Tesseract-OCR. https://code.google.com/p/tesseract-ocr/. [10] S. Forrest, A. Somayaji, and D.H. Ackley. Building Diverse Computer Systems. In proc. 6th Workshop HotOS-VI, IEEE, 1997. [11] D. A. Amditis and et al. Multiple Sensor Collision Avoidance System for Automotive applications using an IMM approach for obstacle tracking. In proc. Fusion’02, Intl. Society of Information Fusion, 2002. [12] Jiang Wu, K. Ravindran, A. Sabbir, and K. A. Kwiat Engineering of Replica Voting Protocols for Energy-Efficiency in Data Delivery. In proc. IEEE Symp. on World of Wireless and Mobile Multimedia Networks (WoWMoM), Niagara Falla (NY), June 2006. [13] K. Ravindran, A. Adiththan, J. Jose, and M. Rabby. Autonomic Management of Replica Voting Based Data Collection Systems in Malicious Environments. In proc. ACM Symp. on QoS and Security for Wireless and Mobile Networks (Q2SWinet), Cancun (Mexico), 2015. [14] Y. Lecun and C. Cortes. MNIST database of handwritten digits. http://yann.lecun.com/exdb/mnist/. [15] I. Goodfellow, Y. Bengio, A. Courville. Deep Learning. MIT Press http://www.deeplearningbook.org, 2016. [16] K. Ravindran, M. Rabby, and M. Iannelli. Data-oriented Abstraction of Virtual Sensors for Embedded Software Systems. In proc. workshop on Modelling, Analysis, and Control of Complex CPS, CPSWeek, Vienna (Austria), April 2016.