May 9, 2001 - Reserpine. 50-55-5 saz. Azide, sodium. 26628-22-8 sdc. Sodium diethyldithiocarbamate trihydrate. 148-18-5 sma. Malonaldehyde, sodium salt.
Articles
Data Quality in Predictive Toxicology: Reproducibility of Rodent Carcinogenicity Experiments Eva Gottmann,1,2 Stefan Kramer,3 Bernhard Pfahringer,4 and Christoph Helma1,2,3 1Institute for Cancer Research, and 2Institute for Environmental Hygiene, University Vienna, Vienna, Austria; 3Institute for Computer Science, Machine Learning Lab, University Freiburg, Freiburg, Germany; 4Austrian Research Institute for Artificial Intelligence, Vienna, Austria
We compared 121 replicate rodent carcinogenicity assays from the two parts (National Cancer Institute/National Toxicology Program and literature) of the Carcinogenic Potency Database (CPDB) to estimate the reliability of these experiments. We estimated a concordance of 57% between the overall rodent carcinogenicity classifications from both sources. This value did not improve substantially when additional biologic information (species, sex, strain, target organs) was considered. These results indicate that rodent carcinogenicity assays are much less reproducible than previously expected, an effect that should be considered in the development of structure–activity relationship models and the risk assessment process. Key words: carcinogenicity, machine learning, predictive toxicology, quality assurance, structure–activity relationships. Environ Health Perspect 109:509–514 (2001). [Online 9 May 2001] http://ehpnet1.niehs.nih.gov/docs/2001/109p509-514gottmann/abstract.html
The development of structure–activity relationships (SARs) is gaining more and more importance in predictive toxicology and risk assessment. These models rely on the comparison of chemical structures and their properties with their toxicologic effects and can be used for the prediction of adverse effects of chemicals, but they are also valuable tools to investigate questions of scientific interest (e.g., toxicologic mechanisms). Each SAR study needs reliable chemical and biologic data, but this aspect is neglected in most investigations. Few systemic studies are available for the development of SAR models. This article presents a discussion about the reliability of toxicologic data in SAR models and risk assessment. In a previous paper (1), we covered the identification and representation of chemical structures and the calculation of chemical properties. The database we used for our investigation was the Carcinogenic Potency Database (CPDB) (2). It contains detailed information from long-term in vivo carcinogenicity experiments for 1,289 structurally diverse (noncongeneric) compounds. It consists of two major parts. One data set contains the results of carcinogenicity experiments performed by the National Cancer Institute (NCI) and the National Toxicology Program (NTP); the other part contains carcinogenicity assays from the general literature that meet certain quality criteria (e.g., concerning administration of compounds, duration of experiments, number of test and control animals, availability of original data). One hundred twenty-one chemicals were tested in both parts [Table 1; the complete data set is available from the authors (3)]. This overlap allows the comparison of replicate carcinogenicity experiments with the same compound. Environmental Health Perspectives
Our intention was to investigate the reliability of rodent carcinogenicity assays for SAR studies and risk assessment. This is usually ascertained by repeating experiments with the same substance under the same test conditions. Rodent carcinogenicity experiments, however, are too time consuming and expensive to replicate experiments for a sufficiently large number of compounds. Therefore, we compared carcinogenicity experiments of the overlapping compounds from the NCI/NTP and the literature parts, although they were not performed with identical protocols. This closely resembles the real-world situation for the development of SAR models, where results from different sources and different protocols are combined to obtain a larger database. One measure of reproducibility is concordance, the number or percentage of chemicals that are classified the same way in different data sets. More precisely, we prepared first an overall rodent carcinogenicity classification because classifications neglecting additional information such as species, sex, and strain are often used as the basis for SAR studies and risk assessment. In further comparisons we considered species- and sexspecific effects because it was recommended to use these parameters in SAR models (4) and for the registration of chemicals. We also intended to find out whether it is sensible to develop organ-specific SARs and to what extent additional biologic information influences the accuracy of SAR models and risk assessment. We investigated whether additional toxicologic information, in our case mutagenicity, can help identify carcinogens and whether it should be included in SAR studies. Finally, we compared the quantitative measure for carcinogenic potency, the tumorigenic dose rate 50 (TD50) (5,6) to find out if it is sensible to predict TD 50
• VOLUME 109 | NUMBER 5 | May 2001
values and to distinguish between strong and weak carcinogens.
Methods Source of data. Toxicologic data were obtained from the CPDB compiled by Gold et al. (2). This is the most extensive and detailed publicly available carcinogenicity database, with results of chronic, long-term animal cancer tests. Both qualitative and quantitative information on positive and negative experiments are given, including all bioassays from the NCI/NTP and results from the general literature that meet a set of inclusion criteria (2). The CPDB contains experiments with 1,298 chemicals. For each experiment, the following information is included: species, strain, and sex of test animals; features of the experimental protocol such as route of administration, duration of dosing, dose levels in milligrams per kilogram of body weight per day, duration of the experiment; histopathology and tumor incidence; carcinogenic potency (TD50) and its statistical significance; shape of the dose–response curve; authors’ opinion as to carcinogenicity; and literature citation (2). The CPDB data were converted to Prolog facts for Machine Learning Experiments and data analysis within Sicstus Prolog (7). Statistical evaluation. Generally the results of our investigations take the form shown in Table 2, which summarizes concordant and discordant classifications (carcinogen/noncarcinogen) from two different data sources (NCI/NTP, literature). To analyze the degree to which classifications of items are associated, we used the G index according to Holley and Guilford (8) and the association coefficient according to Cole (9). Given such Address correspondence to E. Gottmann, Federal Ministry of Education, Science and Culture, Abt. VII/B/5 - PROVISO, Minoritenplatz 5, A-1014 Vienna Austria. Telephone: +43-1-53120-5850. Fax: +43-1-53120-5805. E-mail: eva.gottmann@ bmbwk.gv.at We thank M. Kundi for helpful discussions and suggestions for improvements. This project was funded by the Austrian Federal Ministry of Science and Transport (GZ 70.017/2-Pr/4/87). Partial support was also provided by the “Jubiläumsfond der Österreichischen Nationalbank” under grant 6930. The Austrian Federal Ministry of Science and Transport provides general financial support for the Austrian Research Institute for Artificial Intelligence. Received 18 August 2000; accepted 6 December 2000.
509
Articles
•
Gottmann et al.
a table consisting of four entries, a, b, c, and d, as defined in Table 2 (inadequate results were not considered in statistical analysis), these statistics are defined as follows. The G index is defined as G=
It is a measure of the relative increase or decrease in the number of concordant classifications. The assumption of independence (H0: G = 0) is tested using the sign test, either exactly or using the normal distribution:
(a + d ) − (b + c ) N
z =
2(b + c ) − N N
Given positive association, the association coefficient according to Cole (9) is defined as follows: C=
ad − bc min(b,c )N + ad – bc
The asymptotic test for C = 0 is
Table 1. Identification of the 121 compounds tested in the NTP and literature part of the CPDB. Abbreviation Chemical
CAS No.
Abbreviation Chemical
CAS No.
1te 2dc 3db ald ant apc azb azc b38 bcm bde ben bht bna bzo cap ccc cci cdu chb chd chf cms cpm ctl dan day dbe dcv ddt deu dhm dhx die dio dis dmz dph dr9 dsa edd egl ela end eod eta ete eth ffl fl2 fsz fy6 gar gly hb1 hcp hct hep hql hya hyq
71-55-6 107-06-2 20325-40-0 309-00-2 121-66-4 8003-03-0 103-33-3 320-67-2 1937-37-7 75-27-4 106-99-0 71-43-2 128-37-0 140-11-4 91-64-5 133-06-2 999-81-5 156-62-7 150-68-5 510-15-6 57-74-9 67-66-3 3567-69-9 113-92-8 3165-93-3 39156-41-7 6358-85-6 106-93-4 62-73-7 50-29-3 105-55-5 147-24-0 117-81-7 60-57-1 123-91-1 97-77-8 612-82-8 57-41-0 5160-02-1 1596-84-5 72-56-0 97-53-0 140-88-5 72-20-8 75-21-8 536-33-4 20941-65-5 96-45-7 98-01-1 75-69-4 59-87-0 2783-94-0 961-11-5 556-52-5 2784-94-3 70-30-4 58-93-5 76-44-8 148-24-3 103-90-2 123-31-9
kep las ldt lin mbr mbt mca mcl mop mrx mxc myc nac nat nff nha nta oca pb1 pbt pch pcm pct pdd pde phn pip pna pnb pni prb prg prl prp psu qrc red ros rsp saz sdc sma sof sta sty tcb tcd tce tda tep thd tol tou trf trs try tub vdc zdd zec
143-50-0 303-34-4 19010-66-3 58-89-9 74-83-9 149-30-4 79-11-8 7487-94-7 298-81-7 2385-85-5 72-43-5 75-09-2 602-87-9 18662-53-8 67-20-9 121-19-7 139-13-9 303-47-9 11097-69-1 50-33-9 87-86-5 1918-02-1 87-86-5 72-54-8 72-55-9 842-07-9 51-03-6 135-88-6 82-68-8 100-01-6 366-70-1 121-79-9 115-07-1 75-56-9 120-62-7 117-39-5 86-30-6 569-61-9 50-55-5 26628-22-8 148-18-5 24382-04-5 7681-49-4 7772-99-8 100-42-5 88-06-2 1746-01-6 79-01-6 139-65-1 52-24-4 115-29-7 108-88-3 636-21-5 1582-09-8 126-72-7 73-22-3 83-79-4 75-35-4 137-30-4 315-18-4
1,1,1-Trichloroethane, technical grade 1,2-Dichloroethane 3,3’-Dimethoxybenzidine · 2HCl Aldrin 2-Amino-5-nitrothiazole Aspirin, phenacetin, and caffeine Azobenzene 5-Azacytidine C.I. Direct black 38 Bromodichloromethane 1,3-Butadiene Benzene Butylated hydroxytoluene Benzyl acetate Coumarin Captan (2-Chloroethyl)trimethylammonium chloride Cyanamide, calcium 3-(p-Chlorophenyl)-1,1-dimethylurea Chlorobenzilate Chlordane, technical grade Chloroform C.I. Food Red 3 Chlorpheniramine maleate 4-Chloro-o-toluidine · HCl 2,4-Diaminoanisole sulfate C.I. Pigment yellow 12 1,2-Dibromoethane Dichlorvos DDT N,N’-Diethylthiourea Diphenhydramine · HCl Di(2-ethylhexyl)phthalate Dieldrin 1,4-Dioxane Tetraethylthiuram disulfide 3,3’-Dimethylbenzidine · 2HCl 5,5-Diphenylhydantoin D & C Red No. 9 Daminozide p,p’-Ethyl-DDD Eugenol Ethyl acrylate Endrin Ethylene oxide Ethionamide Ethyl tellurac Ethylene thiourea Furfural Trichlorofluoromethane 5-Nitro-2-furaldehyde semicarbazone FD & C Yellow No. 6 Tetrachlorvinphos Glycidol HC Blue No. 1 Hexachlorophene Hydrochlorothiazide Heptachlor 8-Hydroxyquinoline Acetaminophen Hydroquinone
Kepone Lasiocarpine Lead dimethyldithiocarbamate γ-1,2,3,4,5,6-Hexachlorocyclohexane Methyl bromide 2-Mercaptobenzothiazole Monochloroacetic acid Mercuric chloride 8-Methoxypsoralen Mirex Methoxychlor Methylene chloride 5-Nitroacenaphthene Nitrilotriacetic acid, trisodium salt, monohydrate 1-[(5-Nitrofurfurylidene)amino]hydantoin 3-Nitro-4-hydroxyphenylarsonic acid Nitrilotriacetic acid Ochratoxin A Aroclor 1254 Phenylbutazone 2,3,4,5,6-Pentachlorophenol (Dowicide EC-7) Picloram, Technical grade 2,3,4,5,6-Pentachlorophenol, technical grade p,p’-DDD p,p’-DDE 1-Phenylazo-2-naphthol Piperonyl butoxide Phenyl-β-naphthylamine Pentachloronitrobenzene p-Nitroaniline Procarbazine · HCl Propyl gallate Propylene 1,2-Propylene oxide Piperonyl sulfoxide Quercetin N-Nitrosodiphenylamine p-Rosaniline · HCl Reserpine Azide, sodium Sodium diethyldithiocarbamate trihydrate Malonaldehyde, sodium salt Fluoride, sodium Tin (II) chloride Styrene 2,4,6-Trichlorophenol 2,3,7,8-Tetrachlorodibenzo-p-dioxin Trichloroethylene 4,4’-Thiodianiline THIO-TEPA Endosulfan Toluene o-Toluidine · HCl Trifluralin, technical grade Tris(2,3-dibromopropyl)phosphate L-Tryptophan Rotenone Vinylidene chloride Zinc dimethyldithiocarbamate Mexacarbate
Results from carcinogenicity assays are available from the authors (3).
510
VOLUME
109 | NUMBER 5 | May 2001 • Environmental Health Perspectives
Articles
tests, include an interpretation (using the standard interpretation scale for the normal distribution), and rank the results accordingly (Table 2).
c
z =
Reproducibility of rodent carcinogenicity experiments
•
(a + c )(c + d ) N (a + b )(b + d )
Results Both indices may range from 0 to 1, where 1 indicates an ideal association. In Table 3, we summarize the results for these statistical
As described above, the CPDB consists of two different subsets, the results from the NCI/NTP and the results from the general
Table 2. Definition of variables for the statistical tests. Carcinogena Noncarcinogenb NCI/NTP
Carcinogena
Noncarcinogenb
Literature
a c a+c
b d b+d
a+b c+d N=a+b+c+d
aAt
least one experiment is evaluated as positive. bAt least one experiment is evaluated as negative and no experiment is evaluated as positive.
Table 3. Overview of the statistical evaluation. Overall Mice Rats Female mice Male mice Female rats Male rats Single sp./multiple sp.b Single cat./multiple cat.c aInterpretation
G index
z
Inta
Cole
z
Int
Rank
0.353 0.283 0.375 0.200 0.333 0.522 0.373 0.152 0.030
–3.565 –2.060 –3.000 –1.264 –2.160 –3.539 –2.661 –0.870 –0.174
Very high High Very high Low High Very high Very high Low Low
0.407 0.351 0.398 0.205 0.467 0.489 0.440 0.313 —
3.578 3.095 2.991 1.433 4.058 3.481 2.678 3.022 —
Very high Very high Very high Low Very high Very high Very high Very high —
3 6 3 7 5 1 2 8 9
according to the standard scale for the normal distribution.bSingle-species/multiple-species carcinogens.
cSingle-category/multiple-categories carcinogens.
Table 4. A comparison of the classification in the NCI/NTP and literature parts of the CPDB. Carcinogena Noncarcinogenb Inadequatec NCI/NTP
Carcinogena
Noncarcinogenb
Inadequatec
Literature
39 20 10 69
13 30 8 51
1 0 0 1
53 50 18 121
Concordant classification: 69 compounds (57%); discordant classification: 52 compounds (43%). aAt least one experiment is evaluated as positive. bAt least one experiment is evaluated as negative and no experiment is evaluated as positive. cExperiments are evaluated neither positive nor negative.
literature. From experiments on 1,298 chemical agents, only 121 chemicals were tested in both the NCI/NTP and the literature parts. We used this overlapping part of the CPDB for the present analysis. Overall rodent carcinogenicity classification. Our aim was to quantify the concordance/discordance between carcinogenicity classifications from both data sets. Classifications were based on authors’ opinions because authors consider more than statistical significance alone [historical control rates for particular sites, survival and latency, and/or dose response (2)]. A compound was classified as a carcinogen if a positive result was obtained in at least one experiment. The results are summarized in Table 4, which shows that an unexpectedly low proportion of these 121 compounds were classified concordantly in both parts as carcinogens or noncarcinogens. Only 69 (57%) chemicals had concordant authors’ opinions, 57% (39/69) of the chemicals were consistently classified as positive, and 43% (30/69) had negative results in both sources (Table 4). Species- and sex-specific effects. We studied the detail, considering the reproducibility of species and sex specific effects. Evans et al. (10) already noted that species- and sex-specific tumorigenicity is one of the parameters that should be considered when evaluating results from animal cancer studies. Our calculations gave the following results (Table 5): from 70 investigations with mice, 49% had concordant results; from 71 experiments with rats, 62% were concordant. The consideration of sexes gave similar results. The concordance of male mice was 46%, of female mice 36%, of male rats 55%, and of female rats 69% (Table 5).
Table 5. A comparison of the classification with consideration on species and sex in the NCI/NTP and literature parts of the CPDB. Mice Noncarcinogenicb
Inadequatec
Literature
Carcinogenica
11 4 4 19 28 compounds (46%) 33 compounds (54%)
10 17 12 39
1 1 1 3
22 22 17 61
15 10 4 29 35 compounds (55%) 29 compounds (45%)
6 20 5 31
1 3 0 4
22 33 9 64
9 7 6 22 24 compounds (36%) 42 compounds (64%)
9 15 13 37
1 3 3 7
19 25 22 66
10 5 1 16 35 compounds (69%) 16 compounds (31%)
6 25 1 32
1 1 1 3
17 31 3 51
15 7 4 26 34 compounds (49%) 36 compounds (51%)
12 19 12 43
0 0 1 1
27 26 17 70
20 11 4 35 44 compounds (62%) 27 compounds (38%)
9 24 2 35
1 0 0 1
30 35 6 71
Carcinogenica Males Carcinogenica Noncarcinogenicb Inadequatec NCI/NTP Concordant Discordant Females Carcinogenica Noncarcinogenicb Inadequatec NCI/NTP Concordant Discordant Both Carcinogenica Noncarcinogenicb Inadequatec NCI/NTP Concordant Discordant
Rats Noncarcinogenicb Inadequatec
Literature
aAt
least one experiment is evaluated as positive. bAt least one experiment is evaluated as negative, and no experiment is evaluated as positive. cExperiments are evaluated as neither positive nor negative.
Environmental Health Perspectives
• VOLUME 109 | NUMBER 5 | May 2001
511
•
Gottmann et al.
There is obviously a difference between the reproducibility of experiments with mice and rats, although mice and rats are closely related. The tests on rats seem to be far more reproducible. Concerning the sexes, we could not observe clear trends. On one hand, the reproducibility of experiments on male mice was better than on female mice; on the other hand, experiments on female rats had a better concordance than those on male rats. It is notable that experiments with female mice are, with a high probability, statistically independent (Table 3). Carcinogens in mice are probably heavily influenced by the strain (3), which shows that the selection of the strains is another important source of variability in the data. In the NCI/NTP studies, 3 different rat strains and 1 mouse strain were used for experiments with the 121 overlapping chemicals; in the literature, 29 different rat strains and 37 different mice strains were tested. The most frequently used strains in both parts of the CPDB were Fischer F344/N rats and B6C3F 1 mice. The concordance for these strains was 53% (9/17) for male rats, 64% (7/11) for female rats, 39% (15/38) for male mice, and 33% (13/40) for female mice. These values are close to the overall concordance (Table 5) and indicate that the poor reproducibility of carcinogenicity assays may not be due to different strains in the NCI/NTP and literature parts of the CPDB. Another factor that influences the outcome of carcinogenicity assays is the route of administration. Unfortunately, splitting the CPDB in respect to administration routes resulted in data sets too small for a detailed analysis. Thus, we currently do not know whether or not the route of administration plays a role in the concordance of results. Compounds that are carcinogenic in rats and mice are considered more harmful than those affecting only one species. Therefore, we grouped the compounds into one-species carcinogens or two-species carcinogens and compared the classifications of the two data sets. For carcinogenic compounds, 48% (16/33) were one-species carcinogens and 52% (17/33) were two-species carcinogens in the NCI/NTP studies; in the literature, 73% (24/33) were one-species carcinogens and 27% (9/33) were two-species carcinogens. A comparison of NCI/NTP data with data from the literature showed that 58% (19/33) of the compounds were classified concordantly (Table 6), but with low coefficients of association (Table 3) and without an indication for a better concordance as obtained for the overall data set. From concordant one-species carcinogens, only 31% (4/13) affected the same species. Target-organ specificity. To facilitate target organ comparisons between rats and mice,
512
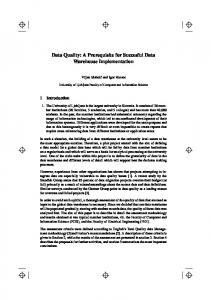
we grouped the tissue codes for the target sites into 11 basic target categories: 1, digestive system; 2, liver; 3, cardiovascular system; 4, endocrine system; 5, hematopoietic system; 6, integumentary system; 7, nervous system, brain, and sensory organs; 8, reproductive system; 9, respiratory system; 10, urinary tract; and 11, other (body regions, muscle, skeleton, etc.) excluding some unspecific tissue codes [all tumors, more than one tumor type; tumor types specified in published paper (mix), more than one tumor type; combined by NCI/NTP (MXA), more than one tumor type; combined by Berkeley (MXB) and tumor, or more than one tumor type; and tumor types not specified in paper (2)]. For 33 common carcinogens in NCI/NTP and in literature, the liver is the most frequent target site, which is in agreement with other investigations (2) (Figure 1). Subsequently, we classified the compounds either as one-category carcinogens or as multicategory carcinogens, because multisite and multispecies animal carcinogens are considered to pose a greater threat to humans than single-site/species carcinogens (11). Our analysis showed that in the NCI/NTP part, the minority (36%; 12/33) of the chemicals was classified as one-category carcinogens and the majority (64%; 21/33) was multicategory carcinogens. In the literature we found similar results: 42% (14/33) of compounds were classified as one-category carcinogens and 56% (19/33) were multicategory carcinogens.
A comparison of NCI/NTP data with data from the literature showed that 52% of the chemicals occurring in both data sets were concordantly classified. The majority of the compounds were multicategory carcinogens (Table 7), but less than 50% of these compounds caused tumors in the same categories. (The statistical analysis summarized in Table 3 reveals a low probability that NCI/NTP and literature results are associated). Comparison of species carcinogens and organ-category carcinogens. Our results indicate a connection between the number of affected species and the number of positive categories. It seems that chemicals classified as one-species carcinogens correlate with one-category carcinogens and that there is also a correlation between two-species carcinogens and multicategory carcinogens. In both parts of the CPDB, the majority of compounds classified as one-species carcinogens were also one-category carcinogens (NCI/NTP, 9/16; literature, 13/24), and the majority of chemicals classified as two-species carcinogens were also multicategory carcinogens (NCI/NTP, 14/18; literature, 8/9; Table 8), but only 33% of the compounds were grouped concordantly in both parts. Quantitative effects. For the evaluation of carcinogenic potency, we used the most potent TD50 for each compound. The TD50 is defined as the dose rate in milligrams per kilogram of body weight per day, which if administered chronically for the standard life
Table 6. A comparison of one-species and two-species carcinogens in the NCI/NTP and literature parts of the CPDB One speciesa Two speciesb NCI/NTP
One speciesa
Two speciesb
Literature
13 3 16
11 6 17
24 9 33
Concordant classification: 19 compounds (57%); discordant classification: 14 compounds (43%). aCompounds are carcinogenic in one species (mouse or rat). bCompounds are carcinogenic in both species (mouse and rat). 30
NCI LIT 25
20
Percent
Articles
15
10
5
0 Digestive system
Liver
Cardiovascular Endocrine Hematopoietic system system system
Integumentary Nervous Reproductive Respiratory system system, etc. system system
Urinary tract
Others
Figure 1. Frequency of target organs in the NTP/NCI and the literature part of the CPDB.
VOLUME
109 | NUMBER 5 | May 2001 • Environmental Health Perspectives
span of the species will halve the probability of remaining tumorless throughout that period (5). A low TD 50 value indicates a potent carcinogen, whereas a high value indicates a weak one. If there is only one positive test on the chemical in the species, then the most potent TD 50 value from that test is reported in the CPDB. When more than one experiment is positive, in order to use all the available data, the reported potency value is the harmonic mean of the most potent TD50 values from each positive experiment (2). A comparison of the compounds present in both (NCI/NTP and literature) parts of the CPDB showed that the correlation of quantitative data is similar to qualitative classifications, rather low (r 2 = 0.63; Figure 2). This comparison may underestimate the reproducibility of carcinogenicity experiments because, as mentioned several times, only NTP/NCI experiments were conducted with a standardized protocol. Among chemicals positive in both species (NCI/NTP, 16, literature, 6), the experiments on rats are not only more reproducible but also much more sensitive than tests on mice. These results are in accordance with calculations on the whole CPDB, carried out by Gold and Zeiger (2). Furthermore, in the NCI/NTP part, the most potent TD50 values were much lower for rats, in contrast to the results in the literature part, where the TD50 values for mice were more potent (Table 9). Mutagenicity effects. Mutations are one of the most important mechanisms in chemical carcinogenesis (4,11). The Salmonella mammalian microsome mutagenicity (Ames) test was designed to measure mutations using several strains of the Salmonella typhimurium (12). It is well known from the literature that the Salmonella assay identifies a high proportion of carcinogenic chemicals, but a number of carcinogens lack mutagenic potential in
•
Reproducibility of rodent carcinogenicity experiments
this assay. Trying to identify the nongenotoxic chemicals with carcinogenic potential represents a major unsolved problem, which shows that rodent carcinogenicity tests cannot, at present, be replaced by the Salmonella assay or other short-term tests. For our comparisons we used the Ames test evaluation from Gold and Zeiger (2). The number of compounds occurring in NCI/NTP and literature with additional mutagenicity data was too small for calculations; therefore, we used data from the larger non-overlapping sets. Mutagenicity data were available for 178 chemicals from the NCI/NTP part and for 272 compounds from the literature part. In both subsets the majority of carcinogenic compounds was also mutagenic; 57% (102/178) of the chemicals in the NCI/NTP experiments and 64% (173/272) in the literature investigations were Ames positive. The majority of noncarcinogenic compounds gave negative results in the Salmonella assay (119/169 NCI/NTP, 94/149 literature; Table 10). For further analysis we used only the NCI/NTP data set because only these experiments were conducted under standardized conditions. We tried to determine if mutagenicity data can be used to identify multispecies carcinogens and multicategory carcinogens. The data from the NCI/NTP showed that the majority of one-category carcinogens (52%; 44/85) as well as one-species carcinogens (55%; 54/98) were Ames negative, whereas the majority of multicategory carcinogens (66%; 61/93) and two-species carcinogens (73%; 58/80) were Ames positive (Table 11). This analysis confirms that genotoxic carcinogens are generally characterized by an ability to cause tumors in multiple species and at multiple sites (13,14) whereas nongenotoxic agents tend to exhibit tissue- and
Table 7. A comparison of one-category and multicategory carcinogens in the NCI/NTP and literature parts of the CPDB. One categorya
Two categoriesb
Literature
5 7 12
9 12 21
14 19 33
One categorya Two categoriesb NCI/NTP
Concordant classification: 17 compounds (52%); discordant classification: 16 compounds (48%). aCompounds are carcinogenic in one tissue category. bCompounds are carcinogenic in more than one tissue category.
Table 8. A comparison of one- and two-species carcinogens and one- and multicategory carcinogens in the NCI/NTP and literature parts of the CPDB. One/onea One/multib Two/onec Two/multid NCI/NTP
One/onea
One/multib
Two/onec
2 4 1 2 9
4 3 0 0 7
2 1 0 0 3
Two/multid
species-specific carcinogenicity (Table 11) (4,13,15). Results of the Salmonella test are therefore important for identifying human carcinogens and to the development of SAR models. The high probability of inducing carcinogenic effects in multiple species is also demonstrated by the majority of chemicals that have been shown to cause human cancers (11).
Discussion The main observation of our investigation was an unexpected large discordance between experimental results from the NCI/NTP and the literature parts of the CPDB. This leads to two conclusions. First, differences in experimental protocols of the NCI/NTP and literature parts have led to discordant results. NCI/NTP experiments were performed under standardized conditions, but in the literature, experimental protocols vary considerably [although they must meet quality criteria for inclusion in the CPDB (2)]. Some chemicals have been tested in the literature part only with one sex of one species, while others have multiple tests that include both sexes and several strains of rats and mice. Additionally, the number of doses, the range of doses, the administration route, and the group size may vary. Thus, different experimental protocols and missing and additional experiments may be the reason for the low concordance between both parts of the CPDB. We were able to demonstrate, however, that the inclusion of more (species, sex, strain, organ) specific information did not improve the reproducibility of the results. This may be taken as an indication that rodent carcinogenicity assays are, in general, poorly reproducible. This is in clear contradiction to earlier results obtained by Gold et al. (16), where an overall reproducibility of 93% (rats) and 76% (mice) was estimated. That investigation was based on replicate experiments of 38 compounds with hamsters, rats, and mice published in the general 10 ● ● ●
● ●● ● ● ● ● ● ●● ● ● ● ● ● ●● ● ●● ●●● ● ● ● ● ● ● ●● ● ● ● ● ●● ● ● ● ●
5
log TD50 LIT
Articles
0
Literature –5
5 3 0 6 14
13 11 1 8 33
Concordant classification: 11 compounds (33%); discordant classification: 22 compounds (67%). aCompounds are one-species carcinogens and one-category carcinogens. bCompounds are one-species carcinogens and multicategory carcinogens. cCompounds are two-species carcinogens and one-category carcinogens. dCompounds are two-species carcinogens and multicategory carcinogens.
Environmental Health Perspectives
• VOLUME 109 | NUMBER 5 | May 2001
●
–10 –15
–10
–5
0
5
10
log TD50 NTP/NCI
Figure 2. Correlation of carcinogenicity TD50 values from the NTP/NCI and the literature (LIT) part of the CPDB (r 2 = 0.63).
513
Articles
•
Gottmann et al.
literature. Looking for an explanation for the discordance with our results, we realized that from 47 concordant experiments (sex, administration route, and target organs were considered; therefore, the number of experiments is larger than the number of compounds) with rats and mice listed by Gold et al. (16), 34 results were published by the same authors. This may have led to a bias towards identical results, but it may be also an indicator of the importance of strict experimental protocols for reproducibility. In addition, the results may differ for statistical reasons caused by the different data sets (size and selection of compounds). Based on our data, it is currently impossible to decide between these two explanations, but it seems that the reliability of rodent carcinogenicity assays was overestimated in previous investigations. To clarify this point, it will be necessary to compare a sufficient number of results from standardized assays, which are not publicly available at this time. Until then, results from rodent carcinogenicity assays should be treated as unreliable, which has consequences for SAR modelers and the risk assessment process. SAR models for carcinogenicity are based on rather poor biologic data. The accuracy of these SARs is therefore much lower than for other end points. It is interesting to note that experiments with rats are more reproducible
than those with mice. It is therefore prudent to develop species-specific SAR models. The inclusion of more specific (e.g., target organs) information may make sense from a biologic viewpoint, but this data set is very unreliable and may reduce the overall performance of the SAR model. We assume that data from standardized tests are more reliable than that from nonstandardized sources. When adding data from nonstandardized sources to standardized ones (e.g., NCI/NTP), it should be therefore carefully considered whether the increased amount of data outweighs the additional variability introduced by data from different sources. As mutagenicity is a good indicator, especially for multispecies and multisite carcinogens, this information should be used in SAR studies. An important direction for further research is to find methods to incorporate uncertainty indicators in SAR models and to adequately report the limitations of the derived models. In risk assessment, the consequences of poor data quality are even more pronounced. We were able to demonstrate that it is not only hard to identify carcinogens in general, but also to identify powerful multispecies and multiorgan carcinogens reliably. Especially in this area, highly relevant to public health and economy, improved quality assurance methods for biologic assays are urgently needed. Furthermore, the uncertainty of biologic
Table 9. A comparison of the most potent TD50 values (medians) for those chemicals classified as carcinogens in the NCI/NTP and literature parts of the CPDB. Data set
All
NCI/NTP Literature
6.478 50.750
Rats Males
Females
All
Mice Males
Females
7.420 70.630
32.950 20.680
54.100 28.600
29.400 15.070
2.365 161.400
information should be adequately considered in the risk assessment process. Summarizing our experience with data quality in predictive toxicology, we conclude that biologic data are much less reliable than chemical data (1). It is impossible to evaluate the quality of standardized rodent carcinogenicity experiments, but results from the general literature have only a poor concordance with results from the NTP. An independent assessment of standardized carcinogenicity assays (e.g., in a round-robin test) is urgently needed to estimate the real reproducibility of these tests. We hope that this paper raises awareness about data quality issues and its implications in predictive toxicology and risk assessment. REFERENCES AND NOTES 1.
2. 3. 4.
5.
6.
7.
8. 9.
Table 10. The distribution of mutagens and nonmutagens on carcinogens and noncarcinogens in the NCI/NTP and literature parts of the CPDB. Data set
Classification
Mutagens
Nonmutagens
NCI/NTP NCI/NTP Literature Literature
Carcinogens Noncarcinogens Carcinogens Noncarcinogens
57% (102/178) 30% (50/169) 64% (173/272) 37% (55/149)
43% (76/178) 70% (119/169) 36% (99/272) 63% (94/149)
Table 11. The distribution of mutagens and nonmutagens on carcinogens and noncarcinogens in the NCI/NTP and literature parts of the CPDB. One-species carcinogensa One-category carcinogensb Two-species carcinogensc Multicategory carcinogensd aCompounds cCompounds
Mutagenicity
No. of compounds
Percentage
Yes No Yes No Yes No Yes No
44/98 54/98 41/85 44/85 58/80 22/80 61/93 32/93
45 55 48 52 73 27 66 34
are carcinogenic in one species (mouse or rat). bCompounds are carcinogenic in one tissue category. are carcinogenic in both species (mouse and rat). dCompounds are carcinogenic in more than one tissue
category.
514
VOLUME
10.
11.
12.
13.
14.
15.
16.
Helma C, Kramer S, Pfahringer B, Gottmann E. Data quality in predictive toxicology: identification of chemical structures and calculation of chemical properties. Environ Health Perspect 108:1029–1033 (2000). Gold LS, Zeiger E. Handbook of Carcinogenic Potency and Genotoxicity Databases. Boca Raton, FL:CRC Press, 1997. Available: ftp://helma.informatik.uni-freiburg.de/ pub/data/cpdb/ [last update 18 May 2000]. Ashby J, Tennant RW. Definitive relationships among chemical structure, carcinogenicity and mutagenicity for 301 chemicals tested by the U.S. NTP. Mutat Res 257:229–306 (1991). Peto R, Pike MC, Bernstein ML, Gold LS, Ames BN. The TD50: a proposed general convention for the numerical description of the carcinogenic potency of chemicals in chronic-exposure animal experiments. Environ Health Perspect 58:1–8 (1984). Sawyer S, Peto R, Bernstein L, Pike MC. Calculation of carcinogenic potency from long-term animal carcinogenesis experiments. Biometrics 40:27–40 (1984). Bowen DL, Byrd L, Pereira FCN, Pereira LM, Warren DHD. Sicstus Prolog 3.8.5 User’s Manual. Available: http://www.sics.se/isl/sicstus.html [cited 29 March 2001]. Holley JW, Guilford JP. A note on the G-Index of agreement. Educ Psychol Meas 24:749–753 (1964). Bortz J, Lienert GA, Boehnke K. Verteilungsfreie Methoden in der Biostatistik. Berlin:Springer, 1990. Evans JS, Gray GM, Sielken RL Jr, Smith AE, ValdezFlores D, Graham JD. Use of probabilistic expert judgement in uncertainty analysis of carcinogenic potency. Regul Toxicol Pharmacol 20:15–36 (1994). Tennant RW, Zeiger E. Genetic toxicology: current status of methods of carcinogen identification. Environ Health Perspect 100:307–315 (1993). Ames BN, Durston WE, Yamasaki E, Lee FD. Carcinogens are mutagens: a simple test system combining liver homogenates for activation and bacteria for detection. Proc Natl Acad Sci USA 70:2281–2285 (1973). AshbyJ, Tennant RW. Chemical structure, Salmonella mutagenicity and extent of carcinogenicity as indicators of genotoxic carcinogenesis among 222 chemicals tested in rodents by the U.S. NCI/NTP. Mutat Res 204:17–115 (1988). Ashby J, Tennant RW, Zeiger E, Stasiewicz S. Classification according to chemical structure, mutagenicity to Salmonella and level of carcinogenicity of a further 42 chemicals tested for carcinogenicity by the U.S. National Toxicology Program. Mutat Res 223:73–103 (1989). Tennant RW, Stasiewicz S, Spalding JW. Comparison of multiple parameters of rodent carcinogenicity and in vitro genetic toxicity. Environ Mutagen 8:205–227 (1986). Gold LS, Wright C, Bernstein L, de Veciana M. Reproducibility of results in near-replicate carcinogenesis bioassays. J Natl Cancer Inst 78:1149–1158 (1987).
109 | NUMBER 5 | May 2001 • Environmental Health Perspectives