2020
IEEE GEOSCIENCE AND REMOTE SENSING LETTERS, VOL. 11, NO. 11, NOVEMBER 2014
Data Sharing and Data Set Application of Watershed Allied Telemetry Experimental Research Liangxu Wang, Shuguo Wang, and Youhua Ran
Abstract—The Heihe Watershed Allied Telemetry Experimental Research (WATER) (HiWATER) experiment is currently being conducted in the Heihe River Basin in China. Its predecessor experiment, the WATER project, was conducted in the same river basin from 2007 to 2010. As an interdisciplinary, intensive, coordinated, and multiscale experiment, WATER produced data that ranged from remote sensing observations to field campaign measurements. These data, which comprise a total of 2.1 TB contained in 255 data sets, were released on the WATER data Web site in July 2010. This letter provides an overview of the WATER data repository, the major data sets, and some data examples. The WATER Information System (WIS), which enables the user community to explore and to order the data in a simple manner, was designed. The data acquisition records indicate that the WATER data sets have received extensive attention and demonstrate that WIS works effectively. Numerous scientific applications have been achieved with the aid of WATER data collection, and some of these applications have revealed that the availability of complete high-quality data produced from a large-scale experiment can provide substantial support to studies of ecohydrological processes and remote sensing and also aid the development of watershed sciences. HiWATER will use the data information system developed during WATER to make it freely available to international scientific communities. Index Terms—Data set, experiment, Heihe River Basin (HRB), remote sensing, Watershed Allied Telemetry Experimental Research (WATER).
I. I NTRODUCTION
I
N THE earth sciences, tremendous volumes of data, ranging from model simulations to remote sensing observations for long-term global/continental-scale Earth system monitoring and investigations, have been delivered, archived, and integrated over the last three decades [1], [2]. Simultaneously, intensive field campaigns and comprehensive in situ measurements, such as the Global Energy and Water Exchanges, the Cold Land Processes Field Experiment [3], and the First International Satellite Land Surface Climatology Project Field Experiment [4], have also yielded a data-rich environment that researchers worldwide can use to perform short-term research studies and applications at regional and local scales.
Manuscript received January 26, 2014; revised March 24, 2014; accepted April 16, 2014. This work was supported in part by the National Natural Science Foundation of China under Grant 91125001 and the Chinese Academy of Sciences Action Plan for West Development Program under Grant KZCX2XB3-15. The authors are with the Cold and Arid Regions Environmental and Engineering Research Institute, Chinese Academy of Sciences, Lanzhou 730000, China (e-mail:
[email protected];
[email protected];
[email protected]). Color versions of one or more of the figures in this paper are available online at http://ieeexplore.ieee.org. Digital Object Identifier 10.1109/LGRS.2014.2319301
The Watershed Allied Telemetry Experimental Research (WATER) project was a watershed-scale comprehensive remote sensing observation experiment that was performed from 2007 to 2010 in the Heihe River Basin (HRB), which is the second largest inland river basin in northwestern China. WATER was the predecessor of the Heihe WATER (HiWATER) [5]. This experiment collected multiscale observations using multiple platforms (airborne, satellite borne, and ground based) [6]– [8]. Because of the unique challenges that are associated with ecohydrological observations in cold and arid regions, WATER was conducted in three key experimental areas (KEAs) based on the distinct land surface characteristics of the different areas in the HRB; these areas included a cold region, a forest region, and an arid region. In addition, a hydrometeorology observation network was established and coordinated across the whole river basin. Within each KEA, foci experimental areas (FEAs) and elementary sampling plots were identified to collect ground-truth data on multiple spatial and temporal scales. This collection was performed using ground-based remote sensing instruments, a densified network of automatic meteorological stations, flux towers, and hydrological stations [6]. Intensive observation periods (IOPs) of WATER were conducted in 2008 from March 7 to April 12, from May 15 to July 22, and from August 23 to September 5. In total, 25 airborne missions were flown; the payloads included L-, K-, and Ka-band microwave radiometers, an imaging spectrometer, a thermal imager, a charge-coupled device, and a Light Detection and Ranging (LiDAR) system. A variety of satellite data were also collected. Because WATER and the data collected in this experiment laid the foundation for the execution of HiWATER, it is of great importance to share information about the WATER data sets. Thus, the primary goal of this letter is to introduce the data sets acquired during the WATER project; we also describe the data dissemination platform and highlight several research projects to demonstrate example applications of the WATER data. Our motivation is to help the user community learn more about the data that were collected during the WATER experiment, to demonstrate what data can be used, and to describe where users can find these data; this knowledge is necessary for those who plan to obtain data from WATER and to use the data in their research. II. S UMMARY OF THE WATER DATA R EPOSITORY To acquire a complete high-quality integrated watershed data set in a standard format and to make these data available to worldwide users were two of the primary goals that were considered during the implementation of WATER. In July 2010,
1545-598X © 2014 IEEE. Personal use is permitted, but republication/redistribution requires IEEE permission. See http://www.ieee.org/publications_standards/publications/rights/index.html for more information.
WANG et al.: DATA SHARING AND DATA SET APPLICATION OF WATER
2021
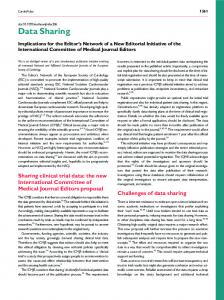
TABLE I R ELEASED WATER DATA S ETS
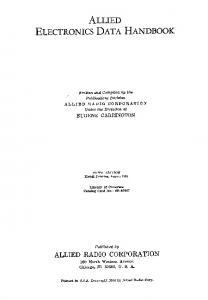
Fig. 1. Overall framework of WIS.
after the IOPs and two years of metadata and documentation preparation, standard data processing, and rigorous data quality control, the data collected in WATER were released online [9]. Two languages are now supported: The Chinese version is hosted at http://westdc.westgis.ac.cn/water, and the English version is hosted at http://card.westgis.ac.cn/. The data products were processed at three levels, which are denoted by Level 0, Level 1, and Level 2. Level 0 products are raw data; there are 3.2 TB of Level 0 data. The Level 1 data were preprocessed with standard formats, and the Level 2 products were converted into more useful parameters and formats. The released data sets that include Level 1 and Level 2 products total approximately 2.1 TB of storage space. Data quality control was performed for all data sets in multiple ways, including the adoption of uniform observation specification, data standardization processing, and data quality evaluation [10], [11]. Each data product is described using metadata so that users can learn about the data and to increase the usability of the data. At present, 255 data sets can be accessed. The data sets contain the data that were collected in the preobservation periods, the IOPs, and the persistent observation periods. There are 26 data sets from airborne missions, including 9 microwave radiometer data sets, 8 Wide-angle infrared Dual-mode line/area Array Scanner (WiDAS) data sets [12], 5 imaging spectrometer data sets, and 4 LiDAR data sets. Satellite images are stored in 15 data sets. Regarding ground measurements, 69 data sets contain data from the cold region hydrology experiment, 21 data sets contain data from the forest hydrology experiment, and the arid region hydrology experiment produced 95 data sets. In addition, there are also 29 data sets that are relevant to the hydrometeorology experiment. Table I summarizes the size and quantity of that WATER data sets in terms of the data collection regions and other observation themes. III. WIS AND A DATA E XAMPLE A. Functionalities of WIS Data management includes the software and the hardware that are used to facilitate the archival, preservation, and exploration of data [13], [14]. Guided by this principle, WATER Information System (WIS) was created using geographic metadata technology to assist Web-based data access. WIS employs the PostgreSQL database with the PHP5 Web scripting
language and incorporates the open-source geographic catalog application GeoNetwork as a metadata editor; this system stores the data sets, publications, and documents that were produced from the experiments. There are six subsystems in WIS to establish a congenial loop to serve data management, publishing, and sharing functions; the system also supports joint interdisciplinary research, including a data assembling system, a data publishing system, a data discovery system, a data sharing system, a data mining system, and a feedback solicitation system. As illustrated in Fig. 1, once WATER participants contribute data to the WIS data pool, the WATER committee can publish the data to allow the user community to explore and access the data. With this system, users can further perform data mining and knowledge discovery. Meanwhile, users can also provide direct feedback about the data set via comments or by citing the data in publications. Because good metadata help users retrieve archived data more quickly and easily, thorough metadata are required. Furthermore, it is recommended that each data producer prepares accompanying documentation for each data set. To this end, WIS offers the possibility of creating and editing metadata through the integration of GeoNetwork. Metadata can be created by filling in a metadata template or by revising an existing metadata file. In addition, a metadata editing log can be recorded. A peer-review process for publishing metadata is also used to improve the quality and completeness of the metadata. Each data set in WIS is registered with a digital object identifier (DOI) to assist data users in citing the data in their publications, to encourage data contributors to share their data in WIS, and to document the contributions from data surveyors and producers. Data are stored in two forms in WIS. One form is online data that are ready for open access, which requires nothing except a registered account. This type of data can be instantly downloaded from the Web site via an FTP address with a temporary user name and password. The other type of data is offline data; to use this type of data, the user must submit a data request to the data committee of WATER through WIS. The request is then evaluated according to our data restrictions and regulations. This type of data access requires the user to provide a signed user license agreement. If the application is permitted, the user receives an email that includes an FTP address with a credential, and the user can use any FTP client to access the requested data. The extraction of useful knowledge from the data sets published in WIS and in the corresponding literature is another expected outcome of this information system. In WIS, each data set is connected with others, which helps users find additional
2022
IEEE GEOSCIENCE AND REMOTE SENSING LETTERS, VOL. 11, NO. 11, NOVEMBER 2014
TABLE II ACQUISITION S TATISTICS FOR THE WATER DATA S ETS
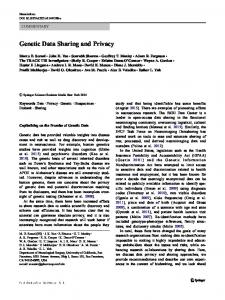
Fig. 2. Example of the detailed description of a WATER data set (DOI: 10.3972/water973.0137.db).
related data sets. Data sets are also linked with literature that concerns similar research topics; this linking feature helps users find relevant knowledge. The literature can be sourced from a cyberscholar database, such as Google Scholar. In addition, data sets can also be associated with Web pages using a Web search engine, such as Google; this feature is beneficial for users to gain more relevant knowledge from the Internet. B. WATER Data Example To better fulfill the requirements of various aspects of scientific applications, the different categories and multiple spatial and temporal scales of the data collected in WATER were principally organized and presented in the data dissemination platform with coarse granularity. In this case, a simultaneous ground-truth measurement, a specific field campaign topic, or a continuous measurement for one or a set of parameters/ variables was filed as an individual data set together with the metadata. For instance, Fig. 2 is a layout that was snipped from the WIS Web page that displays a “data set of leaf area index (LAI) measurements in the Yingke oasis and Huazhaizi desert steppe FEAs” (DOI:10.3972/water973.0137.db). The information presented in the snippet includes all the necessary and useful information about the data set. As can be observed from Fig. 2, the top of the page is the title of the data set, and this is followed by the abstract and a thumbnail. The abstract describes the number and types of parameters collected, the data collection time and place, and any issues, such as instrumentation, calibration, and
quality control problems. If one data set is of inferior quality, it is explicitly stated in the metadata abstract. Below the abstract are some materials that are related to the literature, such as the recommended citation and related publications. Next, the limitations of using the data set and the funding information are provided. The bottom of the page shows some useful links, such as related data sets and literature. The right panel shows the category, place, temporal and theme keywords, the DOI, and the download button for the data set. In addition, each keyword may link a user to another Web page that displays all the content that is related to that keyword. Other information, including the volume of data, the provenance of the data set, and the number of hits received, whether the data use an online or an offline sharing method, is also provided. If a user has further questions, a contact point listed at the bottom right can be helpful. Finally, the metadata can be downloaded by clicking the button at the bottom right. In summary, all the necessary information for a data set can be delivered; this information increases the readability and applicability of the data. The aforementioned data example demonstrates how we define data granularity and what materials are included within a data set in the WIS; other WATER data sets are organized similarly. Moreover, this example demonstrates that, by using this manner of data organization, we can adhere to the principle of keeping the system simple and flexible enough to be used, which can increase the data viability and accommodate the needs of unanticipated users and a wide variety of scientific applications in the future. C. Most User-Focused Data Sets in WIS The WATER data collection received extensive attention worldwide soon after its release. From the data publication to 2013, 255 data sets were acquired 1437 times. In total, 17.6 TB of data were downloaded by 309 users from 134 organizations and institutions. Moreover, 153 data sets were cited 627 times by 103 Chinese journal articles and 97 English journal articles. The acquisitions included every aspect of the observed outcomes in WATER. Table II presents download statistics for the WATER data sets. These statistics demonstrate the importance of sharing the WATER data collection: Making the data available to a wider user community is greatly appreciated. Furthermore, WIS has been demonstrated to work effectively.
WANG et al.: DATA SHARING AND DATA SET APPLICATION OF WATER
2023
the heterogeneous landscape of the HRB [18]. In these studies, the canopy heights were obtained using the differences between the digital surface model and digital elevation model that were derived from high-resolution airborne LiDAR observations. C. Applications of Airborne WiDAS Data Sets
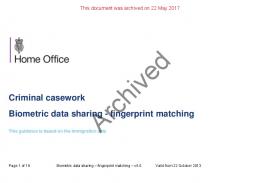
Fig. 3.
Tag cloud diagram showing the most common concern terms.
The meteorological data sets have received the most acquisitions. By analyzing the results of the data of interest in WIS, a tag cloud diagram demonstrates which categories of observations have attracted the most data users and potentially have received the most orders. Fig. 3 indicates that the keywords “soil water content,” “meteorology and hydrology,” and “ground-based synchronous observation” are the most frequent concern terms. IV. DATA A PPLICATION H IGHLIGHTS It is known that one of the decisive measures of success for an experiment and a data information system is the scientific application of the data. This section highlights some case studies that have used WATER data sets and demonstrates that the data collected in a comprehensive experiment can positively support the development of integrated ecohydrological research and model improvement and validation in the fields of hydrology, ecology, and quantitative remote sensing [15]. A. Applications of Hydrometeorology Data Sets With the assistance of multiscale hydrometeorology data sets, interesting results have been published. Liu et al. [16] analyzed the seasonal variations in the energy balance components based on the eddy-covariance and large-aperture scintillometer (LAS) data sets from three meteorological observation stations obtained during the WATER experiment. Moreover, Tang et al. [17] developed a new algorithm that integrates the surface temperature-vegetation index triangle method to quantitatively determine the combined-effect parameter, which is important for calculating latent heat fluxes. This algorithm uses LAS observations that were obtained in the Linze grassland and from the Moderate Resolution Imaging Spectroradiometer data products. This algorithm also provides a practical method for estimating the surface net radiation, soil heat fluxes, evaporative fraction, and evapotranspiration (ET) at the regional scale. B. Applications of Airborne LiDAR Data Sets Airborne LiDAR observations were utilized for several applications, including feature analysis, decomposition of waveforms, estimation of forest and crop structure parameters and forest biomass, land cover classification, and determination of the zero-plane displacement height and aerodynamic roughness length. In particular, for ET estimation, an investigation was performed to explore the use of imaging LiDAR measurements for the estimation of the aerodynamic roughness length over
Multitemporal airborne WiDAS observations, which are an important component of the WATER data repository, can provide a multiangular record of surface radiation, which can be used to extract parameters such as the surface albedo, vegetation fraction, LAI, and land surface component temperature. This information makes it possible to enhance surface energy balance studies, particularly to improve the estimation accuracy of ET. For example, using WiDAS data sets, a new algorithm was developed to separate vegetation and soil temperatures. This algorithm was based on the localized correlation between multiangular observations in the visible and near-infrared and thermal infrared bands. The validation of the results demonstrated that the retrieved results reflected the spatial and temporal distribution of the surface component temperatures [12]. V. C ONCLUSION The lack of high-quality multiscale observations in cold and arid regions, both remotely sensed and in situ, has limited the integrated study of ecohydrological processes at various watershed scales. WATER, which is a multiscale, interdisciplinary, and well-coordinated experiment, has delivered reliable data sets for the development, improvement, and verification of remote sensing methods, land surface models, and integrated watershed models. As one of the core missions and achievements of WATER, a plethora of data has been collected using multiple platforms. These data have enabled a variety of dedicated and novel retrieval investigations related to ecohydrological parameters, e.g., snow properties, soil moisture, ET, and land surface temperature. Moreover, the data acquired in WATER, including the Level 1 and Level 2 data, which require 2.1 TB of storage, were released in WIS. The way in which the data are organized has also been illustrated, and the data from HiWATER are organized in the same way. This data dissemination platform enables the user community to explore and organize the data simply and flexibly enough to meet various data application requirements. The WATER data sets have received extensive attention, and the data acquisition records document the effectiveness of WIS. The HiWATER data sets are being published and shared in the same framework, which could improve the dissemination of HiWATER data. Overall, the wide application of the WATER data sets demonstrates that the data acquired from this experiment have supported a series of ecological, hydrological, and remote sensing research efforts. The highlighted studies also demonstrate that, as a large-scale remote sensing experiment, WATER successfully recorded basic observational data and facilitated ecohydrological process research at various scales because of the completeness and high quality of the data sets. We invite international scientists to use the WATER data.
2024
IEEE GEOSCIENCE AND REMOTE SENSING LETTERS, VOL. 11, NO. 11, NOVEMBER 2014
ACKNOWLEDGMENT The authors would like to thank more than 280 individuals who participated in the data set collection during the WATER preobservation periods and intensive observation periods. The authors would also like to thank the editors and anonymous reviewers for the generous help in revising this letter. R EFERENCES [1] C. Tilmes, Y. Yesha, and M. Halem, “Tracking provenance of earth science data,” Earth Sci. Inf., vol. 3, no. 1/2, pp. 59–65, 2010. [2] H. Ramapriyan, J. Moses, and R. Duerr, “Preservation of data for earth system science—Towards a content standard,” in Proc. IEEE IGARSS, 2012, pp. 5304–5307. [3] M. A. Parsons, M. J. Brodzik, and N. J. Rutter, “Data management for the cold land processes experiment: Improving hydrological science,” Hydrol. Process., vol. 18, no. 18, pp. 3637–3653, Dec. 2004. [4] P. J. Sellers, F. G. Hall, G. Asrar, D. E. Strebel, and R. E. Murphy, “The First ISLSCP Field Experiment (FIFE),” Bull. Amer. Meteorol. Soc., vol. 69, no. 1, pp. 22–27, Nov. 1988. [5] X. Li et al., “Heihe Watershed Allied Telemetry Experimental Research (HiWATER): Scientific objectives and experimental design,” Bull. Amer. Meteorol. Soc., vol. 94, no. 8, pp. 1145–1160, Aug. 2013. [6] X. Li et al., “Watershed Allied Telemetry Experimental Research,” J. Geophys. Res.: Atmos., vol. 114, no. D22103, 2009. doi:10.1029/ 2008JD011590. [7] X. Li, X. Li, K. Roth, M. Menenti, and W. Wagner, “Preface ‘observing and modeling the catchment scale water cycle’,” Hydrol. Earth Syst. Sci., vol. 15, no. 2, pp. 597–601, 2011. [8] X. Li, Z. Su, and B. Wu, “Retrieval of key eco-hydrological parameters for cold and arid regions,” Int. J. Appl. Earth Observ. Geoinf., vol. 17, pp. 1–2, 2012.
[9] L. Wu et al., “Data management and its sharing application of Watershed Allied Telemetry Experimental Research,” Remote Sens. Technol. Appl., vol. 25, no. 6, pp. 772–781, 2010. [10] M. Ma, “Quality control and evaluation for the ground observation data of the Watershed Allied Telemetry Experimental Research,” Remote Sens. Technol. Appl., vol. 25, no. 6, pp. 766–771, 2010. [11] G. Huang, M. Ma, J. Tan, and Z. Zhang, “Data quality control and products of automatic weather stations for Watershed Allied Telemetry Experimental Research,” Remote Sens. Technol. Appl., vol. 25, no. 6, pp. 814–820, 2010. [12] Q. Liu, C. Yan, Q. Xiao, G. Yan, and L. Fang, “Separating vegetation and soil temperature using airborne multiangular remote sensing image data,” In. J. Appli. Earth Observ. Geoinf., vol. 17, pp. 66–75, 2012. [13] R. J. Olson, J. M. Briggs, J. H. Porter, G. R. Mah, and S. G. Stafford, “Managing data from multiple disciplines, scales, sites to support synthesis and modeling,” Remote Sens. Environ., vol. 70, no. 1, pp. 99–107, 1999. [14] X. Li et al., “Toward an improved data stewardship and service for environmental and ecological science data in West China,” Int. J. Digital Earth, vol. 4, no. 4, pp. 347–359, 2011. [15] X. Li et al., “The progresses on the Watershed Allied Telemetry Experimental Research (WATER): Remote sensing of key hydrological and ecological parameters,” Remote Sens. Technol. Appl., vol. 27, no. 5, pp. 650–662, 2012. [16] S. Liu et al., “A comparison of eddy-covariance and large aperture scintillometer measurements with respect to the energy balance closure problem,” Hydrol. Earth Syst. Sci., vol. 15, no. 4, pp. 1291–1306, 2011. [17] R. Tang, Z. Li, and B. Tang, “An application of the Ts-VI triangle method with enhanced edges determination for evapotranspiration estimation from MODIS data in arid and semi-arid regions: Implementation and validation,” Remote Sens. Environ., vol. 114, no. 3, pp. 540–551, 2010. [18] J. Colin and R. Faivre, “Aerodynamic roughness length estimation from very high-resolution imaging LIDAR observations over the Heihe basin in China,” Hydrol. Earth Syst. Sci., vol. 14, no. 12, pp. 2661–2669, 2010.