Octavia Wong, York University. C.M. Wong, York University ..... coefficients in the square root scale (Gelman & Hill,. 2007). Indeed, such linearizing and variance ...
A peer-reviewed electronic journal. Copyright is retained by the first or sole author, who grants right of first publication to Practical Assessment, Research & Evaluation. Permission is granted to distribute this article for nonprofit, educational purposes if it is copied in its entirety and the journal is credited. PARE has the right to authorize third party reproduction of this article in print, electronic and database forms. Volume 22 Number 9, October 2017
ISSN 1531-7714
Data Transformations for Inference with Linear Regression: Clarifications and Recommendations Jolynn Pek, The Ohio State University Octavia Wong, York University C.M. Wong, York University Data transformations have been promoted as a popular and easy-to-implement remedy to address the assumption of normally distributed errors (in the population) in linear regression. However, the application of data transformations introduces non-ignorable complexities which should be fully appreciated before their implementation. This paper adds to existing Practical Research and Assessment Evaluation (PARE) publications on data transformations by providing a broad overview underlying the use of data transformations for the specific purpose of statistical inference and interpreting meaningful effect sizes. Data transformations not only potentially change the scale of the transformed variable; they also alter the fundamental relationships among variables while simultaneously changing the distribution of the errors. Given these repercussions, we clarify the nature of certain data transformations and strongly recommend the use of data transformations when they can enhance the interpretation of effect sizes. Data transformations are an important and popular tool in data analysis for addressing various practical issues. Indeed, Practical Assessment, Research and Evaluation (PARE) published a series of highly cited papers by Osborne and colleagues (Osborne, 2002, 2010; Osborne & Overbay, 2004) on the use of various forms of data transformations. Because data are typically non-normally distributed in practice (Cain, Zhang & Yuan, 2016; Micceri, 1989), these PARE papers focus on the utility of data transformations such that analyses which purport to require the assumption of normally distributed data, subsumed under linear regression (e.g., t-tests and ANOVA), would be expected to become more valid. Different classes of data transformations were developed from distinct modeling cultures of either statistical prediction or statistical inference (see Breiman (2001) for an overview of these two cultures). Given data, a model can be constructed to link predictors with an outcome for the purpose of statistically predicting
future outcomes. For instance, a meteorologist would devise a model using current data on humidity, temperature, wind speeds, and other variables for a particular location to predict the expected amount of rainfall in the next hour at the same location. In this context of pure prediction, there is no interest in whether humidity has a linear effect on rainfall or whether the predictors in the model interact, etc. in the population. Conversely, sample data can be modeled with the goal of extracting information about the relationship between predictors and an outcome for inferences about the population. For instance, a clinical psychologist designs an experiment to examine the efficacy of loving-kindness meditation on depression relative to treatment-as-usual so as to estimate the treatment difference or effect size. An effect size is a quantification (i.e., size) of the impact (i.e., effect) of a predictor on an outcome. Here, information based on sample data is reduced to an effect size which is used to
Practical Assessment, Research & Evaluation, Vol 22 No 9 Pek, Wong, & Wong, Data Transformations for Inference make inferences about the relative effectiveness of loving-kindness meditation in the population via constructing confidence intervals (CIs) or conducting null hypothesis significance tests (NHSTs). In the context of statistical inference, there would be interest in whether the relative efficacy of treatment can be moderated or mediated by other variables and whether such relationships are present in the population. Between these two modeling traditions, the majority of psychological science and evidence-based practice has focused on statistical inference which emphasizes the interpretation of effect sizes and their statistical significance or estimate precision. Here, both the meaningfulness of the effect under study and its presence in the population are of key importance. The purpose of this paper is to complement the existing papers in PARE on data transformations by providing a broad overview on the rationale and utility of data transformations for the purpose of statistical inference. We illustrate distinct properties of data transformations in the context of data non-normality in relation to assumptions of linear regression and the central limit theorem (CLT) such that researchers can make informed decisions regarding their application. In essence, we emphasize that data transformations developed from the culture of statistical prediction should not be naively applied to applications focused on statistical inference, especially when interest is in interpreting effect size estimates and determining their presence in the population with NHSTs or CIs. The misapplication of data transformations will introduce complexities with non-ignorable repercussions. In particular, we show that transformations may not appropriately address the assumption of normality for statistical inference, and can more gravely change the research question in that the population effect size of initial interest does not map onto the resulting population effect size of the transformed data. Stated differently, the nature of the effect size based on the transformed data (even after reverse transforming) can be quite different from the nature of the effect size based on the original data. Note that effect sizes are accompanied by p-values associated with conducting NHSTs and CIs; changes in effect size estimates due to data transformations will result in changes in NHST results and CI coverage. Additionally, we review and illustrate three popular data transformations (logarithmic, square root, and reciprocal) in facilitating the interpretation of effect
Page 2 sizes. Finally, we make recommendations for the proper use of data transformations for statistical inference. Are Transformations Pertinent to Data Analysis? To set the stage and introduce notation, consider linear regression as a general analytic framework where t-tests and ANOVA are special cases. Our discussion of transformations is thus relevant to this set of statistical approaches. In the context of statistical inference, the regression model serves as a simplified description of the phenomenon of interest inherent in the data (i.e., the signal or model), free from random error (i.e., noise or residual). For a single case i = 1,… N, the regression equation can be written as Yi = β0 + β1X1i + … + βKXKi + εi,
(1)
where Yi is the observed value for the dependent variable (DV) for case i; Xki is an observed value on the kth independent variable for case i of k = 1, …, K independent variables; and εi is the unknown error for case i. The unknown parameters of the model (in the population) are β0, the intercept or predicted value of Y when all Xk are 0, and the K regression slopes where the kth regression slope is denoted as βk. The K βk are usually effect sizes of interest (e.g., see Pek & Flora, 2017), representing the conditional change in Y due to a 1-unit change in Xk. When Xk is a binary variable indicating one group from the other, βk is the population group difference in Y. Typically, the ordinary least squares (OLS) criterion is used to obtain estimates of these population effects by . The minimizing the sum of squared residuals, ∑ residual ei is an estimate of the unknown error, εi. The former is computed as the difference between the predicted and observed DV values for case i; i.e., . At this point of formulating the regression model, estimates of the intercept and regression slopes can be obtained without any assumptions regarding normality. The assumption of normality is often made when inferences based on sample estimates of effect sizes (i.e., B0, B1, …, BK) are to be drawn about unknown population parameters (i.e., β0, β1, …, βK). Common inferential devices include NHSTs and CIs, allowing researchers to make statements about unknown
Practical Assessment, Research & Evaluation, Vol 22 No 9 Pek, Wong, & Wong, Data Transformations for Inference population effects based on sample estimates. When sample size N is not large, normality is formally assumed about the errors, εi, such that ~
0,
,
(2)
where σ is the standard deviation of the errors in the population (see Williams et al., 2013). Often, this assumption is evaluated by examining normality of the residuals, ei, (and not the data) after assuming that these residuals are representative of the population errors, εi. In addition to normally distributed errors, the N cases are also assumed to be independently and identically distributed (i.e., no dependencies such as repeated measures or nested data structures). Because is usually estimated by the variance of the residuals, , the sampling distribution used in inference about the population parameters is the t-distribution. When N is large, the assumption of normality in Equation 2 can be relaxed because of the CLT. The CLT states that as N increases to infinity, the sampling distribution of the estimates will converge toward a normal distribution when the errors are independent and identically distributed with finite variance regardless of the Population
N = 100
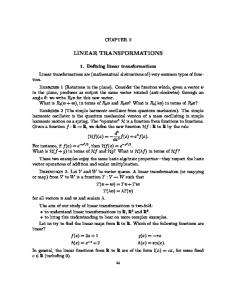
Page 3 shape of the population distribution. In this vein, the assumption of normality is inessential when N is large enough. Although rules of thumb have been recommended for the CLT (e.g., N > 25 for each group in ANOVA or a t-test; Howell, 2013, p. 671), these heuristics cannot be broadly applied because the size of N required for the CLT to be invoked is a function of the extent of non-normality of the population distribution (see illustration below). The Central Limit Theorem in Action Consider the simplest case of linear regression in Equation 1 where an intercept-only model is fit to data; this setup is akin to estimating the mean from data (i.e., ). Here, the intercept B0 is also the mean of the DV. Figure 1 below shows three population distributions, and accompanying sampling distributions of the mean, B0, varied by sample size N. The first population distribution is normal that has skew = 0 and adjusted kurtosis = 0; and the next two population distributions are lognormal with skew = 1 and 7 as well as adjusted kurtosis 1.83 and 152, respectively. These distributions were chosen such that skewness and kurtosis in the population increased from distribution to distribution. For each population distribution, 1,000 N = 25
N=5
Skew = .07 Kurtosis = .02
Skew = -.09 Kurtosis = .03
Skew = .02 Kurtosis = .02
Skew = 1 Kurtosis = 1.83
Skew = .03 Kurtosis = -.19
Skew = .20 Kurtosis = .38
Skew = .31 Kurtosis = 0
Skew = 7 Kurtosis = 152
Skew = .77 Kurtosis = 1.16
Skew = 1.15 Kurtosis = 2.37
Skew = 2.65 Kurtosis = 14.53
Lognormal 2
Lognormal 1
Normal
Skew = 0 Kurtosis = 0
Figure 1. Population distributions and their respective mean sampling distributions for 10,000 samples drawn with varying sample size N. The solid (red) line represents a normal curve whereas the dashed (blue) line represents a kernel distribution.
Practical Assessment, Research & Evaluation, Vol 22 No 9 Pek, Wong, & Wong, Data Transformations for Inference samples were drawn and their means (B0) were computed and then plotted to form an empirical sampling distribution (see histograms). For the normal population, observe that the sampling distributions are normal regardless of sample size N because the normal and kernel distributions are practically indistinguishable. For the lognormal populations, the kernel of the sampling distributions approach normality as sample size N increases. This relationship is moderated by the extent of non-normality in the population such that the sampling distribution of B0 approaches normality more slowly in the more skewed and kurtotic second lognormal population. This illustration demonstrates that the CLT obviates the need for normality of the errors when N is large enough. However, the quantification of large “enough” remains elusive. In general, larger N is required for more non-normal residual distributions and more predictors in the model, such that a general ruleof-thumb cannot be reasonably recommended. For a single variable presented in Figure 1, N = 5 is sufficient for a population distribution with skew =1 whereas N = 100 is insufficient for a population distribution with skew = 7. Further, coverage of 95% CIs for 10,000 samples about the mean for the normal population was close to .95 regardless of sample size. For the lognormal population with skew = 1, coverage about the mean was .935, .944. and .948 for N = 5, 25, and 100, respectively. For the lognormal population with skew = 7, coverage was .814, .866, and .912, for N = 5, 25, and 100, respectively. R code for this simulation study is available upon request. Note that non-normality of the residuals and errors, ceteris paribus, would only result in wider CIs and NHSTs with less power. Can Data Transformations Address Non-normality for Inference? Given the practical constraints that sample distributions are usually non-normal and sample sizes are not large, data transformations have been proposed as a solution to address non-normality (e.g., Osborne, 2002; 2010; Osborne & Overbay, 2005; all published in PARE). In lieu of the CLT with respect to statistical inference, applying transformations to address nonnormality of errors should more often be recognized as a small sample method. Stated differently, normality of the errors or residuals is irrelevant when N is large “enough” for the CLT to be invoked.
Page 4 There are many transformations used to address skewed and kurtotic sample distributions, many of which are special cases of larger families of transformations. For instance, the logarithmic and square root transformations are special cases of the Box and Cox (1964) and Tukey’s (1977) ladder family of transformations. Nonlinear transformations from these families of transformations are often selected to linearize the relationships among variables by way of obtaining normally distributed data residuals, ei. Stated differently, these families of transformations were developed for the purpose of re-expressing nonlinear relationships between predictors and an outcome to linear ones via variable transformation. Note that these linearizing transformations would ideally simultaneously normalize the residuals, ei. In practice, after normality (or linearity) of the transformed data is achieved, analyses with linear regression proceed as usual (i.e., OLS estimation). Because such transformed data are on a different scale compared to the original data (e.g., natural log of reaction time instead of reaction time), the nature of the effect as operationalized by the original variable and its interpretation changes due to the transformation (see also section on transformations for interpretation). To address this complication in interpretation, several authors and textbooks have recommended reverse transformations after conducting inference on the transformed variables (e.g., Bland & Altman, 1996; Harrell, 2015; Howell, 2013). However, inferential results (i.e., NHSTs and CIs) associated with the simple reverse transformation does not necessarily map back onto the original effect of interest (Duan, 1983; Zhou & Gao, 1997), and we strongly discourage the use of reverse transformations. Pek, Wong, and Wong (2017) illustrate in a simulation study that reverse transformed CIs often fail to capture the population mean of the original distribution because coverage was observed to paradoxically worsen with increasing sample size. A separate class of data transformations has also been developed to address the issue of contamination by outliers of (normal) sample data. In the presence of nonnormal data, the analyst can either assume that the population distribution is non-normal, or the sample data which were drawn from a normal population have been contaminated. These assumptions are empirically untestable with a single data set. Under the assumption that the data are contaminated, long tails of data distributions are presumably due to the presence of outlying cases. Non-normal sample data could either be
Practical Assessment, Research & Evaluation, Vol 22 No 9 Pek, Wong, & Wong, Data Transformations for Inference drawn from a non-normal population distribution, or be a mixture of distributions coming from a normal population of interest contaminated by observations from nuisance populations. Alas, statistical methods cannot distinguish these two fundamentally distinct concepts (Bauer & Curran, 2003), and assumptions regarding the distributional form of the population would have to rest on theory. Winsorizing and trimming are transformations devised to address assumed data contamination represented by extreme cases in the tails of the sample distribution (e.g., see Tukey & McLaughlin, 1963; Wilcox, 2010)1. Winsorizing involves replacing extreme values in the data to specified percentiles of the data; a 10% Winsorization would limit observations below and above the 10th and 90th percentiles, respectively, to the 10th and 90th percentiles. In contrast, trimming involves removing extreme values in the data and analyzing a smaller data set; a 10% trimming would exclude observations below and above the 10th and 90th percentiles. Note that with 10% Winsorizing or trimming, 80% of the data remains unchanged. Wilcox and Keselman (2003) recommend trimming 20% of data by default so as to achieve a small standard error and sufficiently control for Type I error. Consider the following scores discussed in an introduction to these robust methods by Erceg-Hurn & Mirosevich (2008), which have been ordered from lowest to highest: 1, 3, 5, 6, 7, 10, 11, 12, 75, 75. Winsorizing by 20% would result in a transformed data set of 5, 5, 5, 6, 7, 10, 11, 12, 12, 12, and trimming by 20% would result in a reduced data set of 5, 6, 7, 10, 11, 12. By ordering the data so as to identify and address the extreme and outlying cases, correct inference based on the Winsorized or trimmed data cannot be computed with the OLS estimator because the cases are no longer 1
Trimming and Winsorizing are distinct from data cleaning and regression diagnostics in that they are motivated by robust methods of estimation. Under this paradigm, the median is the
Page 5 independently distributed. Instead, robust estimators need to be applied to arrive at correct inferential results (for a textbook on this topic, see Wilcox, 2017). Also important to note is that although the scale with which the Winsorized or trimmed data remains unchanged, these transformations like all transformations will change the nature of the effect size of the population with which the sample was drawn from (see example below). When extreme cases are not outliers but part of the population of interest, Winsorized or trimmed estimates are biased estimates of the population effect sizes. Trimming and Winsorizing will result in more powerful NHSTs and tighter CIs about the population trimmed mean or population Winsorized mean, respectively, relative to the population mean. However, because it is unlikely that the population trimmed mean or Winsorized mean is more appropriate compared to the population mean when the population distribution is non-normal, we do not broadly recommend them for practice. Yet, if the population distribution is normal and the data are assumed to be contaminated by outliers, then trimming is recommended. Empirical Illustration Various types of data transformations are illustrated below using empirical data from the Programme for International Assessment (PISA) collected on N = 40 countries. Figure 2 below displays histograms for PISA 2012 reading score differences between girls and boys aged between 15 years and 3 months and 16 years and 2 months, with girls scoring higher. The original difference score distribution is positively skewed, and the logarithmic transformation corrects for this skewness relatively well as the kernel distribution of the transformed scores is more symmetric. In comparison, the 20% Winsorized and trimmed distributions are considerably narrower after the data transformation; 20% Winsorizing or trimming amounts to retaining 60% of the original data. In Figure 2, the means of the sample distributions are represented by different point types which exhibit some variability, indicating that the transformations change the nature of the population mean being estimated. If the (unknown) population distribution of these difference scores is truly nonnormal, the reverse transformed mean, the Winsorized mean, and the trimmed mean are all biased (i.e., most robust central tendency in terms of sensitivity to outliers and is defined by 50% trimming.
Practical Assessment, Research & Evaluation, Vol 22 No 9 Pek, Wong, & Wong, Data Transformations for Inference
Page 6
Figure 2. Histograms for differences in PISA 2012 reading scores between girls and boys with girls scoring higher. The solid (red) line represents a normal curve whereas the dashed (blue) line represents a kernel distribution. The grey histogram for trimmed scores is overlaid on the white histogram for Winsorized scores. The Winsorized scores have a stark bimodal kernel distribution and are associated with a flatter normal curve; the trimmed scores have less of a bimodal kernel distribution and are associated with a more peaked normal curve.
inaccurate) estimates of the population mean. Among these different approaches, the sample mean of the original distribution is the only unbiased estimate of the population mean.
associated with highly biased effect size estimates and NHSTs with exceedingly high Type I errors.
Additionally, the whiskers extending from the means in Figure 2 depict their respective CIs. The CI widths also show variability like their means. The narrowest CI is associated with the reverse transformation, followed by CIs of the original data, the trimmed data, and finally the Winsorized data. Because narrower CIs communicate lower sampling variability, higher statistical power, and better estimate precision, some authors (e.g., Bland & Altman, 1996) have recommended reporting estimates associated with the narrowest CIs. However, we strongly discourage such practice because this recommendation ignores the fact that data transformations change the nature of the data and its commensurate effect size. Based on this recommendation, the reverse transformation mean and CI would be selected for the PISA example. However, these estimates are likely biased representations of the population mean given that the observed sample is representative of the population. Indeed, Pek, Wong, and Wong (2017) demonstrate that reverse transformed CIs were the narrowest compared to other competing CIs, but they had the poorest coverage because they were not centered about the original population mean. Stated differently, the reverse transformation method is
Historically, transformations were developed for two purposes: to address the assumptions of a statistical model, and to aid interpretation (Tukey, 1957). The section above explicated the first purpose of transformations to address non-normality of errors in linear regression (cf., Osborne, 2002, 2010; Osborne & Overbay, 2004). Two important points to bear are that normalizing transformations (a) change the nature of the effect of interest, and (b) are a small sample method in terms of normalizing residuals within the context of linear regression; the latter outcome is unnecessary when sample size N is large enough.
Recommendations for Data Transformations
When inferences about effects in the original scale of the data are of interest, we recommend avoiding the mechanical use of data transformations without consideration of the interpretability of resulting effect sizes. Additionally, only when there is a clear reason to suspect data contamination (e.g., observed normality in previous data) should trimming be used because trimmed estimates have better statistical properties compared to Winsorized estimates (Wilcox, 1998). When sample size N is large enough, applying linear regression as usual without applying a data transformation is appropriate because of the CLT.
Practical Assessment, Research & Evaluation, Vol 22 No 9 Pek, Wong, & Wong, Data Transformations for Inference Finally, if normality of the errors is a concern, bootstrap approaches to inferences are appropriate alternatives (e.g., see Efron & Tibshirani, 1993 for an introduction). The bootstrap circumvents the issue of assuming normality of the errors by empirically constructing the sampling distribution of the effect sizes of interest by assuming that the sample is a reasonable surrogate of the population2. To bootstrap the sampling distribution of Bk, R bootstrap replicates of the same size as the original data are drawn from the sample with replacement. Then, the same linear regression is fit to these R samples such that R bootstrapped estimates, , are obtained. form a Typically, R = 1,000 or 5,000 such that these smooth distribution which serves as the sampling distribution for Bk. It is from this empirically constructed sampling distribution, which is typically non-normal, that NHST is performed or bootstrap CIs are constructed. Given a focus on statistical inference, effects under study and their presence in the population are of prime importance. The application of data transformations should primarily facilitate the interpretability of key effect sizes, and secondarily address the assumption of normally distributed errors when sample size is small. A meaningful effect which is unlikely to be present in the population (i.e., having poor inferential properties) is limited in its application and generalizability. Conversely, a significant effect is impractical if the effect itself is difficult to interpret. In the next section, we focus on the often ignored but essential property of data transformations in improving effect size interpretation. Data transformations for interpretation Some transformations can improve the interpretation of effects when the transformed data and the changed nature of the effect under study have meaningful structure and scale, respectively. For instance, the measurement of sound in decibels follows a natural logarithmic scale, the Richter scale quantifying the magnitude of earthquakes follows a base-10 logarithmic scale, and speed is the reciprocal of time. Note that effect sizes should be interpreted only when they are statistically significant or estimated with limited sampling variability. In this section we consider three
2
When the sample is not large enough to fully represent the population, the bootstrap method does not perform well.
Page 7 popular transformations: the logarithm, the square root, and the inverse (cf. Osborne, 2002). Logarithmic Transformation The natural logarithm is a useful nonlinear transformation when effects are nonlinear and multiplicative. Logarithms convert a multiplication to an addition. For the transformed variable logY, a 1 unit increase in logY is equivalent to multiplying Y by 2.72 because the natural exponent, e1 ≈ 2.72. Stated differently, a 1-unit increase in logY is equivalent to an increase of 172% in the original scale of Y. It follows then that applying the linear regression to data on the logarithmic scale corresponds to a multiplicative model in the original scale. Let the linear regression equation in the logarithmic scale be logYi = b0 + b1X1i + … + bKXKi + Ei.
(3)
Taking the exponent on both sides of Equation 3 obtains Yi = =
⋯
,
(4)
where , and e (see Gelman & Hill, 2007). In the scale of the original data as in Equation 4, the predictors Xk enter into the model multiplicatively instead of additively (cf., Equation 1). Also note that the error also enters the model multiplicatively instead of additively (cf., Ei); this means that if Ei is normally distributed, it follows by definition that cannot be normally distributed. Suppose that unionized university faculty’s log salaries per month are regressed onto years of experience, yielding a predicted regression equation of: log(earnings) = 8.2 + 0.02years. Faculty starting without any experience are expected to earn e8.2 ≈ $3,614 per month, or $43,691 per annum. With regard to interpreting the regression slope, with every year of experience gained, faculty’s salaries are expected to increase by 0.02 in log(earnings). Observe that e0.02 = 1.020. Hence, faculty with one more year of experience on the job are expected to earn about 2% more. Such a nonlinear increment in salary, in relation to years on the
Practical Assessment, Research & Evaluation, Vol 22 No 9 Pek, Wong, & Wong, Data Transformations for Inference job, is consistent with faculty unions negotiating salary increments per year as a small percentage of base pay. Table 1. Relationship between coefficients in the log and original scale. Percentage Natural log Original scale scale, bk increase in Y .01 1.010 1.0% .02 1.020 2.0% .03 1.030 3.0% .04 1.041 4.1% .05 1.051 5.1% .06 1.062 6.2% .07 1.073 7.3% From Table 1, the exponentiation of an effect on a log-transformed variable (logY) is approximately equivalent to the proportion change in Y; however, this correspondence between bk and percentage increase in Y becomes weaker as regression slope values of bk increase (see Table 1). Multiplicative models, where the logarithm of the DV is regressed onto k predictors, are more appropriate than additive models when Y takes on positive values and increases as a factor or proportion of its base value in relation to changes in Xk. In such contexts, the logarithm transformation aids in both the interpretation of effects as well as addresses nonlinearity and error non-normality. Square Root Transformation Although the popular square root transformation can be useful for simplifying relationships with quadratic effects, and also for stabilizing variances (Baguley, 2012), this transformation does not aid in interpretation. It is well-known that children’s vocabulary acquisition increases at an increasing rate (e.g., see Hart & Risley, 1995). Suppose that counts of vocabulary words (Y) are modeled in relation to children’s ages in months (X). Consider the simple linear regression model where the square root of the cumulative frequency of children’s words is regressed onto their age .
(5)
Squaring both sides of Equation 5 yields 2
=
=
,
(6)
Page 8 where 2
2
,
2
,
,
and
Clearly, the transformation obfuscates the interpretation of the coefficients b0 and b1 in the square root scale. The intercept based on the transformed data, b0, is the square root of the intercept in the original scale (i.e., ), and is also a factor in the slope or the instantaneous rate of change at age Xi = 0 in the original scale (i.e.,
). Likewise, the slope
estimated from the transformed data, b1, has an equally complicated interpretation. Although b1 is the square root of the quadratic coefficient in the original scale (i.e., ), it is also a factor of the instantaneous rate of change in the original scale of counts (i.e.,
).
Additionally, similar to the log transformation, observe that if Ei in Equation 5 is normally distributed, then cannot be normally distributed in Equation 6. Thus, the square root transformation changes the functional relationship between predictors and outcome and the distribution of the errors. While the square root transformation can be said to stabilize the variance of the residuals and remove nonlinearity in effects (e.g., Equation 5 has no quadratic term), applying the linear regression to the transformed data results in virtually uninterpretable regression coefficients in the square root scale (Gelman & Hill, 2007). Indeed, such linearizing and variance stabilizing transformations are more suitable for pure prediction problems (e.g., Box & Cox, 1964; Freeman & Tukey, 1950). Instead of applying the square root transformation, such nonlinearity can instead be directly modeled with a quadratic term in the linear model (cf., Equation 6). Inverse or Reciprocal Transformation Another transformation which can aid in the interpretation of effects is the reciprocal or inverse, so long as interest is not about effects in the original scale. Suppose that researchers are interested in whether IQ as measured by Raven’s progressive matrices has an effect on performance on mental sum problems. Let Y be the time taken in minutes to complete 10 mental sum problems in a specific test, and be the average speed of completing each item per minute.
Practical Assessment, Research & Evaluation, Vol 22 No 9 Pek, Wong, & Wong, Data Transformations for Inference The regression of speed onto IQ scores (X) can be expressed as 10
.
(7)
Taking the reciprocal and multiplying by 10 on both sides of Equation 7 yields: 10
.
(8)
Observe that the intercept and slope in the scale of speed (i.e., b0 and b1) do not have a simple relationship with the intercept and slope in the original scale of time (i.e., B0 and B1; cf. Equation 1). However, applying the reciprocal transformation is completely justified when interest is about the effect in the transformed scale. From Equation 7, the intercept b0 is the expected average speed for completing a single item per minute when IQ scores, X = 0. For improved interpretability of the intercept, centering the predictor has been recommended such that b0 can be interpreted as the expected speed at the mean of the sample’s IQ scores (see Cohen, Cohen, West, & Aiken, 2003, p.34). The slope b1 is simply the expected change in average speed per minute required to complete one mental sum item associated with a 1-unit increase in IQ. Also, if the error Ei is assumed to be normally distributed, then the error in Equation 8 cannot follow a normal distribution. Similar to the logarithmic transformation, the reciprocal transformation can aid in the interpretation of an effect as well as address non-normality of the errors in the context of small sample size. Summary and Recommendations We have reviewed, illustrated, and discussed the use of transformations for data analysis with focus on statistical inference with the popular linear regression model, which also includes t-tests and ANOVA. Data transformations were developed to aid in interpretation as well as to address underlying assumptions of a statistical model (Tukey, 1957). We offer two specific recommendations on the application of data transformations for statistical inference with linear regression. Our first recommendation is that data transformations should primarily be applied to enhance
Page 9 the interpretation of key effect sizes. Idiosyncratic consequences and advantages of data transformations should be carefully adjudicated when they are applied to improve the interpretation of effect sizes. Transformations such as the log and the reciprocal are justified if the resulting effect sizes are meaningful and consistent with psychological theory. An added benefit is improved inference when the transformed population errors can be assumed to be normal. If the transformed population errors are not normal, the bootstrap can be applied to address non-normality with small sample size and improve inference. Trimming is justified when there is reason to suspect contamination of the sample data, which is assumed to be drawn from a normal population, by outliers in the tails of the observed distribution. A second recommendation is to avoid transformations for the sole purpose of achieving normality of residuals without consideration of downstream changes to effect sizes and their inference. Independent of transformations, the bootstrap can address non-normality of residuals in the context of small sample size. Further, transformations focused solely on obtaining normality of residuals are unnecessary with large sample sizes because the CLT would supersede the assumption of normal errors. Worse, such transformations could inadvertently introduce bias such that the effect in the transformed scale is no longer consistent with the effect in the original scale of interest. Bias could also occur with transformations which preserve the original scale of the data. For instance, a very large sample with a smooth but skewed distribution such as reaction time data is more likely to reflect a non-normal population distribution than a normal distribution contaminated by a large set of outliers at the tail. Winsorizing or trimming such data would be inappropriate. An apparent need for applying a transformation (e.g., in the presence of non-normal residuals, ei) implies that the linear regression model is not the best approximation of the data; nonlinear models are more appropriate for non-normal population errors (e.g., reaction time data; see Luce, 1986; Ratcliff, 1993; Van Zandt & Townsend, 2013). Transforming data has several repercussions regarding the meaning or interpretability of the resulting estimated effect, as well as this effect’s statistical power and CI coverage. Transforming data can also aid in obtaining more efficient prediction models. Unfortunately, current treatments and recommendations for the use of data transformations in
Practical Assessment, Research & Evaluation, Vol 22 No 9 Pek, Wong, & Wong, Data Transformations for Inference data analyses are relatively imprecise in describing their underlying purposes and motivations which can be traced to two separate data analysis cultures – data modeling (i.e., statistical inference) versus algorithmic modeling (i.e., statistical prediction; Breiman, 2001). It is our hope that this paper clarifies the complexities and subtleties underlying data transformations such that researchers can make informed decisions regarding their use in statistical analyses.
References Baguley, T. (2012). Serious stats: A guide to advanced statistics for the behavioral sciences. New York, NY: Palgrave Macmillan. Bauer, D. J. & Curran, P. J. (2003). Distributional assumptions of growth mixture models: Implications for over-extraction of latent trajectory classes. Psychological Methods, 8, 338-363. doi:10.1037/1082989X.8.3.338. Bland, J. M., & Altman, D. G. (1996). Transformations, means, and confidence intervals. BMJ: British Medical Journal, 312 (7038), 1079. Breiman, L. (2001). Statistical modeling: The two cultures (with discussion). Statistical Science, 16, 199-231. doi: 10.1214/ss/1009213726 Box, G. E., & Cox, D. R. (1964). An analysis of transformations (with discussion). Journal of the Royal Statistical Society, Series B, 26, 211–252. Cain, M. K., Zhang, Z. & Yuan, K.-H. (2016). Univariate and multivariate skewness and kurtosis for measuring nonnormality: Prevalence, influence and estimation. Behavior Research Methods, 1-20. doi:10.3758/s13428-0160814-1 Cohen, J., Cohen, P., West, S. G., & Aiken, L. S. (2003). Applied multiple regression/correlation analysis for the behavioral sciences. Mahwah, NJ: Lawrence Erlbaum Duan, N. (1983). Smearing estimate: A nonparametric retransformation method. Journal of the American Statistical Association, 78, 605-610. doi: 10.2307/2288126 Efron, B., & Tibshirani, R. (1993) An introduction to the bootstrap. New York, NY: Chapman & Hall Erceg-Hurn, D. M., & Mirosevich, V. M. (2008). Modern robust statistical methods: An easy way to maximize the accuracy and power of your research. American Psychologist, 63, 591-601. doi: 10.1037/0003066x.63.7.591
Page 10 Freeman, M. F., & Tukey, J. W. (1950). Transformations related to the angular and the square root. The Annals of Mathematical Statistics, 21, 607-611. doi: 10.1214/aoms/1177729756 Gelman, A., & Hill, J. (2007). Data analysis using regression and multilevel hierarchical models. New York, NY: Cambridge University Press. Harrell, F. (2015). Regression modeling strategies: With applications to linear models, logistic and ordinal regression, and survival analysis. New York, NY: Springer. Hart, B., & Risley, T. R. (1995). Meaningful differences in the everyday experience of young American children. Baltimore, MD: Paul H Brookes. Howell, D. C. (2013). Statistical methods for psychology (8th ed.). Belmont, CA: Wadsworth. Luce, R. D. (1986). Response times: Their role in inferring elementary mental organization. Oxford University Press. Micceri, T. (1989). The unicorn, the normal curve, and other improbable creatures. Psychological Bulletin, 105(1), 156166. doi: 10.1037/0033-2909.105.1.156 Osborne, J. W. (2002). Notes on the use of data transformations. Practical Assessment, Research & Evaluation, 8. Retrieved April 12, 2016, from http://PAREonline.net/getvn.asp?v=8&n=6 Osborne, J. W. (2010). Improving your data transformations: Applying the Box-Cox transformation. Practical Assessment, Research & Evaluation, 15(12), Retrieved May 10, 2017 from http://pareonline.net/getvn.asp?v=15&n=12 . Osborne, J., W., & Overbay, A. (2004). The power of outliers (and why researchers should always check for them). Practical Assessment, Research & Evaluation, 9(6). Retrieved May 10, 2017, from http://PAREonline.net/getvn.asp?v=9&n=6 . Pek, J. & Flora, D. B. (2017, March 9). Reporting effect sizes in original psychological research: A discussion and tutorial. Psychological Methods. Advance online publication. doi: 10.1037/met0000126 Pek, J., Wong, A C. M., & Wong, O. C. Y. (2017). Construction of accurate confidence intervals for the mean of non-normally distributed data. Open Journal of Statistics. 7, 405-421. doi: 10.4236/ojs.2017.73029 Ratcliff, R. (1993). Methods for dealing with reaction time outliers. Psychological Bulletin, 114, 510 – 532. doi: 10.1037/0033-2909.114.3.510
Practical Assessment, Research & Evaluation, Vol 22 No 9 Pek, Wong, & Wong, Data Transformations for Inference Simmons, J. P., Nelson, L. D., & Simonsohn, U. (2011). False-positive psychology: Undisclosed flexibility in data collection and analysis allows presenting anything as significant. Psychological Science, 22, 1359-1366. doi: 10.1177/0956797611417632 Tukey, J. W. (1957). On the comparative anatomy of transformations. The Annals of Mathematical Statistics, 28(3), 602-632. doi: 10.1214/aoms/1177706875 Tukey, J. W. (1977). Exploratory data analysis. Reading, MA: Addison-Wesley Tukey, J. W. & McLaughlin, D. H. (1963). Less vulnerable confidence and significance procedures for location based on a single sample: Trimming/Winsorization 1. Sankhyā: The Indian Journal of Statistics, Series A, 25 (3), 331-352. Van Zandt, T. & Townsend, J. T. (2013). Designs for and Analysis of Reaction Time Experiments. In Todd D. Little (Ed.) Oxford Handbook of Quantitative Methods, Volume 1: Foundations (pp. 260-285). Oxford University Press. Wilcox, R. R. (1998). The goals and strategies of robust methods. British Journal of Mathematical and Statistical
Page 11 Psychology, 51, 1-39. doi: 10.1111/j.20448317.1998.tb00659.x Wilcox, R. R. (2010). Fundamentals of modern statistical methods: Substantially improving power and accuracy (2nd ed.) New York: Springer Wilcox, R. R. (2017). Introduction to robust estimation and hypothesis testing (4th ed.). San Diego, CA: Academic Press. Wilcox, R. R., & Keselman, H. J. (2003). Modern robust data analysis methods: measures of central tendency. Psychological Methods, 8, 254-274. doi: 10.1037/1082989X.8.3.254 Williams, M. N., Grajales, C. A. G., & Kurkiewicz, D. (2013). Assumptions of multiple regression: Correcting Two Misconceptions. Practical Assessment, Research & Evaluation, 18(11). Retrieved May 10, 2017 from http://pareonline.net/getvn.asp?v=18&n=11 Zhou, X., & Gao, S. (1997). Confidence intervals for the log-normal mean. Statistics in Medicine, 16, 783–790. doi: 10.1002/(SICI)1097-0258(19970415)16:7_783::AIDSIM488_3.0.CO;2-2
Citation: Pek, J., Wong, O., & Wong, AC. (2017). Data Transformations for Inference with Linear Regression: Clarifications and Recommendations. Practical Assessment, Research & Evaluation, 22(9). Available online: http://pareonline.net/getvn.asp?v=22&n=9 Corresponding Author Jolynn Pek Department of Psychology The Ohio State University 1827 Neil Avenue, Columbus, OH 43210-1222 email: pek.5 [at] osu.edu