Database Development for Power Quality in PEA’s Distribution System Phongphat Waraphok
Trin Saengsuwan
Provincial Electricity Authority (PEA) and KASETSART University Bangkok, Thailand e-mail:
[email protected]
Faculty of Engineering KASETSART University Bangkok, Thailand e-mail:
[email protected]
Abstract— At present, Provincial Electricity Authority (PEA) has two SQL database systems for power quality (PQ) monitoring system. They are ION7650 of Power Measurement and U902 of Unipower. The complexity to analysis PQ data comes from the different format of those two types of database system and therefore, PEA has to analyze PQ data from ION7650 and U902 separately. In the future, the PEA may have many types of database systems, and that would cause more complexity to analyze the PQ data. To analyze several types of database system, any database system should be set identically as minimum requirement for PQ monitoring system comply with EN50160 standard. This paper presents tools namely PEA ASSESSMENT, to organize and merge two different types of database system from the PQ data result for future of the PEA PQ Data Centre Keywords-database system; power quality; merge; software tool
I.
INTRODUCTION
During 2006/2007, the Provincial Electricity Authority (PEA) Thailand carried out a pilot power quality survey of the electrical distribution networks in central area of Thailand. Seven electricity distributors or Small Power Plant (SPP) were involved in PEA distribution system and ten substations are surveys on 115 kV of central area on power systems being monitored for one year. Main topic of the survey is to establish a survey methodology applicable to Thailand that would meet the requirement of State Regulators for the provision of network power quality data in an appropriate format. Hence the issue of data collection, analysis and presentation are a topic focus of the project.
The surveys use 50 monitoring units in total with 2 types of PQ meter, ION7650 of Power Measurement meter and U902 of Unipower meter. This project recorded PQ database more than 10 GB. These instruments were chosen because they had both logging and event capture capabilities, measured or allow calculation of the selected power quality quantities, had battery-backed and memory (8 MB) were locally manufactured. The measured quantities can be divided into two groups, namely, those that were measured by logging and those that were captured as distinct events. Logged quantities (continuous events): 1) Steady State Voltage. 2) Unbalance (3 phase sites only) 3) Harmonics. Captured quantities (discrete events): 1) Sags/Interruptions. 2) Swell. 3) Transients. The data from two typical monitoring surveys are recording via Microsoft SQL Server too. II.
DATABASE REQUIREMENT
A. Inputs to the database The voltage data from the monitoring instruments which was put into the database was of three main types:
1) Trends, i.e. logged data, consisting of the 10-minitue average line-neutral voltages of each phase, and the 10minite average of the DC, 1st-40th harmonic order and Total Harmonic Distortion (THD) 2) Sag/interruption/swell parameters obtained using the Table Capture feature of the instrument which stores the time of occurance, maximum depth and duration of RMS events for each phase independently. 3) Transients waveforms stored as 2 cycle pre-trigger and 5 cycles post-trigger (250 points) for each phase independently. B. Output from the database The data from the survey was reported in two ways: 1) Site data – the actual data collection from each site. 2) Summary data – collection of key power quality parameters from all sites, All sites were coded for confidentially. The data from each site was presented as: a) The RMS votlage trends over the survey period for each phase. b) The voltage unbalance trend over the survey period. c) Harmonic trends over the survey period for each phase for 1st-40th harmonic order & THD. d) The sag/interruption/swell capture table. e)
Captured transient waveforms.
The summary data was presented in the form of bar graphs where each bar was used to display the data from each site, the worst sites being located on the left of the graph. The key summary parameters presents were: a) 95% absolute deviation from nominal voltage. b) 95% voltage unbalance. c)
95% 1st-40th harmonic orders and THD.
d) Number and duration of sags with depths to less than 80%, 60%, 40% & 10% (interruptions) of nominal voltage. e) Number and duration of swells greater than 120% of nominal voltage. f) Number of transients with magnitude greater than 120% of peak 50 Hz level. The 95% cumulative probability value was used for the logged data to be consistent with the way national and international standards deal with variations of these quantities over time [1]. C. Data Processing For calculating in the past, we have to move Trend data and Table Capture from database of Microsoft Structured Query Language (MSSQL) to Microsoft Excel and use builtin statistical function to find out average, maximum, minimum and percentiles of PQ data by manual.
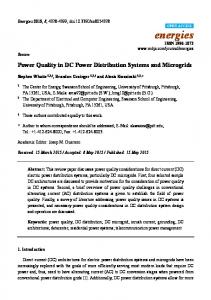
Figure 1. ION _Data and PQSecure database
After the sizes of database more than 5 GB (about sixmonths), the conventional method has a lot of trouble due to users have to work hard and waste a lot of time. What are the main problems? The larger size of database when recording in long term, and the complexity of more database types come from several instrument into Microsoft Structure Query Language (SQL) server. As a result, the users have to analysis both database separately. In addition, users or analyzers have to have enough skills and attentions to run the commands script for more data. If the PEA has tools to reduce those complexity processes, we would get more benefits from reducing time, avoiding human error and easing to operate. One of methodology to solve such a problem was software developing (Borland Delphi modules) which containing validly SQL’s command scripts. It can access many types of power quality data. The name of proposed software is PEA ASSESSMENT. In addition, PQ team of the PEA have to concern PQ characteristic and specification of our distribution system preparing for future projects namely Benchmark and PQ Data Centre. The idea of interchanging or converting database from many PQ’s database such as MicrosoftAccess/MSSQL/Oracle and different format type to be identical format type are setting to be a project. The monitoring data from any source have to move to new database, namely PQPEA type. Fig. 1 illustrates two typical databases using in the PEA, ION_Data database and PQSecure database. Both units running on MSSQL sever. Example SQL code for ION7650 meter command. USES ION_DATA SELECT DL.[VALUE] AS U1AVG FROM SOURCE S INNER JOIN NAMESPACE NS ON S.NAMESPACEID=NS.ID INNER JOIN DATALOGSTAMP LS ON S.ID=LS.SOURCEID INNER JOIN DATALOG DL ON LS.ID=DATALOGSTAMPID= INNER JOIN QUANTITY Q ON DL.QUANTITIYID=Q.ID WHERE Q.ID =‘220’…
Example SQL code for U902 meter command. USES PQSECURE SELECT U1AVG WHERE MEASURENO=‘2’… Figure 2. Comparing of query command
III.
EXISTING DATABASE
To access PQ database server, SQL command script will be used. Fig. 2 shows an example of SQL code from both ION7650 and U902 meter. This script is used to find average voltage of channel1 or U1avg. To exchange two SQL data to our own power quality database, the IEEE COMTRADE [2] will be considered. This format provides for an ASCII or binary file format for the interchange of transient data produces by fault recording devices. This format is quite useful for general time domain data interchange and is in fact in use by the power quality community.
Figure 4. Converter module as PEA ASSESSMENT
Unfortunately, only ION_Data database of ION7650 meter supports COMTRADE format, but the PQSecure database of U902. Thus, new power quality database of PEA on this paper can not design by IEEE COMTRADE format. To design easily, ION_Data will be converted to PQSecure database. Data contained in ION7650 and U902 database are ASCII and binary format. ASCII format is the value like that numeric and float, people are understood. Fig. 3. show binary format which is array of waveform. The waveform captures from two databases are recording in binary format. For U902 meter, 16 bytes binary format has RMS-waveform type as contain in image field type. While ION7650 meter, 7900 bytes binary format has Sinewaveform type as contain in varbinary field type. It noted that those binary format of two types are different format (RMS and Sine) and different typical of field (image and varbinary). As a result, only ASCII format will be used in this paper. Merging two databases into PQPEA database has been shown in Fig. 4. Many data from ION7650 meters are recording to ION (ION_Data) server and data from U902 meters recording to U902 (PQSecure) server. Again, the converter block diagram in Fig. 4 is software developing namely PEA ASSESSMENT. It is contained SQL query command script to query all necessary to PQPEA database.
Figure 5. Voltage values on ASCII format
Example of voltage values for ASCII format views by MSSQL-Query analyzer module has been show in Fig. 5. There are average, maximum and minimum of three-phase voltage which is recording every 10 minutes. IV.
DESIGN
DATABASE
How to design a new database? Now, follows up international standard as discussed above and choose structure of PQSecure to default because simply and convenience, not yet PQDIF [3] Fig. 6 shows PQPEA database containing 12 tables, and setting main table is MeasureTable, MeasureTable. It has ID field linking to all tables, this ID field is number to refer meter of each table in Fig. 7. Database are classify to Trend and Event type. Trend includes, VoltageTable, THDvTable, CurrentTable, THDiTable (same TDDiTable), PSTTable, PLTTable, HarmonicVTable, HarmonicITable, FrequencyTable and Event has SagSwellTable, TransientTable. MeasureTable Link between filed Trend
Event
VoltageTable
HarmonicVTabl
TransientTable
THDvTable CurrentTable
HarmonicITable
THDiTable
Figure 3. Binary or waveform capture
PSTTable
SagSwellTable
FrequencyTable
PLTTable
Figure 6. Relation of PQPEA database
MeasureTable
VoltageTable
ID
ID
MeasureName
U2Avg
VoltSystem
…….
…….
U1Avg
MeasureID
Figure 7. Linking between Main table and Client table
Figure 8. Converting form of PEA ASSESSMENT
V.
by themselves, then PEA ASSESSMENT software are friendly interface and more efficiency. For convenience, PEA ASSESSMENT was design to address to edit text file is “sqlpqpea.ini” which text file contains SQL command script packages. It uses “Notepad” software to editing. Users can create new table of PQPEA database such interesting to analysis and adding suitable SQL command script too. From results, the source data are successfully converted to sink database in PQPEA platform. The end-user would use to other application. B. Calculation and Displaying function After converting successfully, next step is application to use new database that calculating and displaying as assessment value [4]. The assessment is methods to describe, measure, and predict the severity of the voltage sag problem: how may times per year will the equipment trip. There are two methods available that quantify the severity of the problem: power quality monitoring and stochastic prediction. Power quality monitoring gives mainly information about common events. For less common events stochastic prediction is more suitable. Next topic will explain screen for PEA ASSESSMENT software in Fig. 9.
SOFTWARE TOOL
Organize tools, developing PEA ASSESSMENT software from Borland Delphi 2005 which effort to graphic and components. PEA ASSESSMENT has functional to converting ION7650 and U902 type into PQPEA type and calculating statistical important indices. For two functional system cans describe: A. Converting function Flowchart in Fig. 8 shows decision input database source between ION_Data and PQSecure type to converting. This process user only choose name of source database for converting, PEA ASSESSMENT software has automatically algorithm to classify typical database between ION or U902. Algorithm is simply logic that classified by table name of each typical database are assigned. After SQL command packages of type are loading which matching to suitable converting to PQPEA format, software will automatically converting. Thus end step is filtering to same format type. Fact, this process will include monitor name and time range scale too. Although, this software are automatically converting to classify type but developing software not intelligence to know that what’s monitor sites are converting or not? Then users must selecting meter sites manually before uses converting function. Future, the PEA probably will use more other SQL database type. The complexity are increase confusing, if users can adding or editing or deleting SQL command script
Figure 9. Main screen of PEA ASSESSMENT
VI.
TEST CASE AND RESULT
This section presents application result of PEA ASSESSMENT software. The monitoring resulted in 115 kV busbar as shown in Fig. 10 using both U902 and ION7650 (without synchronizing) will be presented.
Figure 10. Monitoring at incoming 115 kV busbar
For sag/swell case, data from PQSecure and ION_Data are converted to be data as shown in Table I and II, respectively. TABLE I. No 1 2 3 4 5 6 7 8 9 10 11 12 13 14 15 16 17
SAG/SWELL DATA FROM U902
Time 9/04/2549 2:45 PM 14/04/2549 1:06 PM 11/06/2549 12:26 AM 15/06/2549 4:07 PM 21/06/2549 3:54 PM 23/06/2549 12:36 PM 23/06/2549 9:45 PM 25/06/2549 9:18 AM 25/06/2549 1:53 PM 3/07/2549 1:40 PM 3/09/2549 3:23 AM 29/09/2549 4:09 AM 13/10/2549 1:40 PM 13/10/2549 3:57 PM 28/10/2549 9:03 AM 28/11/2549 3:54 PM 22/12/2549 6:04 PM TABLE II.
No 1 2 3 4 5 6 7 8 9 10 11 12 13 14 15 16
Phase 1 3 3 1 3 3 1 1 2 3 1 3 3 1 1 1 2
Volt (%) 87.20 85.30 88.70 87.30 58.70 76.50 88.50 53.00 68.70 41.30 49.30 87.20 28.00 46.40 29.30 89.40 13.51
Duration (s) 0.0990 0.0490 0.0490 0.0290 0.0900 0.0690 0.0200 0.0700 0.0700 0.0690 0.0800 0.0490 0.0790 0.0900 0.1390 0.0400 0.0990
SAG/SWELL DATA FROM ION7650
Time 9/04/2549 2:47 PM 14/04/2549 1:08 PM 11/06/2549 12:29 AM 15/06/2549 4:10 PM 21/06/2549 3:57 PM 23/06/2549 12:39 PM 23/06/2549 9:49 PM 25/06/2549 9:22 AM 25/06/2549 1:57 PM 3/07/2549 1:44 PM 3/09/2549 3:28 AM 29/09/2549 4:14 AM 13/10/2549 1:45 PM 13/10/2549 4:03 PM 28/10/2549 9:09 AM 22/12/2549 6:10 PM
Phase 1 3 3 1 3 3 1 1 2 3 1 3 3 1 1 2
Volt (%) 87.04 85.68 89.06 87.15 58.75 76.75 87.19 52.31 68.88 41.38 49.41 87.58 27.52 46.51 29.48 13.79
Duration (s) 0.0900 0.0600 0.0400 0.5300 0.0900 0.0600 0.0200 0.0800 0.0700 0.0700 0.0800 0.0500 0.0700 0.0800 0.1300 0.0900
The results of Table I and II shows all sag/swell events in 2006 using PEA ASSESSMENT tool and cross checking with fault record. SEMI F47 Curve at Chonburi,THAILAND 100 90 80 Volt (%)
70 60 50 40 30 20 10 0 0
0
1
10 Time (s)
Figure 11. SEMI F47 Curve
100
1000
Figure 12. Displaying of other assessment
Fig. 11 shows the number of voltage dips plot in SEMI F47 curve using PEA ASSESSMENT software. It’s found that the number of voltage dips outside SEMI F47 is 10 times a year. Fig. 12 shows capabilities of proposed software. There are trend plot, cumulative distribution function plot and 3D sag density plot. Disadvantage of this software is Graphic User Interface (GUI) which is not user friendly. In addition due to memory buffer of PC is limited, it can not converting the database size more than 10 GB in the same time. VII.
CONCLUSIONS
This paper introduces a software tool to manage PQ’s database of PEA power system using different two typical database monitoring. Main benefit of proposed software is to calculate and assess PQ data. The advantages of developing software are directly to our requirement and apply to PQ surveys project, PQ benchmarking and PQ Data Centre.
ACKNOWLEDGMENT Authors would like to thank the Provincial Electricity Authority (PEA) Thailand and The graduate school of KASETSART University who supported this research. REFERENCES [1] [2]
[3] [4]
CENELEC European Standard EN50160, “Voltage characteristic of electricity supplied by public distribution systems”, November 1994. IEEE Standard Common Format for Transient Data Exchange (COMTRADE) for Power System, IEEE C37.111-1991, October 21,1991. Erich W.Gunther, “On Creating a New Format for Power Quality andQuantity Data Interchange,” Electrotek Concepts, Inc. Math H.J. Bollen, Understanding Power Quality Assessment for voltage sag and interruptions. Piscataway, NJ: IEEE Press, 1999.
Phongphat WARAPHOK B.Eng (Electrical Engineering),Chiang Mai University of THIALND in 2000. He is working at Provincial Electricity Authority (PEA) THAILAND since 2002. Now he was studying master degree in graduate school of KASETSART University, Thailand. His current interests are in the power quality, database system, network system and software developing. Trin SAENGSUWAN B.Eng (Electrical Engineering), Kasetsart University, MSc (Electrical Engineering) and Ph.D., University of Manchester Institute of Science and Technology, United Kingdom. He has lecture at KASETSART University, Thailand. Research area: Power quality, Power system analysis.