FOI-D--0447--SE. Sensor and Electronic Warfare Systems. March 2011. Internal
Report. Svante Björklund. DBT, A Matlab and Octave toolbox for radar modelling
...
DBT, A Matlab and Octave toolbox for radar modelling, signal simulation and processing. Release 2.156. Svante Björklund
FOI-D--0447--SE
Release 2.156
Sensor and Electronic Warfare Systems Internal Report
March 2011
Issuing organization
Report number, ISRN
Report type
FOI - Swedish Defence Research Agency Sensor and Eelectronic Warfare Systems P.O. Box 1165 SE-581 11 LINKÖPING SWEDEN
FOI-D--0447--SE
Internal Report
Programme Areas Month, year
Project no.
March 2011
E54003
General Research Areas Subcategories Author/s (editor/s)
Project manager
Svante Björklund
Andreas Gustafsson Approved by
Andreas Gustafsson Sponsoring agency
Swedish Armed Forces (FM) Scientifically and technically responsible Report title (In translation)
DBT, A Matlab and Octave toolbox for radar modelling, signal simulation and processing. Release 2.156. Abstract (not more than 200 words)
Since a a long time we develop a Matlab and Octave Toolbox for radar modelling, signal simulation and signal processing. The toolbox, called DBT, contains modelling of temporal properties (waveforms, ambiguities, sidelobes, etc.) and space properties (array antennas with subarrays), model errors (hardware, system and environment), signals (target, noise, clutter and jamming) and SINR (Signal to Interference plus Noise Ratio). Further, DBT has signal simulation (target, noise, clutter and jamming) and reading and using measured radar signals. Finally, DBT contains signal processing (beamforming, Doppler filtering, pulse compression, STAP, detection, target parameter estimation and analyses of various kinds). This report is a short description of Release 2.156 of DBT. First, modes of operation and representation of signals are described. Then, the implemented functionality is listed. A short section tells about how to use the toolbox. After that radar signal acquisition, especially measured signals, is described. Then, a lot of examples of the use of DBT are given. Moreover, a graphical interface to DBT is briefly presented. In addition, a comparison with a similar official Matlab Toolbox is made. The report ends with a list of implemented functions.
Keywords
Matlab, Octave, radar, model , simulation, signal processing Language
Further bibliographic information
ISSN
Pages:
45
Price acc. to pricelist
-1-
Contents 1. Introduction ............................................................................................ 4 2. Modes and signals ................................................................................... 5 2.1
Modes of operation.........................................................................................5
2.2
Representation of received signals .................................................................6
3. Current implementation ........................................................................ 9 3.1
Radar modelling .............................................................................................9
3.2
Signal simulation..........................................................................................10
3.3
Radar processing ..........................................................................................11
3.4
Future development of DBT.........................................................................12
3.5
Design and development process .................................................................13
4. How to use the toolbox ......................................................................... 14 4.1
An extended Matlab/Octave language .........................................................14
4.2
Sequence of commands ................................................................................14
4.3
Documentation .............................................................................................15
4.4
System requirements ....................................................................................16
5. Radar signal acquisition....................................................................... 17 5.1
Simulated radar signals ................................................................................17
5.2
Measured radar signals.................................................................................17
6. Applications using DBT ....................................................................... 20 6.1
Applications..................................................................................................20
6.2
Figures of examples of the use of DBT........................................................21
6.3
Application software ....................................................................................30
7. DBTLink - A graphical block interface to DBT ................................ 31 8. Comparison with Matlab Phased Array System Toolbox ................ 33 References.................................................................................................. 34 A: Function list.......................................................................................... 37
-3-
1.
Introduction A Matlab/Octave and Octave toolbox called DBT for radar modelling, simulation and signal processing has been under development at Swedish Defence Research Agency (FOI) since 1994. In the beginning the focus of DBT was radar array processing. By radar array processing we mean signal processing in the spatial dimension in a radar using signals from an antenna array. Now, DBT also contains other radar signal processing to make the processing complete. DBT has also been used for sonar applications. Matlab is a well-known programmable software for numerical computations and data visualization [20]. Octave [21] is also a programmable software for numerical computations and is free software under the GNU General Public License [15]. Matlab and Octave are to a high degree compatible with each other. Octave is actually more compatible with old Matlab code than Matlab is. The objectives of DBT have been to help in the research on radar signal processing (especially array processing), to perform signal processing on measured radar signals, to support cooperation in development of software tools and to serve as a software demonstrator. DBT and a related graphical user interface have been briefly described in [6, 7]. This document is an introduction and brief description of DBT. First, Section 2 describes modes of operation, signal representation and the signal flow when using DBT. Then, Section 3 briefly lists the currently implementation of DBT and some possible future extensions. After that, Section 4 describes how to use the toolbox. How to acquire radar signals to process is the theme of Section 5. Then, in Section 6 some applications using DBT are listed. There exists a graphical user interface to part of DBT and this is introduced in Section 7. Section 8 compares DBT with a recent and similar toolbox from Mathworks. Appendix A contains a complete list of functions in DBT. The important interfaces and datatypes are described in the reference guide [5].
-4-
2.
Modes and signals
2.1
Modes of operation The received signals in DBT are baseband signals, represented by their complex envelope, and can be of three types resulting from three modes of operation: pulsed radar, FMCW (Frequency Modulation Continuous Wave) radar and passive mode.
2.1.1
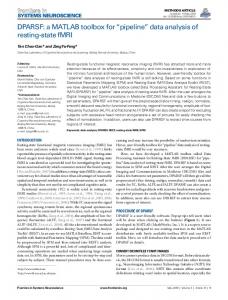
Pulsed radar (active mode) The purpose of most radars is to detect targets, estimate the direction to targets and estimate range and velocity of targets in a hostile signal background, which can be both natural and man-made. This is done by transmitting an RF signal that is pulsed in time with a certain PRF (pulse repetition frequency) and has a certain pulse modulation (Figure 2.1), e.g. various phase or frequency modulations. The signal from target echoes (Figure 2.2) is received with a receiver antenna and converted to a digital complex baseband signal. In pulsed radar, received time snapshots from the same pulse (Figure 2.2) represent different range samples. Time snapshots from different pulses represent different time samples (pulses) from the same ranges. This, together with the signals from different channels of a digital array antenna, form a multidimensional radar signal, a radar datacube (Figure 2.3, left). From this radar datacube, targets are detected, the direction to targets, and the range and velocity of targets are estimated.
Transmitted signal
Waveform modulation
Time snapshots Pulse1
Pulse 2
Figure 2.1: Transmitted radar signal.
Received signal
Echoes from one target
Time snapshots Pulse1
Pulse 2
Figure 2.2: Received radar signal.
-5-
2.1.2
FMCW radar (active mode) In FMCW-radar the baseband signal is not created by mixing the received signals with the carrier, as with pulsed radar, but mixed with the transmitted signal, which consist of a sinusoid with a varying frequency. The received signal will also be a sinusoid with a varying frequency, where the frequency is the difference between the transmitted and received frequencies. See [17, 18] about FMCW radar. Also in FMCW radar the transmitted signal can be repeated and the received signal can be stored in a radar datacube.
2.1.3
Signals in passive mode In passive mode, the system does not transmit the signal itself but listens on another transmitter. Since, it is not possible to measure range by the time difference between the transmitted and received signal, the range dimension of the radar datacube is not used but still we can consider the signal to be in a radar datacube (or “radar plane”). This mode is typically communication applications. Passive bistatic radar belongs to the one of the previous modes, probably pulsed radar, since a reference of the transmitted signal is needed.
2.2
Representation of received signals
2.2.1
Representation of received radar signals The received radar signal is represented by its complex envelope and is stored in the radar datacube as a Matlab/Octave multidimensional matrix. The amplitude of the complex valued signal is the amplitude of the received electromagnetic wave and the corresponding for the phase. Before any processing is done, the indices of the radar datacube (Figure 2.3, left) are: (pulseIx, timeInPulseIx, channelIx, extraIx, cpiIx, trialIx), where pulseIx is the index of the received pulses (Figure 2.2), timeInPulseIx is the index of received time snapshots within one pulse, channelIx is the index of the antenna channels, extraIx is a user defined index, cpiIx is the index of the CPIs (Coherent Processing Intervals) and trialIx is the index of repeated trials.
Pulse
R
an ge
e)
ls
ge Pu an R e in im (T
Beam
Channel
Radar datacube
Doppler
Figure 2.3: A received radar signal as a radar datacube before (left) and after (right) conventional processing.
-6-
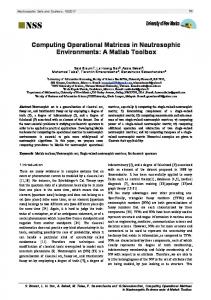
In this section, the term “conventional processing” means linear filtering in the form of conventional beamforming, Doppler (or signal frequency) filtering and pulse compression (Figure 2.4:). The conventional processing of the radar signal can be done in several steps, e.g., 1) beamforming to subarrays, 2) Doppler filtering, 3) final beamforming, etc. The order of the processing steps can be changed. See Figure 2.4. After conventional processing, the indices must be interpreted differently than before. If no data reduction is done, the information in the radar datacube should be the same before and after the processing. We have only made a change of basis in a vector space to make it easier to see the relevant information. What is stored in the radar datacube, are the coordinates in a specific basis. For example, when performing doppler filtering, we change from the trivial basis δ(t m – τk) (different delays τk :s) to the Fourier basis e jω t (different Doppler frequencies ω k :s). k m
After doppler filtering, the indices are the following. A minus sign “-” means that this dimension is unchanged by the processing. (dopplerChanIx, -, -, -, -) Indices after beamforming: (-, -, beamIx, -, -)
Models:
DBT Block diagram
Antennas Waveforms Imperfections
Linear Proc.
Model Based Detect.& Estim.
Pulse Compression
Signal Simulation
Targets Jammers Clutter Noise
Estimate of no. of targets DOA estimate
Doppler Filtering
Conventional Detect.& Estim.
Doppler est. Range estimate
Measured Signals
Beamforming
DigAnt Arken SIRS77 SE-RAY-EM
Features
STAP
Classification Target class
Figure 2.4: Block diagram of DBT. This data flow is built by the end user in application programs (Section 4). The models consist of steering vectors and parameter structures.
-7-
Indices after pulse compression: (-, rangeBinIx, -, -, -) Indices after complete conventional processing (Figure 2.3, right) are (dopplerChanIx, rangeBinIx, beamIx, extraIx, cpiIx, trialIx), where dopplerChanIx is the index of Doppler channels, rangeBinIx is the index of range bins and beamIx is the index of formed beams.
Note in Figure 2.3 that conventional processing can reduce the size of the radar datacube. This happens when data reduction is done. After conventional processing, conventional and model based detection and estimation methods can be used to estimate, for example, the number of targets, direction to and doppler and range of targets (Figure 2.4). The direction to targets are expressed by the direction-of-arrival (DOA) of the reflected signals.
-8-
3.
Current implementation This section describes what is implemented in the current release (2.156) of DBT. There are functions and data types for radar modeling, signal simulation and signal processing. There are also many auxiliary functions, which also are useful outside the scope of DBT. See Appendix A for a complete list of functions.
3.1
Radar modelling DBT contains the following radar modelling: • Pulsed radar waveform design tool: Help with choosing and showing temporal radar parameters (PRF, waveform, range resolution, unambiguous range etc.) for pulsed radar. • Modeling of array antennas with or without analog beamforming to subarrays. The antenna elements can be placed arbitrarily, rotated and have arbitrary element patterns, given by user specified functions. Polarization is not implemented and therefore, doubly bent antenna surfaces cannot be used correctly even if it is possible to define antenna elements on such surfaces. Simply bent antenna surfaces can be used if the polarization is chosen such that it is the same for all antenna elements. By “bent” surfaces also faceted surfaces are included. See Figure 6.1. Planar antenna surfaces can have their polarization in arbitrary direction without incorrect modelling. • Antenna pattern plots in 1D and 2D of different types with specified tapering, main beam and subarray pattern scanning, adaptive sidelobe cancellation and model errors (Figure 6.2 and 6.3). • Calculation of antenna gain by numeric integration. Computing antenna gain reliable and accurately is difficult. The necessary integration is difficult because typical antenna patterns of array antennas have many singularities. The numerical integration can also be slow. • Computation of steering vectors in space, slow-time (pulse), fast-time (range), space-slow-time and space-fast-time. These can be used in many signal processing methods. • Modelling of model errors directly (the “direct method”): antenna element positions, antenna element patterns, broken antenna elements and random amplitude, phase and I/Q-errors in the antenna channels. • CMTs (Covariance Matrix Taper) to model hardware, system and environment imperfections. With CMTs other model errors can be modelled than with the direct method. • Computation of theoretic monostatic surface clutter correlation matrices. • Computation and plotting of SINR (Signal to Interference plus Noise Ratio) for nonadaptive space-time processing and optimal and fully adaptive STAP in slowtime and fast-time. Model errors may be included.
-9-
3.2
Signal simulation DBT contains the following signal simulation: • Simulation of received narrowband radar point target signals with specified range, direction, and radial velocity and pulse modulation (rectangular pulse, Barker, Frank and Chirp code, measured or user defined). Depending on the chosen PRF there can be ambiguities in range and/or Doppler. There is no change of target position within a CPI (Coherent Processing Interval) but Doppler shifts due to movement are simulated. • Simulation of received jammer signals: The jammer time signals can be either noise or repeating the radar pulse modulation synchronized with the radar (repeater jammer). Some development is needed to make these simulations flexible and user friendly. • Simulation of received gaussian distributed random narrowband signals with arbitrary source correlation matrix. • Simulation of received wideband (or narrowband) signals with a Gaussian distribution or a specified time signal. These are typically communication signals. Function simwidebandkernel(). • Simulation of Gaussian distributed receiver noise with arbitrary spatial correlation matrix. • Simulation of monostatic surface clutter signal (the “old clutter simulation”): Stationary or moving radar platform; taking the antenna gain into consideration, arbitrary antenna orientation relative the platform velocity; same or different transmitter and receiver antennas; only clutter returns within ranges from flight altitude to horizon; clutter from several ambiguous ranges; spherical earth model; the well-known relation between direction to the clutter and the Doppler of the clutter; constant gamma RCS model, range and azimuth limited clutter cell area; constant clutter amplitude between clutter cells or uncorrelated complex Gaussian. The radar position is not changed within a CPI. The clutter model is from [31]. • A new and different simulation of surface clutter is under development. Compared to the above simulation, its clutter cells are defined in surface coordinates and not radar coordinates. The new simulation will be able to handle bistatic radar, range walk effects, non-homogeneous clutter etc. • Using measured radar data from an experimental array antenna (Section 5.2.1) at FOI: Acquisition of signals, near-field compensation and five methods for calibration compensation [30]. Also using measured radar data from the Arken radar (5.2.2), the SIRS 77 radar (Section 5.2.3) and the radar SIRS 24. Using measured signals is strictly not “signal simulation” but is also a means to acquire radar data. We have also used radar data from detailed electromagnetic computations as input to DBT (Section 5.2.4). These are not measured data but can be treated as such. • Simulation of model errors: antenna element positions, antenna element patterns, broken antenna elements and random amplitude, phase and I/Q-errors in the antenna channels.
- 10 -
3.3
Radar processing Spatial signal processing requires an array antenna but the other parts of the toolbox can be used also for single-channel antennas. The methods for spatial signal processing are independent (where applicable) of the used receiver antenna since the model for the receiver antenna is localized to the function that calculates spatial steering vectors. There are the following processing in DBT: • Down-sampling of the range dimension, resulting in larger range bins (sigresample). • Pulse compression with several methods with any of the pulse modulations above (Section 3.2). • Conventional beamforming with beamforming weights according to five basic methods (Conventional beamforming, Adaptive beamforming, Capon beamforming, FFT and Direct transformation matrix method). Tapering (uniform, Taylor, Chebychev and user defined) and beam orthogonalization are possible. • Doppler filtering by the same methods as for beamforming. • Ideal clutter filtering in frequency domain for stationary radar (clutterfilt1). • Detection of radar targets with CA-CFAR (Cell Averaging Constant False Alarm Ratio) with square law detector after coherent processing. This assumes complex Gaussian interference (noise, clutter and other interference and independent and identically distributed interference samples. It is easy to implement other CFARs and detectors. • Estimating radial velocity, range and DOA of detected targets. • Detection of radar signals in ESM (Electronic Support Measures) systems. • Spectral DOA (Direction of Arrival) estimation [19]: Conventional beamformer, Capon, MUSIC, Min-norm and Eigenvector method. (Figure 4.1, 6.15-6.18). • Parametric DOA estimation [19]: Stochastic Maximum Likelihood (SML), Deterministic Maximum Likelihood (DML), Parametric Target Model Fitting (PTMF), Weighted Subspace Fitting (WSF), Subspace Fitting (SSF), ESPRIT, Root MUSIC and four methods for the estimation of DOAs from DOA spectra. • Calculation of theoretic performance bounds of DOA (Direction of Arrival) estimates by the Cramér Rao Bound. • Estimation and modification of the spatial correlation matrix from arbitrary snapshots with Maximum Likelihood, Forward-backward averaging, Spatial smoothing [19], Yamada, Diagonal loading, Equal noise eigenvalues and Normalizing relative the noise eigenvalues. • Estimation of the number of sources from spatial information with AIC (Akaike Information Criterion), MDL (Minimum Description Length) and the estimation of the number of peaks in DOA spectra with four methods. • Spectral high resolution Doppler estimation. • Spectral high resolution range estimation.
- 11 -
• Spectral high resolution DOA Doppler estimation. • Time-frequency analysis (TFA) in the Doppler dimension. Implemented methods are most of the about 30 methods in the Time Frequency Toolbox [1] e.g. ShortTime Fourier Transform (STFT), Wigner-Ville, PseudoWignerVille and SmoothedPseudoWignerVille. See Figure 6.7 for an example. It is also possible to line up frequencies in TFAs. • CMTs (Covariance Matrix Taper) to enhance the signal processing. • Estimation of power of targets, jammers, interference and noise. Estimation of SNR (Signal to Noise Ratio) and SINR (Signal to Interference plus Noise Ratio). • Estimation of the instantaneous frequency of a signal. • Plot of received radar signals before and after processing (see Figure 3.1 for an example), plot of spatial correlation matrices and their eigenvalues and plot of DOA spectra.
3.4
Future development of DBT Ongoing and planned development of DBT is: • More detailed target simulation with movement of radar and target within a CPI. Use of measured or computed RCS (radar Cross Section) as a function of aspect angles. New fluctuation models of the target signal.
Figure 3.1: A plot window for radar signals with a GUI. Here, a simulated radar signal is displayed. Three target echoes are easy visible.
- 12 -
• Improved execution speed of clutter simulation. • Bistatic simulation of targets and clutter. • Hot clutter (terrain scattered jamming) simulation. • Polarization. This is needed for general conformal antennas. • Management of range walk in the received signal. • New CFAR (Constant False Alarm Ratio) and detection methods. • Improved estimation of velocity, range and DOA of detected targets. • Resolution of ambiguous range and Doppler. • Continued generalization of the code so that 1D, 2D and 3D processing can be performed with the same code. • Conversion to true object orientation and not using the current “simulated” object orientation. The true object orientation should use the old object orientation style of Matlab (up to release 2007b) because it is possible to run also on Octave and old versions of Matlab.
3.5
Design and development process See [2, 5] for an introduction to the design of DBT. To manage the software version and release control of the Matlab/Octave code and help text of DBT in a multi-developer environment, we use the CVS source code version management system [12]. About 79 000 lines of code, help text and comments. By a rough estimate 50% are help text and comments, 45% are management of signals and parameters, and also error checks, and 5% do the work. The development has been by demand. There is not a complete set of functions in DBT. Much exist but much is also missing. We have only tested the used functionality. Other functionality is untested. DBT and DBTLink was written by: Svante Björklund, FOI (Swedish Defence Research Agency), Linköping University and Blekinge Institute of Technology. Tomas Boman, FOI. Anders Nelander, FOI. Jouni Rantakokko, FOI. Lars Pettersson, FOI and Linköping University. Amir Heydarkhan, FOI and Chalmers University of Technology. Fredrik Athley, Ericsson Microwave Systems and Chalmers University of Technology. David Rejdemyhr, FOI.
- 13 -
4.
How to use the toolbox
4.1
An extended Matlab/Octave language DBT is an extension of the Matlab/Octave programming language with data types and functions for signal processing in radar, especially for antenna array processing. This constitutes a language on a higher level than standard Matlab/Octave, a language that is specially suited for its purpose. The toolbox is extendible by the users. The internal interfaces, mostly Matlab/Octave structure variables, are standardized [5].
4.2
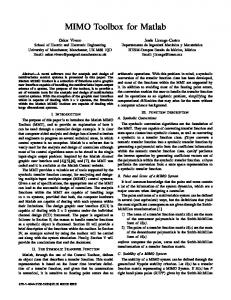
Sequence of commands A typical main program using DBT has the following sequence of commands, some of which can be omitted (see also Figure 2.4): 1. Definition of receiver antenna, including antenna element positions, rotations and patterns. 2. Definition of radar waveform, including carrier frequency, sampling frequency, PRF (Pulse Repetition Frequency) and pulse modulation. 3. Acquire a signal, simulated or measured. 4. Calibration compensation of signal or set the compensation method to be used by steering vector compensation. 5. Select data for estimation of interference correlation matrix for adaptive suppression in the conventional processing. 6. Estimate and modify the interference correlation matrix. Several steps can be made with the correlation matrix. 7. Conventional processing. Several steps can be made with a radar datacube (see Figure 2.4:). 8. For model based processing select data and estimate & modify a correlation matrix. Several steps can be made with the correlation matrix. 9. Conventional or model based detection and estimation of target parameters. 10. Present the result. For statistical analysis, surround points 3) to 9) by a normal Matlab/Octave loop (for... end) to make Monte Carlo simulations, e.g. for estimating probability of detection and false alarm. See Figure 6.5 for an example of simulation results. An example program with a circular array antenna with a radius of half a wavelength and with eight omni-directional elements is shown below. The graph created by the program are shown in Figure 4.1:. % Definition of constants. Create elements and calculate element positions: ... % Create the array: ant2 = defant('array',elemPos,[],elem2); % Generate simulated received antenna signals: sig = compsim4(ant2, lambda, 100, 'rndnw', ... [theta, .phi, SNR, alpha, dalpha, dist, ... eye(size(theta,1))], 'rndnw'); % DOA-spectrum with MUSIC and convension. beamform:
- 14 -
spect1 = sdoaspc('music',sig, smplPoints,3); spect2 = sdoaspc('cbf',sig, smplPoints); Plot both DOA spectra: splot2(spect1,'',spect2)
4.3
Documentation There are some documentation for DBT: •
Help text and comment in the code.
•
dbthelp.m is a Matlab m file whose help text lists all interesting function in DBT. This should be a help to find the appropriate function. The contents of dbhelp.m is shown in Appendix A. A copy of dbthelp.m is stored in Contents.m.
•
This report, a general description of DBT.
•
Conference papers [6, 7]
•
DBT Reference Guide: The sections about data types, coordinate systems and normalizations are pretty well updated. Other parts are not up to date. The major part of the 400+ pages is occupied by the help text of the functions in DBT. These help texts are not updated in the reference guide.
A user guide is missing. To some extent, this report can function as a user guide. There are also some old sample programs included in DBT. Several conference papers and FOI reports have been published whose results have been acquired with the help of DBT, see Section 6.
powerSpectrum 35 Directional spectrum [dB]
Music Conventional beamforming
30 Conventional Beamforming 25 20 15 10
MUSIC
5 0 −200
−100
0 100 Direction [degrees] DOA [degrees]
200
Figure 4.1: MUSIC and conventional beamforming DOA spectra for a circular array antenna.
- 15 -
4.4
System requirements DBT requires Matlab [20] around version 7 or later. Small parts of DBT also need Matlab Optimization Toolbox (some parametric DOA estimation methods) and Matlab Signal Processing Toolbox (some weighting windows or taperings, resampling of pulses and ranges). The time-frequency analysis needs the time-frequency toolbox by Auger et.al. [1]. The DBTLink GUI requires an old version of Simulink [24]. Most of DBT can be run under Octave instead of Matlab with some small changes. The most changes are still to be done.
- 16 -
5.
Radar signal acquisition Received signals in DBT can be acquired by DBT’s own signal simulation or by measured signals or by detailed electromagnetic computations.
5.1
Simulated radar signals See Section 3.2 for the signal simulation in DBT.
5.2
Measured radar signals
5.2.1
The FOI Experimental Antenna (DigAnt) At FOI, an experimental S-band receiving digital array antenna for radar applications has been designed and built [22]. The experimental antenna (5.1) consists of a linear array of 12 antenna elements, receiver modules, A/D converters and buffer memories. The antenna has an agile frequency band of 2.8-3.3 GHz and an instantaneous bandwidth of 5 MHz. I/Q-conversion, down conversion and equalizing are done in non-real time in a standard computer. The recorded signals can then be transferred to DBT for further processing.
Figure 5.1: The FOI experimental array antenna in an anechoic chamber.
5.2.2
The Arken measurement system It is also possible to use measured data acquired with the Arken system, which is a radar measurement system at FOI [14] (Figure 5.2). Some facts [13]: • Frequency band 6-18 GHz. • PRF between 0 and 100 kHz.
- 17 -
• No pulse compression. • Pulse length 0.05 - 10 µs . • Transmit power 100 W. • Duty cycle 0-100%. • Transmit polarization V/H pulse to pulse. • Reception in two orthogonal polarizations. • Each pulse is sampled with 200 MHz. This gives a range bin of 75 cm.
Figure 5.2: The Arken radar system.
5.2.3
The Saab SIRS 77 radar Measured data from the SIRS 77 radar, which is developed and manufactured by SAAB AB (Figure 5.3), can be used as input to DBT. This radar is an FMCW (Frequency Modulation Continuous Wave) radar with linear FM sweeps and a carrier frequency of 77 GHz. At the receiver the received signal is mixed with the transmitted signal and only the difference signal need to be digitized, which reduces the cost. The pulse compression (converting to ranges) is done by a FFT. The range resolution is 1 m. The Doppler filtering utilizes the phase shift between different sweeps, like in a pulsed radar. The antenna beamwidth is 1.5 degrees.
- 18 -
Figure 5.3: The SAAB SIRS 77 radar.
5.2.4
Electromagnetic computations We have used radar data from detailed electromagnetic computations as input to DBT. 3D models of persons walking and jogging were animated using a bone skeleton and skinning. The animation sequence was sampled and the 3D-geometry data was then used to calculate the radar return at each pulse using the electromagnetic (EM) components (SE-RAY-EM) of SE-Workbench from Oktal-SE. The software SE-RAY-EM uses geometrical and physical optics to compute EM propagation and scattering in the scene.
- 19 -
6.
Applications using DBT
6.1
Applications DBT has been used for numerous applications: •
DBT has been a major part of the signal processing and presentation when employing the FOI experimental antenna [22].
•
Evaluating DOA estimation methods on measured & simulated data [25]. See Figure 6.18 and 6.19.
•
Studies of model based methods for estimation of the number of targets with digital array antennas using simulated and measured signals.
•
Multipath reflections from rough surfaces have been analyzed by utilizing measurement data from the FOI experimental antenna in an anechoic chamber [26, 28] and outdoors.
•
Analysis of radar-like measurements in an anechoic chamber [4]. See Figure 6.146.17.
•
Outdoor bistatic radar measurement and analyses.
•
Outdoor radar measurements and analyses [29]. See Figure 6.20.
•
Outdoor jammer measurements and analyses.
•
Study of special jamming and jammer suppression in radar.
•
Statistical analysis of detecting a radar by ESM (Electronic Support Measures). See Figure 6.5.
•
Perform detailed radar signal simulation and signal processing in a simulator of RF multifunction systems (the MFA (MultiFunction Antenna) simulator [11].
•
Suppression of clutter with STAP for a conformal antenna on a UAV [3]. See Figure 6.8-6.13.
•
Suppression of bistatic clutter with STAP [38]. See Figure 6.4.
•
Time-Freq. analysis of moving persons, measured & simulated data [37, 39, 40]. See Figure 6.7.
•
Time-Freq. analysis of moving ground vehicles on measured data [10]. See Figure 6.6
- 20 -
Figures of examples of the use of DBT
0.15 0.1 0.05 0
z
6.2
−0.05 −0.1 0.1
−0.1 0
0
0.1 0.2 x
−0.1 y
Figure 6.1: An example of a facetted array antenna on a half cylinder. Generated by function “ex_faceted”.
Figure 6.2: uv antenna pattern for the facetted antenna in Figure 6.1 in transmit mode. The beam is steered to
[ az, el ] = [ 41.5 °, – 5.7 ° ] . [mstap387-F84-004-TxAntGainUV-01.tif]
- 21 -
Antenna pattern
Jammer positions
0 Without SLC With SLC Jammer DOA
−10
Adapted
−20
Unadapted
[dB]
−30 −40 −50 −60 −70 −80 −100
−50 0 50 DOA [degrees] azimuth angle [degrees]
100
Figure 6.3: Antenna pattern, both unadapted and adapted to jammers at DOA 40° and 60°.
Transmitter
Receiver
Figure 6.4: SINR with optimal space-fast-time STAP. With interference (clutter, direct signal) and noise. For each target position the received signal is processed by optimal fasttime STAP to exactly that position. Stationary transmitter, receiver and target. Isotropic transmitter antenna and eight-element linear array receiver antenna. DBT was used for the modelling of the radar system and the target, clutter and direct signal via steering vectors. Figure from [9].
- 22 -
Pd (sis119) 1 1.0e−04 1.0e−06 0.9
0.8
0.7
0.6
0.5
0.4
0.3
0.2
0.1
0 −2
0
2
4
6
8 SNR [dB]
10
12
14
16
18
Figure 6.5: Estimated radar ESM (Electronic Support measures) probability of detection and false alarm with the aid of Monte Carlo Simulations. (sis119).
Figure 6.6: Time-frequency representation using STFT on the radar pulses. Measurements on a tracked vehicle, which is stationary from the beginning, then accelerates, keeping a nearly constant speed and then brakes to still again. DBT was used for management and processing of measured radar signals. Figure from [10].
- 23 -
Figure 6.7: Time-frequency representation using STFT on the radar pulses from the SIRS 77 radar. Measurements on a walking person. The strong returns at 0 m/s is the ground clutter and at around 1.2 m/s is the body of the person. The other visible structure are the arms and legs moving. DBT was used for management and processing of measured radar signals.
Figure 6.8: Interference DOA Doppler spectrum. Side-looking planar antenna Q82. DBT was used for the modelling of the radar system and the clutter via steering vectors.
- 24 -
mstap235eig2−2 (2009−09−03 18:27): Clutter Eig.Spect. −120 −140 plane P82 −160
smooth S82 facet F82
Eigenvalue [dB]
−180 −200 −220 −240 −260 −280 −300 −320
100
200
300
400 500 600 Eigenvalue number
700
800
Figure 6.9: Clutter eigenspectrum. Comparing antennas F82, S82 and P82.
mstap208 (2009−07−06 20:10): Clutter corr mat. [dB] −120 −140 −160 Eigenvalue [dB]
−180 −200 −220 −240 −260 −280 −300 −320
50
100 150 Eigenvalue number
200
250
Figure 6.10:Clutter eigenspectrum. Side-looking planar antenna Q82.
- 25 -
Figure 10. Interference (clutter plus receiver noise) DOA Doppler spectrum. Antenna F88 (forward-looking faceted half-cylinder antenna with 14 non-overlapping 8x8 facets and subarrays). Slant range 3 km.
Figure 11. Interference (clutter plus receiver noise) DOA Doppler spectrum. Antenna S88 (forward-looking smooth half-cylinder antenna with 14 non-overlapping 8x8 subarrays). Slant range 3 km.
Figure 12. Interference (clutter plus receiver noise) Figure DOA Doppler spectrum. Antenna P88 (forward-looking planar antenna with 8 non-overlapping 8x8 subarrays). Slant range 3 km.
Figure 6.11:Interference (clutter plus receiver noise) DOA Doppler spectra for three types of conformal forward-looking antennas. DBT was used for the modelling of the radar system and the clutter via steering vectors. Figures 10-12 in [3]. Eigenvalue distribution −50
P84
−100
Noise power
S84
−150
−200
F84
mstap290−F84−005−ClutEigVals1.mat
−250
mstap291−S84−005−ClutEigVals1.mat mstap292−P84−005−ClutEigVals1.mat
−300
0
10
20
30
40
50
60
70
80
90
100 %
Figure 6.12:Clutter eigenspectrum, normalized the number of eigenvalues to 100%. Comparing antennas F84, S84 and P84. Slant range 3km. Scan angles –34° . Figure 6 in [3].
- 26 -
−80 mstap290−F84−2−TotalSpecSwitch.mat mstap291−S84−2−TotalSpecSwitch.mat
−90
mstap292−P84−2−TotalSpecSwitch.mat
−100
−110
−120
P84
−130
Noise power + 3dB
S84
F84 −140
Noise power −150
0
10
20
30
40
50
60
70
80
90
100 %
Figure 6.13:Interference Sorted DOA Doppler spectrum (SDDS). Comparing antennas F84, S84 and P84. Slant range 3km. Figures 7 in [3].
Direction−range slice.
DOA spectrum
1
1
0.5
0.5
0 200
0 200 150
150
50 100
0
50 Range bins
−50
50 100
0
50 Range bins
Direction [degrees]
Figure 6.14:Absolute value for doppler frequen-
−50
Direction [degrees]
Figure 6.15:MUSIC DOA pseudo spectrum af-
cy 2.0 kHz after pulse compression, doppler filtering and CBF. No tapering in any dimension was used. Solid dark lines indicate the real positions of the targets. DBT was used for calibration and for management and processing of measured radar signals. Figure 14 in [4].
- 27 -
ter pulse compression and doppler filtering. No tapering in any dimension was used. Measured radar signal after MUSIC spectrum estimation on each range bin separately. Solid dark lines indicate the real positions of the targets. DBT was used for calibration and for management and processing of measured radar signals. Figure 15 in [4].
Range bin 74
Range bin 97
5
5
MUSIC Conv. beamform.
MUSIC Conv. beamform.
0
0
−5
−5
−10
−10
−15
−15
−20
−20
−25
−25
−30
−30
−35 −50
0 Direction Direction[degrees] [degrees]
50
Figure 6.16:Directional spectra for CBF and MU-
−35 −50
beamforming and MUSIC at range bin 97 and doppler frequency 2.0 kHz. No tapering of CBF. We know that the peak at 0° for MUSIC is probably false because of information from the conventional detection. The vertical dash dotted lines at – 13° and 0° are the true DOAs but the targets have different range. DBT was used for calibration and for management and processing of measured radar signals. Figure 17 in [4].
(100%) (100%) (100%) (100%) (100%)
(100%)
DOA [degrees]
1.5
1
0.5
0
−0.5 0
0.2
0.4 0.6 0.8 1 1.2 True DOA separation [degrees]
1.4
1.6
Figure 6.19:WSF DOA estimation as a function of DOA separation. DBT was used for calibration and for management and processing of measured radar signals. Figure 10 in [25].
- 28 -
50
Figure 6.17:Directional spectra for conventional
SIC at range bin 74 and doppler frequency 2.0 kHz. No tapering of CBF. We know that the peak at – 13° for MUSIC is probably false because of information from the conventional detection. The vertical dash dotted lines at – 13° and 0° are the true DOAs but the targets have different range. DBT was used for calibration and for management and processing of measured radar signals. Figure 16 in [4].
2
0 Direction [degrees] Direction [degrees]
2
(0%)
(14%) (44%) (80%) (98%)
(100%) Probability for 2 DOAs
1.5
DOA [degrees]
True DOAs on these lines 1 Mean + std.dev. Mean value Mean - std.dev. 0.5
2nd of the 2 DOAs A single DOA
0 1st of the 2 DOAs −0.5 0
0.2
0.4 0.6 0.8 1 1.2 True DOA separation [degrees]
1.4
1.6
Figure 6.18:Min-Norm DOA estimation versus DOA separation. The mean values are shown by short horizontal lines. A vertical line is joining the two standard deviation arrows. At the top there are percent numbers telling the probability of resolving the two sources. For the measurements when they are not resolved, a third vertical line with mean value and standard deviation markers for the single estimated DOA is plotted just to the right of the two vertical lines for two resolved DOAs. The true DOAs lie on the dashed lines. DBT was used for calibration and for management and processing of measured radar signals. Figure 6 in [25].
House
FOI building
Tree groups Unknown/False
Fence Tree ridges
Figure 6.20:A FM-sweep measurement processed with Capon’s beamformer. The radar returns are on top of background height data. Figure 13 in [29].
- 29 -
6.3
Application software Software packages using DBT at FOI: EXPANT: Processing of measured data from the FOI Experimental Antenna (DigAnt). See Section 5.2.1 BSTAP: Studies of Space Time Adaptive Processing in monostatic or bistatic radar. HWSTAP: Studies of Space Time Adaptive Processing in the presence of hardware errors. MFA simulator: A simulator of RF multifunction systems [11]. RADAR-ATR, DOPPLERRADAR and MUDAC: Processing of measured or simulated data for micro-Doppler analysis. SISRAR: ESM (Electronic Support Measures). AESA-SIM: A simulator of AESA radar systems.
- 30 -
7.
DBTLink - A graphical block interface to DBT Parts of DBT has a GUI (graphical user interface) using Simulink [24] This GUI to DBT is called DBTLink [7]. It is what The MathWorks, the manufacturer of Matlab and Simulink, calls a Simulink block set. See Figure 7.1, 7.2, 7.3 and 7.4. DBTLink requires an old version of Simulink.
Figure 7.1: A sample DBTLink model with antenna definition, signal definition and simulation, pulse compression, DOA estimation and plots. The parameter window for one of the target definition blocks is shown to the right.
Figure 7.2: An example with adaptive beamforming with DBTLink.
- 31 -
Figure 7.3: The main block library in DBTLink.
Figure 7.4: Sublibrary and subsublibrary in DBTLink
- 32 -
8.
Comparison with Matlab Phased Array System Toolbox The new Matlab Phased Array System Toolbox (PASTB) [32] was launched 2011 by Mathworks. Comparing DBT and PASTB we notice that the functionality is similar [34]. Also PASTB has a focus on radar even if this is not explicitly said. DBT has also been used for non-radar applications, e.g. sonar, ESM and general DOA estimation. There are some differences in the contents of DBT and PASTB. Some functionality and features are only present in DBT, others only in PASTB. Especially important for us is that PASTB does not have a clutter simulation. The clutter signals used in some examples are loaded from disk. Clutter simulation is complicated and time-consuming. Clutter signals are needed for many studies. The architectures of DBT and PASTB are different. DBT consists of functions which operate on special datatypes, implemented by Matlab structures. The structures must be handled manually. There are many explicit error checks everywhere in the code. This is not true object orientation (OO) but a kind of manual OO with some kind of “objects”. The reason is DBT’s history with no OO in Matlab at the start of the DBT development. PASTB uses Matlab’s OO and therefore gets much for free. DBT signals are packaged together with metadata about the signal in signal “objects”. The metadata contain the used waveform & antenna, the history of the performed processing on the signal, etc. This makes the signals easy to handle for the user. Much is automatically handled. The user of PASTB has to manage all signal metadata manually. The execution of the processing in PASTB is done by calling the method or function “step” on the processing object. The fact that all processing is called “step” makes the code hard to read and understand. The programmer must give explaining names to the processing objects or write a comment for every code line. Mathworks, however, states some advantages with their approach [33]. In PASTB the processing, e.g. pulse compression or DPCA clutter filter, are represented as objects but the signals are not objects. In DBT, see Figure 2.4, the connections/interfaces between the blocks are objects but not in PASTB while the blocks are objects in PASTB but not in DBT. DBT has more high-level functions for simulation and processing than PASTB. In PASTB the user has to write these him/herself or use the supplied examples. PASTB has a better documentation and PASTB is probably safer and easier to use thanks to the true OO. PASTB most likely requires a recent Matlab version to run. It also requires two Mathworks Matlab toolboxes. DBT can be run on a recent or older Matlab version or with some changes on Octave [21]. For some functionality up to three Mathworks Matlab toolboxes and some free Matlab/Octave toolboxes are needed. For us it is important not to be dependent on one supplier of the interpreter/compiler. We have invested much in DBT and in application programs. See also [2] for the comparison with PASTB.
- 33 -
References [1] [2]
[3]
[4]
[5]
[6]
[7]
[8]
[9] [10] [11]
[12] [13]
Auger F., Flandrin P., Goncalves P., Lemoine O.: "The Time-Frequency Toolbox", Matlab toolbox, , 2007-10-27. S. Björklund: “The Design, Development and Use of a Matlab Toolbox for Radar Modeling, Signal Simulation and Processing”, To be submitted to IRS 2013 (International Radar Symposium 2013), Dresden, Germany, June 19-21, 2013. Björklund S., Boman T., Nelander A.: "Clutter Properties for STAP with Smooth and Faceted Cylindrical Conformal Antennas", The 2010 IEEE International Radar Conference , Washington DC, USA, May 10-14, 2010 Björklund S., Grahn P., Pettersson L., “Radar-Like Measurements with an Experimental Digital Beamforming Array Antenna”, Proc. of the International Radar Symposium IRS 98, Munich, Germany, 15-17 Sept. 1998, pp. 993-1002. Björklund S., Rejdemyhr D.: “DBT release 2.156. A MATLAB Toolbox for Modeling, Simulation and Signal Processing in Radar. Draft Reference Guide.”, FOI-D--0448--SE, FOI 2012. Björklund S., Rejdemyhr D.: “A MATLAB Toolbox for Radar Array Processing”, Proceedings of ISSPA `99 (IEEE Fifth International Symposium on Signal Processing and its Applications), August 22-25, 1999, Brisbane, Australia. pp. 547-550. Björklund S., Rantakokko J.:“An Interactive Software Demonstrator of Radar Array Processing”, Proceedings of the IEEE Nordic Signal Processing Symposium NORSIG 2000, June 13-15, 2000, Kolmården, Sweden, pp. 61-64. Björklund S., Grahn P., Nelander A.: “Analysis of Array Antenna Measurements with a Rough Surface Reflector”, Proceedings of 34th Asilomar Conference on Signals, Systems, and Computers, Pacific Grove, CA, USA, October 29 November 1, 2000. Björklund S., Nelander A.: “Fast-Time STAP for Clutter Suppression in Bistatic Radar. ”, FOI, under preparation. Björklund S.: “Analysis of some measurements for target recognition in radar. Draft”, FOI 2007. T. Boman, R. Malmqvist, C. Samuelsson, A. Gustafsson, R. Baggen: “Antenna RF-system Simulation Including Hardware Artifacts”, EuCAP’2010, 4th European Conference on Antennas and Propagation, 12-16 April 2010, Barcelona, Spain CVS, Concurrent Versions System, , . Gadd S.: “Radarsensorer för upptäckt, klassificering och inmätning” (“Radar sensors for detection, classification and estimation”), OH slidses of a presentation at the FOCUS workshop 2007-10-31 at FOI, Linköping, in Swedish.
- 34 -
[14] Gadd S., Gustavsson J., Jonsson N.-U., Karlsson N., Wilow M.: “ARKEN, a measurement system for dynamic fill-scale RCS measurements and ECM evaluations in operational environments”, presented at Antenna measurement techniques association, AMTA 2003, Irvine Southern California, 2003. [15] GNU General Public License, . [16] Guerci J.R.: “Space-Time Adaptive Processing for Radar”, Artech House 2003. [17] Jankiraman M.: "Design of Multi-Frequency CW Radars", Scitech Publishing, Inc 2007, ISBN 1-891121-56-1. [18] Komarov I.V., Smolskiy S.M.: "Fundamentals of Short-Range FM Radar", Artech House, 2003, ISBN 1-58053-110-5. [19] Krim H.,Viberg M.:”Two Decades of Array Signal Processing Research”, IEEE Signal Processing Magazine, July 1996, pp. 67-94. [20] Matlab, Programmable software for numerical computations and data visualization, . [21] Octave, Programmable software for numerical computations and data visualization, . [22] L. Pettersson, M. Danestig, U. Sjöström, “An Experimental S-Band Digital Beamforming Antenna”, IEEE Aerospace and Electronics Systems Magazine, Nov. 1997, pp. 19-26. [23] L. Pettersson: “An S-band Digital Beamforming Antenna: Design, Procedures and Performance”, FOA Report FOA-R--99-01162-408--SE, 1999. [24] Simulink, Simulation software with block diagram GUI, . [25] Björklund S., Heydarkhan A.: “High Resolution Direction of Arrival Estimation Methods Applied to Measurements from a Digital Array Antenna”, Proc. of IEEE SAM 2000 (First IEEE Sensor Array and Multichannel Signal Processing Workshop), 16-17 March 2000, Cambridge, MA, USA. [26] Björklund S., Grahn P., Nelander A.: “Analysis of Array Antenna Measurements with a Rough Surface Reflector”, Proceedings of 34th Asilomar Conference on Signals, Systems, and Computers, Pacific Grove, CA, USA, October 29 November 1, 2000. [27] Björklund S.: “Analysis of Hot Clutter in Radar using Spatial Data“, FOA-R-00-01807-408--SE, December 2000. [28] Björklund S., Grahn P., Nelander A., Pettersson M.I.: “A Study of Rank and Other Properties of Hot Clutter by Spatial Data”, Report FOI-D--0353--SE, FOI December 2009. [29] Grahn P., Björklund S.: “Short Range Radar Measurements with an Experimental Digital Array Antenna”, Proc. of the IEEE International Radar Conference RADAR 2000, May 7-12, 2000, Alexandria, VA, USA. [30] Pettersson L.: “An S-band Digital Beamforming Antenna: Design, Procedures and Performance”, FOA Report FOA-R--99-01162-408--SE, 1999.
- 35 -
[31] Ward J., “Space-Time Adaptive Processing for Airborne Radar”, MIT Lincoln Laboratory, Technical Report 1015, 1994. [32] “Phased Array System Toolbox 1”, The Mathworks Inc. 2011, . [33] “Phased Array System Toolbox 1, Getting Started Guide”, The Mathworks Inc. 2011, . [34] “Phased Array System Toolbox 1, User’s Guide”, The Mathworks Inc. 2011, . [35] Liu Bo, Wenzhong, “The Application of MATLAB Programming in Signal Processing”, Publishing House of Electronics Industry, 2006, ISBN 7-12102242-7, Book in Chinese. [36] Wilson H., Gardner B.: “Integration”, an Octave Forge Package, , 2007-09-25. [37] H. Petersson, S. Björklund, M. Karlsson, A. Lauberts: “Towards surveillance using micro-Doppler radar”, IRS (Internat. Radar Symp.) 2009, 9-11 Sept., Hamburg. [38] S. Björklund, A. Nelander: “Fast-Time STAP for Clutter Suppression between Transmitter and Receiver in Bistatic Radar”, Proceedings of SEE International Radar Conference, RADAR 2009, Bordeaux, France, 12-16 October 2009. [39] S. Björklund, H. Petersson, A. Nezirovic, M. B. Guldogan, F.Gustafsson: “Millimeter-Wave Radar Micro-Doppler Signatures of Human Motion”, International Radar Symposium (IRS 2011), Leipzig, Germany, September 7 9, 2011. In IE3 Xplore [40] S. Björklund, T. Johansson, H. Petersson: “Evaluation of a Micro-Doppler Classification Method on mm-Wave Data”, Accepted forIEEE Radar Conference 2012, May 7-11, 2012, Atlanta, USA.
- 36 -
A:
Function list This list of function in DBT is a copy of the help file dbthelp.m 2012-02-10: %DBTHELP Help file for the DBT toolbox, with an overview of functions. % % DBT, A Matlab Toolbox for Radar Modeling, Signal Simulation and Processing. % (c) FOI 1994-2012. See the file dbtlicense.m for license agreement. % %For an overview of the toolbox, see reference [2]. %The following are functions for the end user: % %ANTENNAS : % defant : Defines an antenna. % pantpat4 : Plots the antenna pattern (mechanical scan) of an antenna. % dispantenna : Displays information about antenna definitions. % gettap1 : Calculates several taperings for conventional beamforming. % normbeamspacetrans : Normalize a beamspace transformation matrix (beamforming % to analog subarrays). % calcgainantenna: Computes the antenna gain. % checknormantenna: Checks that the antenna gain is correctly normalized. % iselement : Returns true if the input is an antenna element definition. % orthbeam : Orthogonalization of beamforming weights. % setsubarraydoa : Sets pointing direction of analog subarrays. % getsubarraydoa : Gets pointing direction of analog subarrays. % %ANTENNA ELEMENT defintions (used with ‘pattFuncElem4’ in function “defant”) : % pattisotrop : Isotrop antenna pattern function. % patthalfwavelengthdipole : Lossless resonant half-wavelength dipole antenna pattern. % patthertzdipole : Hertian dipole antenna pattern. % pattrecttheta : Rectangular antenna pattern in the theta angle. % patttrapeztheta : Trapezoid antenna pattern in theta angle. % pattcosa1 : Cos antenna pattern in the theta and phi angles. Zero back lobes. % %RADAR WAVEFORMS and MODULATIONS : % setwaveformparam: Returns radar parameters suitable for simulation given % desired radar parameters. % defwave : Defines a waveform (radar time properties, like PRF and range % resolution) for use with, for example, “simradarsig”. % getmod : Generates a pulscode modulation, e.g. Barker 13 or Chirp, % for use with for example “defwave” and “pulscomp”. % getwaveform : Gets the waveform definition in a radar system or radar signal. % %RADAR SYSTEMS : % defradarsys : Defines a radar system, e.g. used in clutter simulation. % getradarparam : Gets various radar parameters in an easy way. % dispradarparam: Displays some timing and range information about a pulse % radar. % getradarbandtxt: returns the name of a radar band. Not finnished. % calcsinrstap: Returns SINR for optimal and adaptive full STAP or fix processing. % rectargetpower: Computes received target power. Finnished? % recnoisepower: Computes receiver noise power. Finnished? % dop2vel : Converts from Doppler frequency to velocity. % vel2dop : Converts from velocity to Doppler frequency. % speedoflight : Returns the speed of light in empty space.
- 37 -
% pdetection : Computes the probability of detection for a constant nonfluctuating target. % %STEERING VECTORS (temporal and spatial radar models): % spastemat : Returns the ideal spatial steering matrix. % dspastemat : Returns the derivative of the ideal (spatial) steering % matrix. % pulstemat : Returns the ideal pulse (slow-time) steering matrix. % ranstemat : Returns the ideal range (fast-time) steering matrix. % spapulstemat: Returns the ideal space-pulse (space-slow time) % steering matrix. % sparanstemat: Returns the ideal space-range (space-fast time) % steering matrix. % pulvelstemat: Calculation of phase shift due to clutter Doppler % for a moving radar. % %RADAR SIGNAL SIMULATION : % simradarsig : Simulates received radar antenna signals (active mode). % deftarget : Defines a target for the function “simaradarsig”. % defrcs : Defines Radar Cross Section of targets. Not finnished. % defnoise : Defines a noise for the function “simaradarsig”. % defclutter2 : Defines clutter for the function “simaradarsig”. % defjammer : Defines a jammer for the function “simaradarsig”. Not finnished. % defsources : Combines several signal source definitions from the % functions “deftarget”, “defnoise”, “defclutter”, % “defjammer” to a single input parameter to “simradarsig”. % adddopplershift: Adds a Doppler shift to a radar signal. % %NON-RADAR SIGNAL SIMULATION : % compsim4 : Simulates received antenna signals. Only one range bin % (passive mode). % simwidebandkernel : Simulates wideband radio signals received with array % antennas. Only one range bin (passive mode). % simwideband : Like simwidebandkernel but with other input parameters. % %MODEL ERRORS : % simcherr2 : Simulates channel amplitude, phase and quadrature signal errors. % % CMTs (Covariance Matrix Tapers) is a way to model hardware and external % imperfections in the received signal correlation matrix, see [8,9,10]. % The implementation of CMTs is not tested yet. % genspacmt : Generates a spatial CMT (Covariance Matrix Taper). Possible % model errors are: Constant gain & phase errors, channel % frequency response mismatch, channel cancellation ratio, % DOA dependent channel mismatch (not implemented). % genpulcmt : Generate a pulse (Doppler, slow-time) CMT (Covariance Matrix % Taper). Possible model errors are: Internal clutter motion, % range bin walk (implementation not finnished), constant gain % & phase errors, random uniform gain and phase channels missmatch. % combinecmt : Combines CMTs and/or correlation matrix. % combinespapulcmt :Combines independent space & pulse CMTs into one % space-pulse CMT. % iscmt : Tests if the input is a CMT (Covariance Matrix Taper). % %MEASURED signals from the FOA DIGANT ANTENNA : % expsig1 : Gets measured antenna signals.
- 38 -
% setcal1 : Sets calibration compensation to use with sdoaspc, % sdoapar1 etc. via spastemat. % sigcomp2 : Does calibration compensation on the signals. % dbsfileinfo : Displays information about a DBS-file (radar signal data). % dbcfileinfo : Displays information about a DBC-file (calibration data). % %MEASURED and SIMULATED signals from other sources: % In the CVS source project “radar-atr” there is an interface to Arken radar data. % In the SVN source project “DopplerRadar” there is an old interface to SIRS77 radar data. % A newer interface to SIRS77 radar data is in the SVN source project “svn_mudac”. % There is also an interface to EM simulations by Mikael Karlsson. % %RADAR SIGNAL variable MANAGEMENT : % sigsize : Returns the size of a radar signal. See also “getradarparam”. % getsubsig : Gets a original part of a radar signal. % sigsubix : Gets a current part of a radar signal. % addsig : Adds two radar signals. % sigsplitdim : Splits a dimension in a radar signal into two dimensions. % sigswapdim : Swaps two dimensions in a radar signal. % normcohpulse: Makes a radar signal coherent between pulses. % normsig : Normalizes a radar signal or a spatial correlation matrix % relative the noise power (by smallest eigenvalues). % RxRadarSigT : Creates a variable of the data type “RxRadarSigT”, i.e. % a radar signal. % msigmat2 : Rearranges the received antenna signals to a multi% dimensional matrix with time, distance and direction as % indices. % mat2radarsig: Converts a matrix with antenna data to % RxRadarSigT format in passive mode (only one range bin). % %FIND a PART OF a RADAR SIGNAL : % ran2ranbin : From ranges to range bins and computes range bin % length. % dop2dopchan : From Doppler frequencies to Doppler channel indicies % and Doppler channel width. % vel2dopchan : From radial velocities to velocity channel indicies % and velocity channel width. % Functions ran2ranbin, dop2dopchan, vel2dopchan uses a % waveform definition and gives the range bins and Doppler % channels in an original radar signal. % % ran2ix : Converts from ranges to current range bin indices. % vel2ix : Converts from velocities to current Doppler channels indices. % doa2ix : Converts from DOAs to current spatial indices. % time2ix : See below under “ANALYSIS of a RADAR SIGNAL”. % Functions ran2ix, vel2ix, doa2ix, time2ix uses the present % ranges, Doppler frequencies, and times in a radar signal. % They can be used with function “sigsubix” to pick out a % part of a radar signal. % % time2pulse : Return the number of pulses for an coherent integration time. % See also “getsamppulint”. % ranbin2ix : Converts from range bins to current range bin indices. % [dopchan2ix] : % [spachan2ix] :
- 39 -
% % sig.pulIx(curPulIx) : Converts from current to original pulse indices. % sig.ranIx(curRanIx) : Converts from current to original range indices. % sig.spaIx(curSpaIx) : Converts from current to original space indices. % % sig.freqPos(curPulIx) : Converts from current range indices to times % or Doppler frequencies. % sig.ranPos(curPulIx) : Converts from current range indices to ranges. % sig.doaPos(curPulIx,:) : Converts from current range indices to DOAs. % % origix2ix : Converts from original indices to current indices. % origix2ran : Converts from range bin indices to ranges in meter. % %Easy-to-use RADAR SIGNAL PROCESSING functions: % beamform : Conventional beamforming with or without tapering and % with or without side lobe cancellation. Calls function “spafilt”. % pulscomp : Performs pulse compression or noncoherent integration % in the range dimension. % dopplerfilt : Dopplerfilter bank by correlation. Calls function “pulfilt”. % dfb2 : Doppler filter bank by FFT. Fast and simple. % clutterfilt1: Ideal clutter filtering in frequency domain for stationary radar. % videoint : Video integration (incoherent summation) of several CPIs. % rrdetect1 : Radar detection including CFAR (Constant False Alarm Rate). % rrextract2 : Estimation of number of targets and of target range, direction % and Doppler. % estvelran1 : Estimate radial velocity and range to a single strong target. % %Estimation of NUMBER OF SIGNAL SOURCES : % spanosrc : Estimates the number of signals sources using spatial % information. % aic : Estimates the number of signals by An Information Criterion (AIC). % mdl : Estimates the number of signals by Minimum Description Length (MDL). % rrextract2 : Estimation of number of targets and of target range, direction % and Doppler for detections. % %More general RADAR SIGNAL PROCESSING functions: % spafilt : Spatial filtering (beamforming). Several methods. % Uses function “calcfiltproc”. % pulfilt : Pulse (slow-time) filtering (doppler filtering). % Several methods. Uses function “calcfiltproc”. % ranfilt : Range (fast-time)filtering (pulse compression). % Several methods. Uses function “calcfiltproc”. % spapulfilt : Space-pulse (space-slow time) linear filtering % (slow-time STAP). Several methods. Uses function “calcfiltproc”. % sparanfilt : Space-range (space-fast time) linear filtering % (fast-time STAP). Several methods. Uses function “calcfiltproc”. % plotspacetimedata1: Plot a space-time quantity. % plotsinr1 : Computes and plots SNR and SINR for nonadaptive and adaptive STAP. % %WEIGTING functions: % taylorwin : Calculates Taylor weights (Signal Processing Toolbox). % More robust than “taylorlp”. % chebwin : Calculates Chebyshev weights (Signal Processing Toolbox). % More robust than “chebylp”. % taylorlp : Calculates Taylor weights. Use “taylorwin” instead if available.
- 40 -
% chebylp : Calculates Dolhp-Chebychev weights. Use “chebwin” instead % if available. % bartlett : Calculates Bartlett weights (Signal Processing Toolbox). % blackman : Calculates Blackman weights (Signal Processing Toolbox). % hamming : Calculates Hamming weights (Signal Processing Toolbox). % hanning : Calculates Hanning weights (Signal Processing Toolbox). % kaiser : Calculates Kaiser weights (Signal Processing Toolbox). % triang : Calculates triangular weights (Signal Processing Toolbox). % %ANALYSIS of a RADAR SIGNAL (some special analyzes): % sigplot2 : Plots a 1D- or 2D-slice of a radar signal. % sigplot2win : Interactiv version of “sigplot2” via a GUI. % sigestpower : Estimates the power of a radar signal. % estnoisepower: Estimates the noise power in a radar signal (by smallest % eigenvalues). % sighist : Plots a histogram of a radar signal. % examsigw : Examines a received radar signal waveform in various ways. % estlocalfreq : Estimates the local (instantaneous) frequency of a signal. % pultimefreqanalys : Time-frequency analysis (TFA) of the pulse dimension of % a radar signal. % getsamppulint : Returns number of pulses for a certain integration time. % For input to “pultimefreqanalys”. See also “time2pulse”. % perioddoppleranalys1 : Period analysis (PDA) of Doppler in a Time-Frequency signal. % time2ix : Converts from times to current indices in a TFA or PDA. % freqlineup : Lines up the frequencies in a time-frequency representation % around a reference frequency. % %SPECTRAL DOA ESTIMATION (“BEAMFORMING “). % sdoaspc : Estimates a DOA-spectrum with different methods. % Implemented methods are Conventional beamforming, Capon, % Music, Min-norm. % doaspc1 : Like sdoapar but with som extra input parameters. % splot2 : Plots one or more DOA spectrums. % doapeak : Finds the peaks of a DOA spectrum. % doaspc2sig : Converts a DOA spectrum to a radar signal so that it can be % plotted with functions intended for radar signals. % doaspc2sigamp: Converts a DOA spectrum (DoaSpecT) to a (amplitude) radar % signal (RxRadarSigT). % DoaSpecT : Creates a variable of the data type “DoaSpecT”, i.e. % a DOA spectrum. % %PARAMETRIC DOA ESTIMATION : % sdoapar1 : Estimates DOA:s with different methods. Implemented % methods are DML, SML, PTMF, WSF, SSF, Root Music, ESPRIT. % Two of the methods need Matlab Optimization Toolbox. % doapar1 : Like sdoapar but with som extra input parameters. % stardoa : Finds the startvalues for parametric algorithms. % pdoapar : Presents on the screen information about DOA:s. % pdoait : Plots the DOA:s for all iterations from PTMF. % perrfun : Plots the error function for all iterations from PTMF. % %Spatial CORRELATION MATRICES : % basecorrm : Base estimate of the antenna signal correlation matrix. % ecorrm : Antenna signal correlation matrix estimate or modfication % of the estimate.
- 41 -
% theospacorr : Theoretical spatial correlation matrix. % RxCorrMatT : Creates a variable of the data type “RxCorrMatT”, i.e. % spatial correlation matrices. % eigplot1 : Plots the eigenvalues of correlation matrices. % correig2sig : Calculates the eigenvalues of correlation matrices and % converts the result to a radar signal so that it can be % plotted with functions intended for radar signals. % plotcorrmat1: Plot correlation matrix, both amplitude and eigenvalues. % corrmplot : Plots a spatial correlation matrix. % Look also at the functions getcorrm, modcorrmkernel and getcorrmkernel below. % %General CORRELATION MATRICES (often called “covariance matrices”): % Look also at the functions getcorrm, modcorrmkernel and getcorrmkernel below. % %Showing INFORMATION : % dbthelp : This help file. % dbtinfo : Displays information messages. Can be turned on and off. % dbtwarning : Displays warning messages. Can be turned on and off. % dbterror : Displays an error message and halts execution. % dbtversion : Return the version number of this release of DBT. % dbtrefguide : Shows the DBT reference guide on the screen. % %GEOMETRY : % d2r : Converts from degrees to radians. % r2d : Converts from radians to degrees. % uvdbt2doa : Converts from UvDbtT to DoaT coordinate system. % uv2doa : Converts from standard uv to DoaT coordinate system. % doa2uv : Converts from DoaT to standard uv coordinate system. % doa2rect : Converts from DOA coordinates to rectangular coordinates. % rect2doa : Converts from rectangular coordinates to DOA coordinates. % sph2rect : Converts from standard spherical coordinates to rectangular coordinates. % rect2sph : Not finnished. % sph2doa : Converts from standard spherical coordinates to DOA coordinates. % doa2wavevec : Computes the wavevector for several waves. % wardsph2doa : Converts from the spherical coordinate system used in % [Ward94] to the spherical coordinate system used in DBT. % getdoarotmat: Return rotation matrix(ces) for a Doa and a normal angle. % getrotmat : Return a rotation matrix around the x, y, z or some other axes. % isrotmat : Checks if a matris is a rotation matrix. % plotrotsys1 : Plots a rotated coordinate system. % isunitvector: Tests if one or more vectors all have length one. % %MATLAB MATH : % isrotmat : Checks if a matris is a rotation matrix. % isorthonormal:Checks if a matrix is orthonormal. % randcxgauss : Generates complex valued Gaussian numbers. % randidbt : Random integers from a uniform distribution. % vecnorm2 : Computes the euclidean norm (2-norm) of several vectors. % vecnorm22 : Computes the square of the euclidean norm (2-norm) of several vectors. % normalizevecs: Normalize several vectors to length one. % weightrows : Weights the rows of a matrix. % weightcols : Weights the columns of a matrix. % multdiag : Returns the diagonal of a product of two matrices. % dftopm : Generates a DFT operator matrix, defined as the Matlab FFT. % dftopm2d : Generates a 2D-DFT op. matrix, defined as the Matlab FFT2.
- 42 -
% fftshift1 : Shift DC component to or from center of spectrum for % several 1D spektra. % normplot2 : Normal probability plot. % ploteigspec1: Plot eigenspectra. % %MATLAB and OCTAVE PROGRAMMING : % assertequalparams : Asserts that values are equal. % assertnonnegative : Asserts non-negative values. Compare “chkdtype”. % assertreal : Asserts that only real values. Compare “chkdtype”. % assertsequence : Asserts that the elements of a vector is in a sequence. % isoctave : Checks if Octave is running. % omeps : Octave compatibility function for Matlab’s EPS. % dbtstop : Simulates Matlab’s DBSTOP. Especially for Octave. % dbtclear : Simulates Matlab’s DBCLEAR. For use with Octave. % getpercentlarger : Get % and no. of elements in vector larger than a limit. % helpd : Displays Matlab helptext with ‘more on’. % helpwin2 : Displays Matlab helptext in separate window. % changeallelemchar: Changes the ‘:’ character to a vector for subscripting. % squeezeall : Remove all singleton dimensions, including dimension one. % isvarinfile : Checks whether a variable exists in a MAT file. % istype : Checks whether a variable is of certain type(s). % chkdtype : Generates an error if a variable is not of the desired % data type. Uses “chkdtyph”. % chkdtyph : Returns 0 if the variable has an allowed datatype and % 1 otherwise. is used by “chkdtype”. % db2linamp : Converts from power value in dB to linear amplitude scale. % db2linpow : Converts from power value in dB to linear power scale. % xmin,xmax : Sets the minimum and maximum on the x-axis. % ymin,ymax : Sets the minimum and maximum on the y-axis. % zmin,zmax : Sets the minimum andr maximum on the z-axis. % xlim,ylim,zlim: Sets the minimum and maximum on the x-, y- and z-axis. % setcaxis : Sets the lower, higher or both values of the color axis. % setmincaxis : Sets the lower value of the color axis. % setcaxisdynlow: Sets the color axis to get a specified dynamic. % getcaxis : Gets the lower or higher value of the current color axis. % adjustprefix: Adjust pefix of quantities for plotting etc. % plot3ddata : Plots a 2D matrix in a 3D plot % plotxline : Plots straight lines at specified x-positions. % plotyline : Plots straight lines at specified y-positions. % plotaline : plots straight lines at specified xyz-pos:s. % addplotmarkers1 : Mark a plotted curve with a small number of markers. % titleresult : Graph title with extra information like date. % genfreqaxis : Generates values for a frequency axis used at plotting etc. % gaussspace : Vector spaced nearly as a Guassian PDF. % % printfigs : Prints several figures, also suitable for FrameMaker. % printfm : Save a Matlab figure suitable to import in FrameMaker. % savefigs : Saves several figures. % setfigpos : Sets the sreen position where figures will be placed. % setfigname : Set the name of a figure window. % getfighandle: Gets the figure handle from a figure name. % isfigname : Checks if there is a figure with a certain name. % listfigs : List all Matlab figures. % closefigs : Close several figures. % coa : = “close all”.
- 43 -
% fig 5 : = “figure(5)”. % openfigs : Open Matlab figure (FIG) files. % irot : = “rotate3d”. Interactive 3D rotation of a plot with the mouse. % finddatafile: Finds a datafile of some possible types on the Matlab path. % rmsubpaths : Removes directory topDir and all subdirectories from the % Matlab path. Useful for not using Matlab toolboxes without knowing. % sizeinbytes : Returns the size in bytes of a Matlab variable. % %Estimation of EXECUTION TIME : % eetimebegin, : These four functions are used to estimate the execution % eetimeend, time in advance, e.g. for Monte Carlo simulations. % eetimeloop, % eetimepreloop % %Low level RADAR SIGNAL SIMULATION (usually not called by the end user). % Use function “simradarsig” instead. % simnoise : Simulates received noise signals. Called by simradarsig. % simtarget : Simulates radarsignals from targets. Called by simradarsig. % simclutter2 : Simulates clutter. Called by simradarsig. % %Low level RADAR SIGNAL MANAGEMENT functions : % setpultrans : Set transformation matrix for the pulse (time) dimension % in a radar signal. % setrantrans : Set transformation matrix for the range dimension in a % radar signal. % setspatrans : Set spatial transformation matrix in a radar signal. % setsparantrans : Set space-range transformation matrix in a radar signal. % % getcorrm : Returns an antenna array correlation matrix. % modifycorrmat, modcorrmkernel: Correlation matrix modification. % getcorrmkernel: Gets a (possibly modified) correlation matrix from % a signal matrix. % % getranbinlen : Gets the length of a range bin. % %Low level FILTERING : % calcfiltinit: Preparing the linear filtering with ‘calcfiltproc’. % calcfiltproc: Performing linear filtering of several signal vectors. % calcfiltsig : Part of the linear filtering of a received signal in % functions such as “pulfilt”. Calls “calcfiltinit” and % “calcfiltproc”. % calcfirfilt : Perform FIR filtering with different methods. % % % For more information about the functions use “help” for the corresponding % function. % % There are some programs and files, which are using DBT, for the studies % of the AIMT application example [5]. Help about these can be found by % >> help aimtexhelp % % There are some programs and files, which are using DBT, for the studies % of the AIMT experimental antenna [6]. Help about these can be found by % >> help expanthelp %
- 44 -
% There are some programs and files, which are using DBT, for the studies % of radio communication (see for example [7]). Help about these can be % found by % >> help radiohelp % %References: % [1]: Bjoerklund S.: “DBT, A MATLAB Toolbox for Radar Signal Processing. % Reference Guide”, FOA-D--9x-00xxx-408--SE, To be published. % [2]: Bjoerklund S., Rejdemyhr D.: “A MATLAB Toolbox for Radar Array % Processing”, Proceedings of ISSPA `99 (IEEE Fifth International % Symposium on Signal Processing and its Applications), August 22-25, % 1999, Brisbane, Australien. p 547-550. % [5]: Athley F.:”Tillaempningsexempel foer studie av modellbaserad % lobformning”, Ericsson Microwave Systems 1996, No FY/XU-96:299. % [6]: Pettersson L., Danestig M., Sjoestroem U.: “An Experimental S-Band % Digital Beamforming Antenna”, IEEE AES Systems Magazine, November 1997, % p.19-26. % [7]: Bjoerklund S.: “A MATLAB implementation of a Simulator for Wideband % Radio Signals Received by Array Antennas”, FOA-D--99-00435-504--SE, % March 1999. % [8]: Guerci J.R.: “Space-Time Adaptive Processing for Radar”, Artech House % 2003, ISBN 1-58053-377-9. % [9]: Guerci J.R., Bergin J.S.: “Principal Components, Covariance Matrix % Tapers, and the Subspace Leakage Problem”, IEEE Transactions on Aerospace % and Electronics Systems, Vol. 38, No. 1, January 2002, pp 152-162. % [10]: Guerci J.R.: “Theory and application of covariance matrix tapers for % robust adaptive beamforming”, IEEE Trans. on Signal Processing, 47, 4, % April 1999, 977-985. % [11]: Billingsley J.B.: “Exponential Decay in Windblown Radar Ground Clutter % Doppler Spectra: Multifrequency Measurements and Model”, Technical % Report 997, MIT Lincoln Laboratory, Lexington, MA, USA, july 29, 1996. % % Start : 961120 Svante Bjoerklund (svabj). % Latest change: $Date$ $Author$. % $Revision$ % ***************************************************************************** helpwin(‘dbthelp.m’)
- 45 -