of joint, marginal, and conditional distributions to fully understand the .....
decomposition to get a lower and upper triangular matrix. 3 .... Frontal Crush
Stiffness values for 1996−1999 Ford Taurus (Actual Data) ..... Figure: The vector
diagram solution to the conservation of momentum .... J Ball, D Danaher, and R
Ziernicki.
Introduction Probability Concepts Functions of Random Variables The Monte Carlo Method Predicting Correlation Conclusions
Dealing with Correlation in Crash Reconstruction Jeremy Daily The University of Tulsa Jackson Hole Scientific Investigations, Inc. 1st Annual Motor Vehicle Accident Reconstruction: Theory and Practice
6-13 July 2008
Introduction Probability Concepts Functions of Random Variables The Monte Carlo Method Predicting Correlation Conclusions
Abstract The results of a traffic crash reconstruction often include vehicle speeds to address causation and changes in velocity to indicate vehicle severity. Since these results are related, they must be modeled in a probabilistic context as a joint distribution. Current techniques in the traffic crash reconstruction literature, however, ignore the correlation structure associated with both the input and results of an analysis. Therefore a discussion of the uncertainty propagation techniques with correlation and Monte Carlo simulation of correlated variables is presented. An example of determining the energy from crush is presented since the A and B stiffness coefficients are highly correlated. A simple Monte Carlo analysis of a momentum problem requires using the concepts of joint, marginal, and conditional distributions to fully understand the results.
Introduction Probability Concepts Functions of Random Variables The Monte Carlo Method Predicting Correlation Conclusions
Outline of Presentation
1
2
3
4
Introduction Motivation Probability Concepts Multivariate Probability Conditional and Marginal Distributions Functions of Random Variables General Case Linear Combinations The Monte Carlo Method
5
6
Description Simulating Correlated Normal Variables Crush Energy Example Predicting Correlation Interpreting Correlated Results Momentum Example Example Results Discussion Conclusions
Introduction Probability Concepts Functions of Random Variables The Monte Carlo Method Predicting Correlation Conclusions
Outline
1
2
3
4
Introduction Motivation Probability Concepts Multivariate Probability Conditional and Marginal Distributions Functions of Random Variables General Case Linear Combinations The Monte Carlo Method
5
6
Description Simulating Correlated Normal Variables Crush Energy Example Predicting Correlation Interpreting Correlated Results Momentum Example Example Results Discussion Conclusions
Introduction Probability Concepts Functions of Random Variables The Monte Carlo Method Predicting Correlation Conclusions
Uncertainty exists
Do not have perfect information or modeling procedures No Exact result exists Experts must provide a range of likely values Well recognized in literature [B+ 02, BF03, Bra94, Fon04, LG05, MS11, WU07].
Introduction Probability Concepts Functions of Random Variables The Monte Carlo Method Predicting Correlation Conclusions
Analysis Techniques
Range of results comes from an uncertainty analysis Use derivative information to map the input uncertainty range to an output range Analytical Differentiation Finite Difference Analysis
The Monte Carlo method is commonly used [BDZ07, Bar03, DD04, KW94, WO94, WU06, Kim04]. 1 2 3
Assign distributions and randomly sample Combine random samples using governing equations Tabulate and report results
Correlation structure is often ignored (Sampling is independent)
Introduction Probability Concepts Functions of Random Variables The Monte Carlo Method Predicting Correlation Conclusions
Outline
1
2
3
4
Introduction Motivation Probability Concepts Multivariate Probability Conditional and Marginal Distributions Functions of Random Variables General Case Linear Combinations The Monte Carlo Method
5
6
Description Simulating Correlated Normal Variables Crush Energy Example Predicting Correlation Interpreting Correlated Results Momentum Example Example Results Discussion Conclusions
Introduction Probability Concepts Functions of Random Variables The Monte Carlo Method Predicting Correlation Conclusions
Probability theory
Assume some familiarity found in many texts addressing probability and/or reliability [AM97, AT07, HM00, Hau68]. The usefulness and power of probability and statistics goes well beyond the realm of a single variable. The use of multivariate distributions are useful in modeling and understanding related phenomena.
Introduction Probability Concepts Functions of Random Variables The Monte Carlo Method Predicting Correlation Conclusions
Joint Correlated Distributions
A joint distribution represents the relationships of the probability of two or more variables. In the case of two random variables, the joint cumulative distribution function (CDF) is defined as FX ,Y (x, y ) = P(X ≤ x, Y ≤ y )
(1)
Use bold face when dealing with more than two variables FX (x) = P(X ≤ x)
(2)
Introduction Probability Concepts Functions of Random Variables The Monte Carlo Method Predicting Correlation Conclusions
Multivariate Normal Probability Density function
� � 1 T −1 exp − (x − ~µ) Σ (x − ~µ) fX (x) = 2 (2π)n/2 |Σ|1/2 1
where X is a random vector of length n, Σ is the covariance matrix (|Σ| is the determinant of the covariance matrix), ~µ is the vector of means.
(3)
Introduction Probability Concepts Functions of Random Variables The Monte Carlo Method Predicting Correlation Conclusions
The Covariance Matrix
The covariance matrix has the following form σ12 ρ1,2 σ1 σ2 · · · ρ1,n σ1 σn ρ2,1 σ2 σ1 σ22 · · · ρ2,n σ1 σn Σ= .. .. .. .. . . . . ρn,1 σn σ1 ρn,1 σn σ2 · · ·
σn2
(4)
where σi is the standard deviation of the ith normal random variable, σi2 is the variance of the ith normal random variable, ρi,j is the correlation coefficient between the ith and jth variable. (Note: when i = j, ρ = 1).
Introduction Probability Concepts Functions of Random Variables The Monte Carlo Method Predicting Correlation Conclusions
Bivariate Normal Distribution
For the case of two random normal (Gaussian) variables, X and Y : � 2 � �� 1 x −1 2ρxy y 2 p fX ,Y (x, y ) = + exp − . 2(1 − ρ 2 ) σx2 σx σy σy2 2πσx σy 1 − ρ 2 (5) When two variables are statistically independent, then ρ = 0 and the bivariate distribution is simply the product of two univariate normal distributions.
Introduction Probability Concepts Functions of Random Variables The Monte Carlo Method Predicting Correlation Conclusions
3
Joint bivariate standard normal distribution, ρ=0 Joint bivariate standard normal distribution, ρ=0.9 3
2 2
1
Y
Y
1
0 0
−1 −1
−2
−3 −3
−2
−2
−1
0 X
1
2
3
(a) Bivariate normal distribution with no correlation
−3 −3
−2
−1
0 X
1
2
3
(b) Bivariate distribution with correlated variables
Figure: The standard normal joint distribution contours.
Introduction Probability Concepts Functions of Random Variables The Monte Carlo Method Predicting Correlation Conclusions
Correlation Coefficient The correlation coefficient is calculated as ρ=
Cov (X , Y ) σx σy
(6)
and has a value from -1 to 1 that indicates the strength of the linear relationship. A correlation coefficient close to 1 or -1 suggests a stronger linear relationship of the data. Similarly, a correlation of 0 suggests no linearity exists in the data. It is important to note that statistical independence implies no correlation, but the converse is not true. For example, data that fit a circle on the X-Y plane are not correlated, but they are dependent on one another. Also, correlation is strictly a function of the data and does not, by itself, mean a causal relationship exists. Often there is an underlying related causal variable common to both data sets of interest when correlation exists.
Introduction Probability Concepts Functions of Random Variables The Monte Carlo Method Predicting Correlation Conclusions
Expectation Operator
The expectation operator is Z +∞
E [g (x)] = −∞
g (x)fX (x) dx
(7)
and is used extensively in applications of probability theory. The covariance1 in the numerator, Cov (X , Y ), is defined by the expectation of the product of the deviation in X and the deviation in Y Cov (X , Y ) = E [(X − µx )(Y − µy )] = E [XY ] − E [X ]E [Y ]
1 Another
(8)
parameter, the coefficient of variation, uses the same abbreviation: c.o.v . = σ /µ.
Introduction Probability Concepts Functions of Random Variables The Monte Carlo Method Predicting Correlation Conclusions
Conditional and Marginal Distributions
Conditional probability is expressed as fX |Y (x|y ) =
fX ,Y (x, y ) fY (y )
(9)
which says the conditional probability of x given a value of y is the ratio of the joint probability to the marginal probability. The denominator in the conditional probability equation is the marginaldistribution function
Introduction Probability Concepts Functions of Random Variables The Monte Carlo Method Predicting Correlation Conclusions
Marginal Distribution Z +∞
fX (x) =
−∞
fX ,Y (x, y ) dy
(10)
Joint bivariate normal distribution (µx=6, µy=4, σx= 2, σy=1.3333, and ρ=0.9)
0.25
Prob. Density
0.2 0.15 0.1 0.05
8 12
6 10 4
8 6 2
4 2
Y
0
0
X
Introduction Probability Concepts Functions of Random Variables The Monte Carlo Method Predicting Correlation Conclusions
Conditional Distributions Joint bivariate normal distribution (µ =6, µ =4, σ = 2, σ =1.3333, and ρ=0.9) x
y
x
y
Joint bivariate normal distribution (µx=6, µy=4, σx= 2, σy=1.3333, and ρ=0.9)
0.6
0.5
0.6
Prob. Density
Prob. Density
0.5 0.4 0.3
0.4
0.3
0.2 0.1
0.2 8 12
6
0.1
10 4
8 6 2
4 2
Y
(a) Conditional functions
0
0
8 X
probability
density
7
6
5
4 Y
3
2
1
0
(b) The conditional probabilities, fY |X (y , x), produce different results depending on the choice of x.
Figure: Example of the concepts of joint (surface), marginal (curves on the edges) and conditional distributions (curves in the middle of the domain). All curves and surfaces are normalized.
Introduction Probability Concepts Functions of Random Variables The Monte Carlo Method Predicting Correlation Conclusions
Required Information
Five pieces of information are given/needed: 1
Mean of Variable 1: µ1
2
Mean of Variable 2: µ2
3
Standard Deviation of Variable 1: σ1
4
Standard Deviation of Variable 2: σ2
5
Correlation coefficient: ρ1,2
These five data completely define a bivariate normal distribution. In a computer, the bivariate distribution is typically stored as a 2-D array.
Introduction Probability Concepts Functions of Random Variables The Monte Carlo Method Predicting Correlation Conclusions
Consequence of Correlation
Conditional distributions are different in the presence of correlation. If no correlation exists, then the conditional and the marginal distributions are exactly the same The joint distribution is simply the product of all the independent distributions. When the conditional and marginal distributions are equal fX (x) · fY (y ) = fX ,Y (x, y )
(11)
Introduction Probability Concepts Functions of Random Variables The Monte Carlo Method Predicting Correlation Conclusions
Test for Statistical Independence
Statistical independence can be determined according to the following statistic that follows the student-t distribution [Die02]: √ |ρ| N − 2 . (12) t= p 1 − ρ2 When ρ is small, the t value is smaller and would be rejected by a t-test. As the value of ρ 2 approaches 1, the value of t will increase and become significant.
Introduction Probability Concepts Functions of Random Variables The Monte Carlo Method Predicting Correlation Conclusions
Outline
1
2
3
4
Introduction Motivation Probability Concepts Multivariate Probability Conditional and Marginal Distributions Functions of Random Variables General Case Linear Combinations The Monte Carlo Method
5
6
Description Simulating Correlated Normal Variables Crush Energy Example Predicting Correlation Interpreting Correlated Results Momentum Example Example Results Discussion Conclusions
Introduction Probability Concepts Functions of Random Variables The Monte Carlo Method Predicting Correlation Conclusions
Mapping Inputs to Outputs
The goal of an analysis involving random variables is to map random inputs to random outputs through some sort of functional mapping as shown in Fig. 3. In general, the result is a function of several random variables and a closed form solution exists. Consider the result of a function of a random vector: Z = g (X)
(13)
The distribution of the random vector is a joint distribution fX (x) and the goal is to determine the distribution of the results vector, fZ (z).
Introduction Probability Concepts Functions of Random Variables The Monte Carlo Method Predicting Correlation Conclusions
Taylor Series Approximation
It is possible to obtain approximate solutions to the variance of the result using a Taylor series approximation about the mean values. The Taylor series approximation for a function of two variables is n
Z = g (µ~x )+ ∑ (Xi − µx,i ) i=1
∂ 2g ∂g 1 n n + ∑ ∑ (Xi − µx,i )(Xj − µx,j ) ∂ Xi 2 i=1 j=1 ∂ Xi ∂ Xj
Gives an approximation for the variance: n n ∂ g ∂ g 2 σz = ∑ ∑ Cov (Xi , Xj ) i=1 j=1 ∂ Xi ~µX ∂ Xj µ~X
(14)
Introduction Probability Concepts Functions of Random Variables The Monte Carlo Method Predicting Correlation Conclusions
Analytical Solution
If unique inverses exist, then fZ (z) = fX (x)|J|
(15)
where |J| is the determinant of the Jacobian matrix: ∂x ∂x ∂ xn 1 2 ∂ z1 ∂ z1 · · · ∂ z1 ∂ x1 ∂ x2 ∂ z2 ∂ z2 · · · ∂∂ xz2n J = .. .. .. .. . . . . ∂ x1 ∂ zn
This technique is difficult.
∂ x2 ∂ zn
···
∂ xn ∂ zn
(16)
Introduction Probability Concepts Functions of Random Variables The Monte Carlo Method Predicting Correlation Conclusions
Propagation of Uncertainty y y = f (x) Uncertainty in y slope = sensitivity =
y¯
x¯ − 2sx
x¯
x¯ + 2sx
Figure: The functional mapping of an input to a result and the corresponding uncertainty from a linear approximation as opposed to complete functional mapping.
∂y ∂x
x
Introduction Probability Concepts Functions of Random Variables The Monte Carlo Method Predicting Correlation Conclusions
Linear Combinations
The following result is normally distributed: n
Z=
∑ ai Xi
(17)
i=1
and Xi ∼ N(µi , σi ), then Z is also normally distributed with a mean µz and standard deviation σz . The resulting mean and standard deviation of the result is known without approximation. In general, µz =
n
∑ ai µx,i
i=1
which is an intuitive result.
(18)
Introduction Probability Concepts Functions of Random Variables The Monte Carlo Method Predicting Correlation Conclusions
Standard Deviations The standard deviation (or uncertainty) of a linear combination is σz2 =
n
n
∑ ∑ ai aj Cov (Xi , Xj )
(19)
i=1 j=1
The case for the linear combination of two random variables (X and Y) is as follows: given Z = aX + bY
(20)
µz = aµx + bµy q σz = (aσx )2 + (bσy )2 + 2abρσx σy
(21) (22)
Introduction Probability Concepts Functions of Random Variables The Monte Carlo Method Predicting Correlation Conclusions
Independent variables
When the random inputs are statistically independent, the covariance matrix becomes diagonal with the individual variances and Eq. (14) becomes the familiar propagation of uncertainty equation: !2 n ∂ g 2 σz = ∑ σX2i (23) ∂ Xi i=1
~µX
Often the gradients are difficult to obtain in a complex analysis and numerical techniques such as finite differences are used to obtain the gradients.
Introduction Probability Concepts Functions of Random Variables The Monte Carlo Method Predicting Correlation Conclusions
Outline
1
2
3
4
Introduction Motivation Probability Concepts Multivariate Probability Conditional and Marginal Distributions Functions of Random Variables General Case Linear Combinations The Monte Carlo Method
5
6
Description Simulating Correlated Normal Variables Crush Energy Example Predicting Correlation Interpreting Correlated Results Momentum Example Example Results Discussion Conclusions
Introduction Probability Concepts Functions of Random Variables The Monte Carlo Method Predicting Correlation Conclusions
Monte Carlo Methods
The Monte Carlo method is a numerical integration technique for the simulation of probabilistic functions. The technique has a storied history dating back to the Manhattan Project [Wei06]. Its use in traffic crash reconstruction has been accepted and widely publicized [BDZ07, Bar03, DD04, KW94, WO94, WU06, Kim04] Few have addressed issues related to correlation.
Introduction Probability Concepts Functions of Random Variables The Monte Carlo Method Predicting Correlation Conclusions
The Monte Carlo Algorithms
The Monte Carlo Method involves the following steps: 1
Determine probability distributions for the input variables for an analysis
2
Repeatedly sample the input distributions, perform a deterministic analysis, and store the results.
3
Use the stored results to generate an empirical distribution and perform subsequent interpretation.
Introduction Probability Concepts Functions of Random Variables The Monte Carlo Method Predicting Correlation Conclusions
Number of Samples
The issue of the number of samples is raised Each attempted run is going to produce different results Evaluate the % error in the resulting Monte Carlo mean value, z¯ r 1 − z¯ %error = 200 (24) n¯ z The error decreases as the square root of n Variance reduction techniques have become popular [Hel03, HJSS06].
Introduction Probability Concepts Functions of Random Variables The Monte Carlo Method Predicting Correlation Conclusions
Correlated Sampling 1
2
3
Generate two independent random values from a standard normal distribution, V1 ∼ N(0, 1) and V2 ∼ N(0, 1). Generate a covariance matrix Σ and perform a Cholesky decomposition to get a lower and upper triangular matrix. Cholesky decomposition can be thought of as taking the square root of a matrix. Σ = LLT
4
Transform the independent samples to correlated samples U = LT V
5
(25)
Adjust the correlated random variables by adding the corresponding mean.
(26)
Introduction Probability Concepts Functions of Random Variables The Monte Carlo Method Predicting Correlation Conclusions
Example of Determining Energy From Crush The CRASH3 method has become popular in determining energy from crush [Ano86, DSD06]. � L A (C1 + 2C2 + 2C3 + 2C4 + 2C5 + C6 ) ET = 5 2 B� 2 + C + 2C22 + 2C32 + 2C42 + 2C52 + C62 + C1 C2 + C2 C3 + C3 C4 + C4 C5 + 6 1 � 5A2 + (27) 2B where L is the width of the crush profile, A and B are vehicle stiffness coefficients based on crash test data, and Ci are evenly spaced crush measurements measured according to the Thumbas and Smith protocol [TS88].
Introduction Probability Concepts Functions of Random Variables The Monte Carlo Method Predicting Correlation Conclusions
Pole Impact A crash test at IPTM’s Special Problems conference in April of 2007 had a 1998 Ford Taurus strike a utility pole. Variable C1 , inches C2 , inches C3 , inches C4 , inches C5 , inches C6 , inches L, inches
Value 0 5.0 15.75 9.0 1.5 0 61.5
Table: Damage profiles of the vehicle.
Introduction Probability Concepts Functions of Random Variables The Monte Carlo Method Predicting Correlation Conclusions
Stiffness Values In addition to knowing the damage profile, the stiffness coefficients must be found. These data were obtained from a searchable database, StiffCALCS, from Expert AutoStats. Stiffness Average Maximum Minimum Standard Deviation
A, lb/in 418.4 486.7 357 41.9
B, lb/in2 161.9 228.6 109.6 36.5
Table: Frontal stiffness values for Ford Taurus / Mercury Sable vehicles of this body style (1996 - 1999, eleven tests)
Introduction Probability Concepts Functions of Random Variables The Monte Carlo Method Predicting Correlation Conclusions
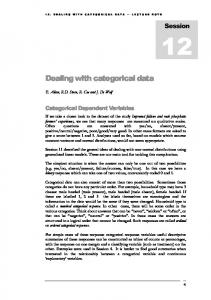
Correlation of the Stiffness Values Frontal Crush Stiffness values for 1996−1999 Ford Taurus (Actual Data) 240 B = −178.9851 + 0.81485(A)
R2 = 0.87901
220
B stiffness value (lb/in)
200
180
160
140
120
100 350
400
450
500
A stiffness value (lb)
Figure: Scatter plot and linear fit of the A and B crush stiffness coefficients showing a positive correlation.
Introduction Probability Concepts Functions of Random Variables The Monte Carlo Method Predicting Correlation Conclusions
Least Squares Fitting A least square fit of a line, B = mA + b is also shown in Fig. 4. The coefficient of determination is determined as Var (ε) Var (B)
(28)
n − 2 Var (ε) n − 1 Var (B)
(29)
R2 = 1 − The correlation coefficient is ρ2 = 1 −
For a linear fit, the square of the correlation has the nearly same value as the coefficient of determination. The correlation coefficient is a measure of linearity The coefficient of determination is used to assess the quality of the least squares fit– even if the fitted function is not a line.
Introduction Probability Concepts Functions of Random Variables The Monte Carlo Method Predicting Correlation Conclusions
Covariance
Simulating the stiffness values requires the covariance matrix Σ which is determined using built in functions. The result is � � 1759.2 1433.5 cov(A,B) = 1433.5 13289 and its corresponding Cholesky decomposition is � � 41.9431 34.1773 chol(cov(A,B)) = 0 12.6802 The Cholesky decomposition of the covariance matrix can be thought of as determining the “standard deviation matrix”
Introduction Probability Concepts Functions of Random Variables The Monte Carlo Method Predicting Correlation Conclusions
Simulation Results
Frontal Crush Stiffness values for 1996−1999 Ford Taurus (Independent Sampling) 300
Frontal Crush Stiffness values for 1996−1999 Ford Taurus (Correllated Simulation) 300
250
250 B stiffness value (lb/in)
B stiffness value (lb/in)
Simulated Data
200
150
100
50
200
150
100
50 Simulated Data
0 250
300
350
400 450 A stiffness value (lb)
(a) ρ = 0
500
550
600
0 250
300
350
400 450 A stiffness value (lb)
500
550
600
(b) ρ = 0.9376
Figure: The sampling results superimposed on the actual data for the A and B stiffness values.
Introduction Probability Concepts Functions of Random Variables The Monte Carlo Method Predicting Correlation Conclusions
3-D Histograms The simulated data can be displayed in Fig. 6 using a 3-D histogram in addition to the scatter plots of Fig. 5.
(a) ρ = 0
(b) ρ = 0.9376
Figure: Three dimensional histograms for the simulated stiffness values. These plots duplicate the data shown in Fig. 5.
Introduction Probability Concepts Functions of Random Variables The Monte Carlo Method Predicting Correlation Conclusions
Determination of Energy Histogram of Crush Energy (Correlated Sampling)
Histogram of Crush Energy (Independent Sampling)
3500
3500 3000
3000 2500
2000
2000
Count
Count
2500
1500
1500
1000
1000
500
500
0
2
2.5
3
3.5
4 4.5 5 5.5 Crush Energy, (ft−lb)
(a)
6
6.5
7 4
x 10
0
2
2.5
3
3.5
4 4.5 5 Crush Energy, (ft−lb)
5.5
6
6.5
7 4
x 10
(b)
Figure: Histogram of the energy calculation based on random inputs for the stiffness values.
Introduction Probability Concepts Functions of Random Variables The Monte Carlo Method Predicting Correlation Conclusions
Effect of Correlation Cumulative Distributions of Crush Energy 1 0.9 Positive Correlation No Correlation Negative Correlation
0.8
Probability
0.7 0.6 0.5 0.4 0.3 0.2
95% Intervals
0.1 0
1
2
3
4 5 6 Crush Energy, (ft−lb)
7
8
9 4
x 10
Figure: Cumulative distributions showing the effect of correlation (both positive and negative) compared to the effect of no correlation. The horizontal bars indicate the differences in the 95% most likely probability range. The mean response is the same for all three cases.
Introduction Probability Concepts Functions of Random Variables The Monte Carlo Method Predicting Correlation Conclusions
Outline
1
2
3
4
Introduction Motivation Probability Concepts Multivariate Probability Conditional and Marginal Distributions Functions of Random Variables General Case Linear Combinations The Monte Carlo Method
5
6
Description Simulating Correlated Normal Variables Crush Energy Example Predicting Correlation Interpreting Correlated Results Momentum Example Example Results Discussion Conclusions
Introduction Probability Concepts Functions of Random Variables The Monte Carlo Method Predicting Correlation Conclusions
Linear Combinations Consider measuring two different objects with the same instrument. For example, weigh two vehicles that have been in an accident on the same scale. The instrument itself has a tolerance and a certain amount of random uncertainty experienced between different measurements. The random uncertainty associated with two different measurements is denoted as P1 and P2 . These values may have the same value but are considered independent. The instrument has some systematic uncertainty associated with it due to calibration, field use, temperature, etc. This is the same between measurements and is denoted as B. The two measured values are modeled as a linear combination: R 1 = µ 1 + P1 + B
(30)
R 2 = µ 2 + P2 + B
(31)
Introduction Probability Concepts Functions of Random Variables The Monte Carlo Method Predicting Correlation Conclusions
Correlation of Measurements
R1 and R2 have a common random term so they are necessarily correlated. After some derivation: Cov (R1, R2 ) = Var (B)
(32)
The random uncertainty Pi comes from repeated measurement. With low resolution instrumentation, sometimes the repeated measurement reveal no random uncertainty, which would suggest the two measurements to be perfectly correlated.
Introduction Probability Concepts Functions of Random Variables The Monte Carlo Method Predicting Correlation Conclusions
Conceptual Weighing
This perfect correlation assumption may not be applicable in that the epistemic uncertainty could be broken into a correlated and an uncorrelated part. The weight of the ith vehicle could be written mathematically as a sum: wi = µi + wi,people + wi,cargo + wi,debris + wi,fluids where µi is the measured weight of the vehicles.
Introduction Probability Concepts Functions of Random Variables The Monte Carlo Method Predicting Correlation Conclusions
Correlation Recommendations
Often even the measured weight must be determined though a database or other indirect means. When the different weight components are estimated, rather than measured, then the corresponding uncertainty is higher. When the same scale is used and the same expert is estimating the uncertainties of the missing weight components, the correlation between the two vehicles in a crash is inevitable. However, it is apparent that variation between the weight estimates of the cars exist as well. Therefore, in the absence of better information, the author recommends using a correlation coefficient between the estimated weights of two vehicles involved in a crash to be 0.8.
Introduction Probability Concepts Functions of Random Variables The Monte Carlo Method Predicting Correlation Conclusions
Multiple Outputs
Simulation produces more than one output parameter which are likely to be dependent on one another. Multidimensional joint distributions are difficult to display and interpret, so marginal distributions are commonly used to display the results. The sole use of marginal distributions can lead to misleading results, especially reporting opinions on likely scenarios for a crash. Instead, results should be reported as conditional distributions so as to demonstrate that the results are related.
Introduction Probability Concepts Functions of Random Variables The Monte Carlo Method Predicting Correlation Conclusions
Linear Momentum Example
v2 =
w1 v3 sin θ v4 sin φ + w2 sin ψ sin ψ
v1 = v3 cos θ +
w2 v4 cos φ w2 v2 cos ψ − w1 w1
(33) (34)
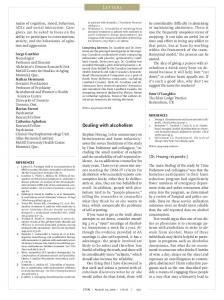
For any impact angle ψ other than 90 degrees, the result of v1 depends on the value of v2 . The weights, angles, and exit velocities may be correlated in some manner. E.g., if both vehicles slide or spin to a stop on the same surface, then the exit velocities will be correlated.
Introduction Probability Concepts Functions of Random Variables The Monte Carlo Method Predicting Correlation Conclusions
Momentum Solution Diagrams
Ptotal
P2
∆P2
P4 P3
φ
∆P1
ψ θ
P1
Figure: The vector diagram solution to the conservation of momentum analysis showing the iterative nature of the sampling scheme. Notice how all the results are related which means the output of the probabilistic analysis will be a correlated joint distribution.
Introduction Probability Concepts Functions of Random Variables The Monte Carlo Method Predicting Correlation Conclusions
Momentum Input Distributions
Variable Weight 1 (lb) Weight 2 (lb) App. Angle 2 (deg) Exit Angle 1 (deg) Exit Angle 2 (deg) Exit Speed 1 (mph) Exit Speed 2 (mph)
Symbol w1 w2 ψ θ φ v3 v4
Mean 3215 4320 110 30 60 23.2 35.4
St. Dev. 58 64 3 2 2 2 3
Dist. Bi. Norm Bi. Norm Normal Normal Normal Normal Normal
Table: Monte Carlo Simulation Inputs for an oblique impact.
Corr. 0.67 0.67 0 0 0 0.87 0.87
Introduction Probability Concepts Functions of Random Variables The Monte Carlo Method Predicting Correlation Conclusions
Simulation Results Mean values give v1 = 80.5 mph and v2 = 41.8 mph. v1 and v2 , comprise a joint distribution
Figure: The estimated bivariate distribution of the Monte Carlo Simulation results.
Introduction Probability Concepts Functions of Random Variables The Monte Carlo Method Predicting Correlation Conclusions
Marginal Distribution Results
Figure: Marginal distributions showing the the distribution shape of the results one at a time. These marginal distributions show the probability for all possibilities other variables. The distributions have been normalize to have a total area of 1.
Introduction Probability Concepts Functions of Random Variables The Monte Carlo Method Predicting Correlation Conclusions
Conditional Probabilities
1
The 90% range of v1 given that v2 is 36.97 mph is between 63.42 and 73.07 mph.
2
The 90% range of v1 given that v2 is 46.62 is between 85.75 and 95.90 mph.
In a similar fashion, ( v2,min = 37.5 mph v1,min = 70.9 mph v2,max = 41.3 mph and v1,max
( v2,min = 42.8 mph = 90.3 mph v2,max = 47.2 mph
Introduction Probability Concepts Functions of Random Variables The Monte Carlo Method Predicting Correlation Conclusions
Conditional Results Conditional probabilities for extremes of v
Estimated joint distribution (µx= 80.4873, µy= 41.8373, σx= 5.9349, σy= 3.0189, and ρ= 0.86719)
2
0.3
0.25
0.3 0.25
Prob. Density
Prob. Density
0.2 0.2 0.15 0.1 0.05
0.15
0.1
0 55 50
0.05 100
45
90 40
80 70
35 Speed of Vehicle 2, (mph)
0
60 Speed of Vehicle 1, (mph)
(a)
60
65
70
75
80 85 90 Speed of Vehicle 1, (mph)
95
100
(b)
Figure: The conditional distributions stemming from the joint Monte Carlo simulation results.
105
Introduction Probability Concepts Functions of Random Variables The Monte Carlo Method Predicting Correlation Conclusions
Prob. Density
Conditional Results Top view of joint distribution
54 52 Conditional probabilities for extremes of v1
50
0.3
48 46
0.25
44
Prob. Density
0.2
42 0.15
40 38
0.1
Speed of Vehicle 2, (mph) 0.05
34
0 Speed of Vehicle 1,34(mph) 36
36
60 38
40
42 44 46 Speed of Vehicle 2, (mph)
(a)
48
50
52
54
65
70 75 80 85 Speed of Vehicle 1, (mph)
90
95
100
(b)
Figure: The conditional distributions stemming from the joint Monte Carlo simulation results.
105
Introduction Probability Concepts Functions of Random Variables The Monte Carlo Method Predicting Correlation Conclusions
Discussion
Including the conditional probabilities reveal different ranges of results. The positive correlation shows that it is more likely that both vehicles were traveling on the upper level of their speed ranges or on the lower level of their speed ranges. The combination of high/low or low/high is much less likely. Using conditional probabilities also reduces the ranges calculated from the distribution. Conditional probabilities also enable the analyst to evaluate the opposition’s results with a tighter tolerance to detect any inconsistencies.
Introduction Probability Concepts Functions of Random Variables The Monte Carlo Method Predicting Correlation Conclusions
Outline
1
2
3
4
Introduction Motivation Probability Concepts Multivariate Probability Conditional and Marginal Distributions Functions of Random Variables General Case Linear Combinations The Monte Carlo Method
5
6
Description Simulating Correlated Normal Variables Crush Energy Example Predicting Correlation Interpreting Correlated Results Momentum Example Example Results Discussion Conclusions
Introduction Probability Concepts Functions of Random Variables The Monte Carlo Method Predicting Correlation Conclusions
Conclusions Show the effect of including correlation Review the mathematical basis for joint, marginal, and conditional probability distributions Discuss uncertainty analysis techniques, including analytical solutions, Taylor series approximations, and the Monte Carlo method in the context of correlated variables. Reveal correlation in crush stiffness values Determining the correlation of vehicle weights was shown Simultaneous results of an analysis can be correlated A momentum analysis was presented to demonstrate how the final speed ranges can be reduced by examining the conditional probability.
Introduction Probability Concepts Functions of Random Variables The Monte Carlo Method Predicting Correlation Conclusions
References I B. M. Ayyub and R. H. McCuen. Probability, Statistics, and Reliability for Engineers. CRC Press LLC, Boca Raton, 1997. Anonymous. Crash3 technical manual, 1986. Alfredo H-S. Ang and Wilson H. Tang. Probability Concepts in Engineering. Number 0-471-72064-X. John Wiley & Sons, second edition, 2007. W Bartlett et al. Evaluating the uncertainty in various measurement tasks common to accident reconstruction. SAE, Jan 2002.
Introduction Probability Concepts Functions of Random Variables The Monte Carlo Method Predicting Correlation Conclusions
References II
Wade D Bartlett. Conducting monte carlo analysis with spreadsheet programs. SAE, (2003-01-0487), Jan 2003. J Ball, D Danaher, and R Ziernicki. Considerations for applying and interpreting monte carlo simulation analyses in accident . . . . SAE Technical Paper Series, (2007-01-0741), Jan 2007. W Bartlett and A Fonda. Evaluating uncertainty in accident reconstruction with finite differences. SAE Technical Paper Series, SP-1773(2003-01-0489), Jan 2003.
Introduction Probability Concepts Functions of Random Variables The Monte Carlo Method Predicting Correlation Conclusions
References III
RM Brach. Uncertainty in accident reconstruction calculations. SAE Technical Paper Series, SP-1030(940722), 1994. Jeremy S Daily and John G Daily. Multiple vehicle collisions: An application of the monte carlo method. Special Problems in Traffic Crash Reconstruction (IPTM), page 44, Apr 2004. R H Dieck. Measurement Uncertainty: Methods and Applications. 2002.
Introduction Probability Concepts Functions of Random Variables The Monte Carlo Method Predicting Correlation Conclusions
References IV
John G. Daily, Nathan Shigemura, and Jeremy S. Daily. Fundamentals of traffic crash reconstruction. Institute of Police Technology and Management, University of North Florida, Jacksonville, Fla., 2006. A Fonda. The effects of measurement uncertainty on the reconstruction of various vehicular collisions. SAE Technical Paper Series, SP-1873(2004-01-1220), Jan 2004. Edward B. Haugen. Probabilistic Approaches to Design. John Wiley & Sons, 1968.
Introduction Probability Concepts Functions of Random Variables The Monte Carlo Method Predicting Correlation Conclusions
References V J Helton. Latin hypercube sampling and the propagation of uncertainty in analyses of complex systems. Reliability Engineering & System Safety, 81(1):23–69, Jul 2003. J Helton, J Johnson, C Sallaberry, and C Storlie. Survey of sampling-based methods for uncertainty and sensitivity analysis. Reliability Engineering & System Safety, page 35, Jan 2006. Achintya Haldar and Sankaran Mahadevan. Probability, Reliability, and Statistical Methods in Engineering Design. Number 0-471-33119-8. John Wiley & Sons, 2000.
Introduction Probability Concepts Functions of Random Variables The Monte Carlo Method Predicting Correlation Conclusions
References VI Scott Kimbrough. Determining the relative likelihoods of competing scenarios of events leading to an accident. SAE Technical Paper Series, (2004-01-1222):14, Dec 2004. G Kost and S Werner. Use of monte carlo simulation techniques in accident reconstruction. SAE Technical Paper Series, (940719), Jan 1994. Z Lozia and M Guzek. Uncertainty study of road accident reconstruction-computational methods. SAE Technical Paper Series, SP-1930(2005-01-1195), Jan 2005.
Introduction Probability Concepts Functions of Random Variables The Monte Carlo Method Predicting Correlation Conclusions
References VII Joel B. MacWilliams and Lawrence W. Schneider. Analysis of crash reconstruction program results. University of Michigan Transportation Research Institute, UMTRI-2001-11. Nicholas S Tumbas and Russell A Smith. Measuring protocol for quantifying vehicle damage from and energy basis point of view. SAE Technical Paper Series, (880072), 1988. Eric W. Weisstein. Monte carlo method. From MathWorld–A Wolfram Web Resource. http://mathworld.wolfram.com/MonteCarloMethod.html, May 2006.
Introduction Probability Concepts Functions of Random Variables The Monte Carlo Method Predicting Correlation Conclusions
References VIII
D P Wood and S O’Riordain. Monte carlo simulation methods applied to accident reconstruction and avoidance analysis. SAE Technical Paper Series, (940720), 1994. W Wach and J Unarski. Determination of vehicle velocities and collision location by means of monte carlo simulation method. SAE Technical Paper Series, (2006-01-0907), 2006. W Wach and J Unarski. Uncertainty of calculation results in vehicle collision analysis. Forensic Science International, 167(2-3):181–188, Apr 2007.