Debug Support for Scalable System-on-Chip Jianmin Zhang
Ming Yan
Sikun Li
School of Computer Science National University of Defense Technology Changsha, China 410073 Telephone: +86-731-4575981 Fax: +86-731-4575981 Email:
[email protected]
School of Computer Science National University of Defense Technology Changsha, China 410073 Telephone: +86-731-4575981 Fax: +86-731-4575981 Email:
[email protected]
School of Computer Science National University of Defense Technology Changsha, China 410073 Telephone: +86-731-4575981 Fax: +86-731-4575981 Email:
[email protected]
Abstract— On-chip debug is an important technique to detect and locate the faults in the practical software applications. Scalability and reusability are the essential features of Systemon-Chip (SoC). Therefore, the debug architecture should meet the requirement of those features. Furthermore, it is necessary for applications developers to communication with the SoC chip on-line. In this paper, we present the novel debug architecture to solve above problems. The debug architecture has been implemented in a typical SoC chip. The results of performance analysis show that the debug architecture has high performance at the cost of few resources and area.
I. I NTRODUCTION With the development of integrated circuit, a complete system can be fully integrated into SoC containing a set of highcomplexity IP cores. Consequently, the functional behavior of the systems is determined by both hardware and software events. It is a trend to reduce the difficulty and time to market of software applications development. However, detecting and locating the faults in the software is tedious, time-consuming and error-prone. On-chip debug is an important technique to solve above problems. An effective debug methodology necessarily needs to provide the convenient environment to debug the errors in software. Such debug architecture should easily debug of problems in the “grey area” where the cause of a problem is not so clear. Furthermore, scalability and reusability are the primary features of System-on-Chip. These features entail the IP cores from the third parties to easily integrate into SoC. Therefore, the debug architecture should meet the demand of scalability and reusability. While IP cores are added or removed, such debug architecture need not change a lot to adapt to the new SoC. Moreover, it is necessary and convenient for applications developer to understand the status of the processor real time without interrupting the programs’ execution and switching to the debug state. Thus on-line communication plays an important role in locating the bugs of software. It is an indispensable function of the debug architecture. There have been a lot of contributions to research on debug architecture of the SoC chip and board [1], [2], [3], and [4]. They have provided good solutions for system-on-chip, even for the multi-core system. However they do not pay attention to the scalability and reusability of System-on-Chip. Existing
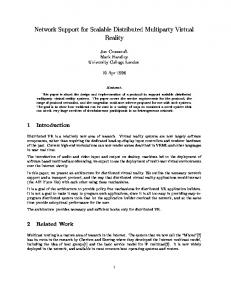
works have very little concern regarding debug architecture for scalable SoC. Moreover, on-line communication is important for debug the faults in the software. In this paper, we present the novel debug architecture to address those problems. Several special scan chains and a clock domain converter are introduced to ensure the scalability required by SoC. We design a module called a debug data exchange channel to effectively solve the problem of on-line communication. The debug architecture has been implemented in a typical SoC chip called EStar, which can represent a category of single-core SoC chips. EStar contains a 32bits RISC processor core with 5 stages pipeline and many peripheral IP cores partially from the third parties. However it is in unsaturation, that is to say, it will integrate more IP cores. This debug architecture has good scalability and reusability, and does not necessarily modify a lot to support new IP cores integrated. We made a thorough performance analysis for all debug modules and basic debug operations. The results indicate that the debug architecture has high performance at the cost of few resources and area. The paper is organized as follows. The next section surveys the novel debug architecture of SoC. Section 3 presents the debug support solution for the SoC’s scalable and reusable features. Section 4 describes the solution of on-line communication for System-On-Chip. Section 5 shows the results of resource utilization and performance analysis. Finally, Section 6 concludes this paper and outlines the future research works. II. D EBUG A RCHITECTURE In this section, the overview of the debug architecture for SoC is introduced. Firstly, we provide the sketch of the debug architecture. Secondly, the structure and function of each debug component are described respectively in the following paragraphs. A. Overview of Debug Architecture The debug architecture for SoC is composed of seven components: a JTAG controller, four scan chains, a debug unit, a clock domain converter, a debug data exchange channel, a clock switch unit and a debug controller. Fig. 1 illustrates the debug architecture of SoC.
Scan chain3
Scan chain 1
Register File
CPU CORE
Scan chain 2
Debug Controller
Debug Unit
Debug Data Exchange Channel
TDI
Local Bus
Scan chain 4 JTAG
DMMU/ DCache
IMMU/ ICache
Clock Domain Convter
Clock switch
Peripheral On-Chip Bus ĂĂ
Fig. 1.
Debug Architecture of SoC
real-time status of programs without disturbing the programs’ normal execution. The debug controller tightly couples with the processor core. It receives the match signal of breakpoints and watchpoints sent by the debug unit, and determines the state of the system. The main function of this module is to ensure the right results of programs’ execution. It consists of the pipeline blocking logic, the processor’s status preserving and resuming logic, the pipeline flushing logic, the cache writing back and invalid mechanism, a breakpoint instruction, etc. Fig. 2 shows the pipeline blocking logic. The pipeline runs in order while the “CanGo” signals of all stages are valid, otherwise the pipeline stalls. The BKPT Go or WHPT Go signal will be invalid if at least one of the breakpoints or watchpoints is encountered. Then the pipeline is blocked under the control of the cascade AND gates.
B. Introduction of Debug Modules The JTAG controller fulfills the communication between the debug target system and the environment. It receives debug instructions from the external debugger and translates them into the control signals of scan chains. It consists of a TAP (Test Access Port) controller, a debug instructions decoder and a boundary scan chain. It is fully compatible with IEEE 1149.1 standard Joint Test Access Group specification [5]. The debug scan chains are the bridges which connect the JTAG controller with the modules accessed. Data is serially shifted under the control of JTAG controller, but the scan chains access the modules in parallel. The debug architecture contains four debug scan chains. Scan chain 1 controls the instructions and data port of the processor core. Scan chain 2 sets the address and data registers of the breakpoints and watchpoints in debug unit, and transmits message between JTAG controller and the debug data exchange channel. Scan chain 3 reads and writes the register file of the processor core. Scan chain 4 accesses uniform peripheral address spaces through the clock domain converter. The uniform address spaces cover the external memory and the peripheral registers. The applications developers are able to easily acquire the data they want utilizing four debug scan chains. The debug unit compares the instructions and data accessed by the processor core with the content of breakpoint registers preset by the developers. While they match, the debug unit outputs the breakpoint match signals, and then the system enters the debug state. There exist three sets of breakpoint registers in debug unit. Thus the applications developers can simultaneously set three different breakpoints or watchpoints, and the chip will come to a halt in the proper place of the program so long as at least one of the three breakpoints or watchpoints is encountered. The debug data exchange channel performs the on-line communication between the processor core and the external debugger. Because the processor and the scan chains respectively belong to two different clock domains, two FIFO (First In First Out) queues are introduced to solve this problem. It provides a good mechanism for the debuggers to monitor the
IF Stage IFCanGo
ID Stage
EXE Stage
MEM Stage
WB Stage
IDCanGo EXECanGo MEMCanGo WBCanGo
AND
ID_Go
AND EXE_Go BKPT_Go
Fig. 2.
AND
MEM_Go
AND
WHPT_Go
WB_Go
Pipeline Blocking Logic
The clock switch unit changes the system clock when the chip enters or exits the debug state. The system clock is converted to test clock while the chip enters the debug state and processor clock while the chip exists the debug state. Although the gap of frequency between test clock and the processor clock is very wide and the two clocks are asynchronous, this module can well avoid the clock glitch, which is crucial for the whole chip. It is carefully designed and ensures the timing closure. III. D EBUG S UPPORT FOR S CALABILITY Since scalability and reusability are the essential features of System-on-Chip, the debug architecture should meet the demand of the features. In this section, we describe the debug components which support the scalability and reusability of SoC. These components consist of the corresponding debug scan chains and a module called a clock domain converter. A. Debug Scan Chains The software developers want to be aware of the status and results of instructions’ execution. Therefore, it is necessary that the debugger can not only watch the register file and external memory space, but also modify the content of the whole memory. Then, we design two scan chains including the scan chain 3 and scan chain 4 to observe the register file and the memory space. These debug chains can strongly enhance the operability and controllability of the programs,
and help the software developers to locate the faults rapidly and accurately. However, scalability and reusability are the main features of System-on-Chip. When some peripheral IP cores are added or removed, the debug architecture should not change a lot. In general, the peripherals are connected to the on-chip bus in a slave mode. Therefore, we design a scan chain as a master module connected to the bus. This scan chain can send the address, data and control signals to the slave peripherals, and access the content of peripheral address space through the master port. Fig. 3 shows the structure of scan chain 4. There are three fields in scan chain 4, including the data, address, and control signals, which correspond to the signals of on-chip bus. To solve the problem of the increasing address bits while new IP cores are integrated, the address filed contains a few redundant bits. This simple mechanism meets the requirement of the scalable feature for SoC. MSB
LSB
Data field Fig. 3.
Address field
Then the ocb ack signal is valid. The request and data signals of the scan chain 4 will not invalid until the ocb ack signal is sampled by sc ack o signal. In this way, this module succeeds in communicating between the scan chain and the peripheral IP cores belonging to two asynchronous clock domains. ĂĂ
tck sc_dat_i
Valid data
sc_req_i
ĂĂ
sc_ack_o
ĂĂ
ocb_clk
ĂĂ
ocb_stb_i
ĂĂ
ocb_ack_o
ĂĂ
ocb_dat_o
Valid data
ocb_ack
Fig. 4.
Structure of Scan Chain 4
The function of IP cores differs in thousands ways. We do not know which IP will be integrated into SoC. Some IP cores must work on a certain frequency. In other words, they cannot be under the control of test clock, because the frequency of test clock is very low. For example, since the sdram must refresh at intervals, the sdram memory controller should work on a fixed frequency, and cannot switch to test clock. There not exists the synchronous relation between the sdram clock and the test clock. Thus a module called a clock domain converter is designed to address this problem. This module entails the scalability solution more universal. We implement the clock domain converter in a typical SoC chip-EStar. The on chip bus of EStar is similar to Wishbone [6] and AMBA [7]. These buses work in the mode of handshake. Fig. 4 shows the timing relation of main control signals. It is a procedure of the scan chain 4 writing data to the peripheral address space. To clearly describe the timing relation, some signals, such as address, write enable signals and so on, are omitted in this figure. In Fig. 4, four signals above are the clock, data, request and acknowledge signals of scan chain 4. The four signals below are the clock, strobe, acknowledge, data signals of the on-chip bus. The last signal called ocb ack is used to synchronize two acknowledge signals belonging to two different clock domains. It ensures that the scan chain controlled by the test clock can sample the acknowledge signal of the on-chip bus. When the scan chain 4 needs to write data to one of the peripherals, it prepares the output data and sends the request signal. While the strobe signal of on-chip bus samples the request signal, the peripheral reads the data and sends the acknowledge signal.
ĂĂ ĂĂ
Control field
B. Clock Domain Converter
ĂĂ
Timing Relations of Signals
IV. O N - LINE C OMMUNICATION It is necessary and convenient for application developers to understand the status of the processor real time without interrupting the programs’ execution and switching to the debug state. Consequently, on-line communication is an indispensable function of the debug architecture. We design a module called a debug data exchange channel to satisfy the requirement. It provides a good framework to communicate between the processor and the debugger without stopping the program and entering debug state. The gap of frequency between the test clock and processor core clock is very wide, as much as order of magnitudes. Furthermore, the two clocks are asynchronous. Therefore, the data cannot be transmitted straight. The FIFO structure is introduced in the debug data exchange channel to solve this problem. Core clock domain Processor core
Debug data exchange channel Left FSM
Forward FIFO
Right FSM
Test clock domain JTAG module
Backward FIFO
Fig. 5.
Structure of Debug Data Exchange Channel
We implement two FIFO queues in the debug data exchange channel. Fig. 5 is the structure of debug data exchange channel. Every FIFO transmits data in single direction. The depth of each FIFO queue is four. One queue is called a forward FIFO, through which the processor sends data and the debugger receives data. The other queue is called a backward FIFO, through which the debugger sends data and the processor receives data. The reading and writing operation of two FIFO queues are respectively controlled by left FSM and right FSM.
A status pointer called “FULL” indicates the queue full and data cannot be written any more. Another status pointer called “EMPTY” denotes the FIFO empty and no data can be read. In conclusion, two FIFO queues effectively avoid the influence of different clock domains. The debug data exchange channel transmits data accurately and efficiently between the processor and the debugger.
they work in normal state driven by the processor core clock at 200MHz, the power dissipation of the debug unit and the debug controller respectively are 39.881mW and 24.086mW. TABLE II P ERFORMANCE OF D EBUG M ODULES Module
V. I MPLEMENTATION To evaluate the performance of the debug architecture, it is implemented in a typical SoC chip called EStar. The process technology of EStar is 0.18 µm CMOS. Table I provides the resource utilization of each module. In Table I, the second column is the number of gates, and the area of each module is listed in the third column.
Gates
Area
(µm2 )
Debug unit
2540
90961.921875
Debug data exchange channel
507
16165.125485
Clock domain converter
213
11529.292969
Clock switch unit
42
2373.382721
Debug controller
826
25832.457836
JTAG controller
245
4859.893789
Scan chain 1
201
8585.439453
Scan chain 2
296
14034.053711
Scan chain 3
800
40585.312500
Scan chain 4
487
22263.568359
Table II gives the performance analysis of every unit. In Table II, the second column is latency of the critical path. The operation condition of static timing analysis is “WORST” condition, that is to say, the core supply voltage is 1.62 volt, and the I/O supply voltage is 3.0 volt, and the junction temperature is 125o C, and the process derating factor is 1.2. The last two columns in Table II present power dissipation of each module. The constraints of power estimation are that the switch probability of logic signals is 20%, and the switch probability of clock signals is 200%, and the frequency of processor core clock is 200MHz, and the frequency of peripheral clock is 50MHz, and the frequency of test clock is 20MHz in the third column, and the frequency of test clock is 40MHz in the fourth column. The frequency of peripheral clock is one fourth of the processor core clock, and they are synchronous, that is to say, the peripheral clock is derived from the processor core clock by a frequency divider. Since the relation of many clocks in the clock switch unit is complex, it is difficult to exactly evaluate the values of timing and power. Thus in this table the timing of the clock switch unit is left blank, and the power is given an estimated value. Moreover, this table shows the power dissipation of the debug unit and the debug controller while they work in the debug state. When
Power (mW )
2.16
4.002
7.009
Debug data exchange channel
1.18/1.101
2.501
2.948
Clock domain converter
1.12/1.042
0.996
Clock switch unit
TABLE I R ESOURCE OF D EBUG M ODULES Module
Timing (ns)
Debug unit
1.270