Chapter 7
Debugging and Testing of Multi-Agent Systems using Design Artefacts David Poutakidis∗ , Michael Winikoff† , Lin Padgham, and Zhiyong Zhang
Abstract Agents are a promising technology for dealing with increasingly complex system development. An agent may have many ways of achieving a given task, and it selects the most appropriate way of dealing with a given task based on the context. Although this makes agents flexible and robust, it makes testing and debugging of agent systems challenging. This chapter presents two tools: one for generating test cases for unit testing agent systems, and one for debugging agent systems by monitoring a running system. Both tools are based on the thesis that design artefacts can be valuable resources in testing and debugging. An empirical evaluation that was performed with the debugging tool showed that the debugging tool was useful to developers, providing a significant improvement in the number of bugs that were fixed, and in the amount of time taken.
David Poutakidis Adaptive Intelligent Systems, Melbourne, Australia School of Computer Science & IT, RMIT University, Melbourne, Australia, e-mail:
[email protected] Michael Winikoff School of Computer Science & IT, RMIT University, Melbourne, Australia University of Otago, Dunedin, New Zealand, e-mail:
[email protected] Lin Padgham School of Computer Science & IT, RMIT University, Melbourne, Australia, e-mail:
[email protected] Zhiyong Zhang School of Computer Science & IT, RMIT University, Melbourne, Australia, e-mail:
[email protected] ∗
The work described here was done while Poutakidis was a PhD candidate at RMIT University †
The work described here was done while Winikoff was at RMIT University
R.H. Bordini et al. (eds.), Multi-Agent Programming, DOI 10.1007/978-0-387-89299-3_7, © Springer Science+Business Media, LLC 2009
215
216
Poutakidis et al.
7.1 Introduction “As soon as we started programming, we found to our surprise that it wasn’t as easy to get programs right as we had thought. Debugging had to be discovered. I can remember the exact instant when I realized that a large part of my life from then on was going to be spent in finding mistakes in my own programs.” — Maurice Wilkes
Agents are seen as a promising technology for dealing with increasingly complex system development, with a range of agent-based solutions having now been developed in a range of domains [4, 44]. Agents provide a flexible and robust approach to task achievement making them ideal for deployment in challenging environments. Agents can be equipped with multiple ways of achieving tasks, and depending on the task and the context in which the task should be completed, can select the most appropriate way for dealing with it. To support the development of agent systems a new field of software engineering, commonly referred to as agent-oriented software engineering, has emerged, in which the agent is proposed as the central design metaphor. A vital and time consuming part of any software engineering process is testing and debugging. However, the autonomous and distributed nature of agent systems, while modular and powerful, is notoriously difficult to test and debug [27]. It has been argued that multi-agent systems merely represent a specific form of distributed systems [51]. Several methods have been developed to assist in the debugging of distributed systems: recording a history of execution for analysis or replay [36]; animating the execution of a system at run-time by providing a visual representation of the program [8], and race detection algorithms to facilitate the detection of simultaneous access to shared resources [65, 47]. However, although debugging techniques developed for distributed systems can be used to facilitate the debugging of multi-agent systems to some extent, there are characteristics of agent systems that require specific attention. Traditional distributed systems support distributed information and algorithms whereas multi-agent systems address distributed tasks achieved by coarse grained agents. The individual agents within a multi-agent system are autonomous and they can act in complicated and sophisticated ways. Furthermore, the interactions between agents are complex and often unexpected. These issues and others need to be addressed for a multi-agent debugging approach. During testing and debugging the aim is to reconcile any differences between the actual program behaviour and the expected behaviour in order to uncover and resolve bugs. Current techniques fail to take advantage of the underlying design of systems to support the debugging task. This problem is best summed up by Hailpern & Santhanam [29]: There is a clear need for a stronger (automatic) link between the software design (what the code is intended to do) . . . and test execution (what is actually tested) in order to minimize the difficulty in identifying the offending code. . .
Our central thesis is that the design documents and system models developed when following an agent based software engineering methodology will be valuable resources
7 Debugging and Testing of Multi-Agent Systems using Design Artefacts
217
during the testing and debugging process and should facilitate the automatic or semiautomatic detection of errors. This chapter describes two tools that follow this central thesis and use design artefacts to assist in the testing and debugging process: 1. A testing tool [71] that uses design artefacts to generate test cases; and 2. A debugging tool [55, 59, 60, 61] that uses artefacts to monitor a system, and alerts the developer should the system deviate from the behaviour specified by the design artefacts. Although both tools use design artefacts, and focus on detecting errors, there are significant differences between them. Firstly, the testing tool does unit testing of entities within a single agent (e.g. plans, events, beliefs), whereas the debugging tool detects errors in a complete running system. Secondly, the testing tool detects certain domain-independent error conditions such as a plan never being used, whereas the debugging tool detects domain-specific error conditions relating to interaction protocols not being followed correctly1 . Thirdly, the debugging tool observes the system in action, leaving it up to the user to adequately exercise the system’s functionality. By contrast, the testing tool systematically generates a wide range of test cases. Thus the two tools are complementary: we envision that the testing tool would be used initially to do unit testing, and then, once the system is integrated, the debugging tool would be used to monitor the whole system. Both tools have been implemented, and the implementations were used for evaluation. The debugging tool is not yet integrated and documented in a manner suitable for public release, but is available from David Poutakidis on request. The testing tool is under further development and is not yet available. The remainder of this chapter is structured as follows. Section 7.2 reviews relevant background material, including previous work on testing and on debugging, and a review of the design artefacts that we use. Sections 7.3 and 7.4 respectively describe the testing and the debugging tools. We have chosen to have two “tool” sections, since we are describing two separate tools. Our evaluation is covered in section 7.5, and we conclude in section 7.6.
7.2 Background This section begins by reviewing model based testing (section 7.2.1), then briefly reviews related work on testing and on debugging (sections 7.2.2 and 7.2.3). We then (section 7.2.4) introduce the design artefacts that we use in the remainder of the chapter.
1
However, there is some overlap in functionality, in that both tools detect errors relating to coverage and overlap (see section 7.2.4.3).
218
Poutakidis et al.
7.2.1 Model Based Testing Model Based Testing ([1, 25]) proposes that testing be in some way based on models of the system, which are abstractions of the actual system, and can be used for automated generation of test cases. Automated test case generation is attractive because it has the potential to reduce the time required for testing, but perhaps more importantly it is likely to lead to far more testing being done, and hopefully therefore more robust systems. Design models which are developed as part of the process of developing the system are one kind of model which can readily be used for model based testing. They specify aspects of expected/designed system behaviour which can be systematically checked under a broad range of situations. Different approaches to model based testing have focussed on different kinds of models, which are then used to generate certain kinds of test cases. For example Apfelbaum and Doyle [1] describe model based testing focussing on use scenarios defined by sequences of actions and paths through the code, which are then used to generate the test cases. This kind of testing is similar to integration testing or acceptance testing. Others (e.g. [17]) focus on models that specify correct input and output data, but these are not so appropriate for testing of complex behaviour models. In current software development, some level of design modelling is almost always used. These design models specify certain aspects of the system, and can therefore be used as a basis against which to check runtime behaviour under a range of conditions. Substantial work has been done using UML models as the basis for model based testing approaches. Binder [5] summarised the elements of UML diagrams, exploring how these elements can be used for test design and how to develop UML models with sufficient information to produce test cases. He developed a range of testability extensions for each kind of UML diagram where such is needed for test generation. There are a number of agent system development methodologies, such as Tropos [46], Prometheus [53], MaSE [18] and others, which have well developed structured models that are potentially suitable as a basis for model based testing, in a similar way to the use of UML. The design artefacts representing aspects of these models are potentially well suited to use in guiding testing.
7.2.2 Testing Agent Systems There has been increasing work on testing of agent systems in recent years, with several systems using design models for some level of assistance in generation of test cases. One approach is to use existing design models to derive test cases. For instance, the eCAT system associated with Tropos [49] uses the goal hierarchy created during system specification in order to generate test suite skeletons, which must be completed by the developer/tester, and which are then run automatically. There has
7 Debugging and Testing of Multi-Agent Systems using Design Artefacts
219
also been work on generating test cases based on application domain ontologies [50]. The eCAT system also uses continuous testing of the system under development, an approach that could be used with our own testing tool as well. Another instance of deriving test cases from existing information is the work of Low et al. [38] which derives test cases for BDI systems based on the structure of plans. Their work investigates a range of criteria for test-case generation, and assesses the relationships between the different criteria, specifically which criteria subsume which other criteria. Another approach is to introduce new design artefacts that contain additional details which are used in testing. For instance, the work of Caire et al. [11] derives test cases from (additional) detailed design artefacts called “Multi-Agent Zoomable Behaviour Descriptions” (MAZBDs), which are based on UML activity diagrams. However, user intervention is required to derive test cases from the MAZBDs. A number of other agent development systems also have testing support subsystems, such as SUNIT [24] for SEAGENT, the JAT testing framework [13], and the testing framework of INGENIAS [28]. Testing is also discussed by Knublauch [35] and by Rouff [64]. However, all of these approaches require manual development of test cases, which may then be run automatically. To our knowledge, our testing tool is the only agent testing system which (a) focusses on unit testing, and (b) fully automates the generation of test cases as well as the running of them.
7.2.3 Debugging Although there is some speculation as to where the term bug was first used [14, 33] it is widely accepted that the term is used to describe a mistake, malfunction or error associated with a computer program. Most commonly we are able to identify that such a bug exists because some observed execution of a program (or observation of the recorded output of a program) does not conform with what is expected. From this we can define debugging in the following way: Debugging is the process of locating, analysing and correcting suspected errors [42]. To aid the debugging process debugging tools have been developed to help with all three of these activities. Fault localisation, which is defined by Hall et al. as tracing a bug to its cause [30], is seen by some as the most difficult part in debugging [34, 23, 68]. Indeed, most of the debugging support provided by debugging tools focusses on the process of localising a discovered fault. Such tools are typically tailored to a specific target programming language for which they have been designed. However, there are a number of features that one may come to expect from a debugging tool. Namely, tracing the execution of a program, defining breakpoints, and variable or memory display and manipulation. In the context of agents, a number of platforms (e.g. [48, 10, 58]) provide traditional debugging support, i.e. breakpoints, stepping through code, and an ability to display agent specific properties, such as goals and tasks.
220
Poutakidis et al.
Program tracing allows one to follow the executable program as lines in the source code are executed. This can be useful for understanding the flow of control within a program. Although, in a large search space or when long iteration sequences are being followed this can become difficult. Breakpoints are a special instruction that can be inserted into a program such that the program will halt when the instruction is reached. This is an efficient way of allowing a program to run to a specific location and then halt to allow some other debugging activity to occur from that point, for example, tracing from the breakpoint onwards, or inspecting the state of a variable and possibly changing it before continuing execution. For effective debugging sufficient understanding and comprehension of both the implemented system and the design that the system is based on are required. It is necessary to gain sufficient understanding of these two closely related parts of system development for the purposes of identifying and resolving behaviour that is not consistent with the design specification. Developing the necessary understanding of the implemented system can, to some degree, be accomplished by performing code walkthroughs, or more formally code inspections [26]. Code inspections are incrementally applied to parts of the source code to develop the necessary understanding of the system to uncover code defects. The utility of this process has also been shown to be effective [22, 40]. However, observing the behaviour of the system as it executes is still an extremely useful and common exercise that is employed by developers to obtain a more complete understanding of the behaviour of the implemented system. One issue is that, often, there is too much information available, and it can be hard for a developer to know what to focus on when debugging. An interesting approach to helping users understand the complex behaviours and interdependencies in applications is proposed in the Whyline framework where users are able to ask ‘why?’ or ‘why not?’ questions about observations they make while interacting with a system [45]. These questions, which are automatically derived, are typically of the form “why does property p of object o have value v?”. The Whyline system recursively traverses through the operations that cause properties to take on their values and provides an answer to the question. In a user study the Whyline approach was found to be very effective in improving understanding in computer programs. However, it is not clear how generally applicable the approach is. Another attempt at focusing the debugging task takes the approach of abstractions over the target program. This is especially important in domains such as distributed programming where the data, especially event data, can be overwhelming. By using the abstractions appropriate to developing distributed software Bates [2] has shown that a debugging system, consisting of a model builder, event models and an event recogniser can greatly reduce the amount of event information being propagated to the developer. Primitive event instances need to be defined such that they can be automatically identified in a program. Once identified the program needs to be modified to announce the event to an external component (such as the event recogniser). Models are built using an Event Description Language (EDL), as defined in [2]. With such a language one can build expressions
7 Debugging and Testing of Multi-Agent Systems using Design Artefacts
221
and further abstractions over the primitive events. Instead of being informed of the primitive event data, the developer is instead alerted to the meta events defined in the models. The benefit of such an approach is a greatly reduced amount of event information. One of the major limitations of this approach is that one needs to learn the EDL and also manually define the models used for comparison. The model is built on the users’ interpretation of how the system should behave, based on such things as their interpretation of potentially informal design documents. This leads to another concern that the abstractions that have been applied should not filter out any information required for a particular diagnosis. In addition the diagnosis can only be successful if the model developed is a correct representation of expected behaviour. Other noteworthy approaches to debugging include techniques such as program slicing [69, 6], algorithmic debugging [66] and model based diagnosis [12, 41, 70] which each provide support for automating, or partially automating, the debugging process.
7.2.4 Design Artefacts Both tools follow our central thesis, using design artefacts to assist in testing and debugging. This section briefly introduces the specific design artefacts that the tools use. The testing tool is a generic framework that can be applied to any agent based system with appropriate models available. The models against which it analyses test output are primarily design artefacts that describe the detailed structure within each agent: how plans, events, and data are connected. In the context of Prometheus this information can be found in Agent and Capability Overview Diagrams (see section 7.2.4.2), as well as information regarding coverage and overlap, extracted from message descriptors (section 7.2.4.3), which is also used by the debugging tool. In addition important information is extracted from the descriptor forms of beliefs, events and plans, regarding variables relevant to the entity, their types and value ranges, as well as potential relationships between them. For example a design descriptor of a plan to make a savings deposit, may state that there are two relevant variables: income and expenses. The relationship is that income > expenses (this is the context condition for this plan, which deposits the surplus to a savings account). Each are of type money with value range 0 to ∞. In addition to the information obtained from design descriptors, some additional information is added specifically for the purpose of testing. This includes links between design variables and their implementation counterparts, or some other method to allow assignment of values for the different test cases. It can also include application initialisation processes necessary before testing can commence, as well as such things as stubs for other system agents necessary for testing a particular unit.
222
Poutakidis et al.
The debugging framework we present is generic, and can be applied to a wide range of design artefacts. However, the tool that we have developed (and evaluated) exploits two particular design artefact types: interaction protocols (see section 7.2.4.1), and the coverage and overlap information mentioned above. Note that although our work has been done in the context of the Prometheus methodology [53], the approach is generic. Furthermore, the artefacts that we have chosen are ones that are common to many methodologies. Interaction protocols are used in many methodologies, and indeed, due to the adoption of Agent UML [3] by a number of methodologies, the same notation is widely used. Some form of structural diagram is used in all of the major methodologies, including Prometheus [53], MaSE [20], and Tropos [7]. On the other hand, coverage and overlap are specific details about the intent of event handling (in BDI2 systems) that are specified in the Prometheus methodology. In this chapter we are concerned more with using design artefacts, and less with how they are developed. We do note that methodological guidance is important, and that good tool support is invaluable in creating and, more importantly, maintaining designs. Fortunately, many methodologies provide mature tool support (e.g. [19, 43, 52]). We now discuss each of these design artefacts in turn.
7.2.4.1 Interaction Protocols Interaction protocols can be defined in a number of ways: as state machines [21, page 110], in which the states might express the concept of waiting for a message, and the transitions express the concept of sending/receiving a message [67]; as statecharts backed by a program logic with formal semantics [57]; as Petri nets where Petri net places specify protocol state and Petri net transitions encode message types [16, 62]; as standard UML [37], or more commonly with an extension to UML in the form of the Agent UML (AUML) notation [3]. In this chapter we focus on Petri nets: since they are simple and precisely defined they serve well as a lingua franca for other notations. Indeed, we have defined translations from the older version of AUML [3] into Petri nets [60], and also from the more recent version of AUML [32] into Petri nets [59, Chapter 4]. Additionally, we classify places as either message places, which correspond to a message in the protocol and do not have incoming transitions, or state places. Petri nets are a model of procedures that support the flow of information, in particular the concurrent flow of information. A Petri net (named after Carl Adam Petri) consists of places (depicted graphically as circles) and transitions (depicted graphically as rectangles). Places and transitions are linked by arcs which indicate the relation between the elements in the net. This relation is called the flowrelation, and the flow-relation may only connect places to transitions and transitions to places [63]. 2
Belief-Desire-Intention
7 Debugging and Testing of Multi-Agent Systems using Design Artefacts
P
A
A
P
Q Before firing
223
Place
Token
Transition
Arc
Q After firing
Fig. 7.1 Example of a Petri net firing
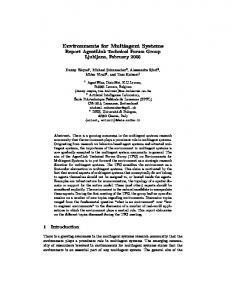
Additionally, places may contain tokens. The placement of tokens on a net is its marking, and executing (“firing”) a Petri net consists of moving tokens around according to a simple rule; the places, transitions, and the links between them remain unchanged. A transition in a Petri net is enabled if each incoming place (i.e. a place with an arrow going to the transition) has at least one token. An enabled transition can be fired by removing a token from each incoming place and placing a token on each outgoing place (i.e. each place with an arrow from the transition to it). For example, figure 7.1 shows a very simple Petri net, the transition in this Petri net is enabled because both state P and state A are marked. The transition fires by removing a token from state A and from state P and placing a token on state Q. In this chapter we present most of our discussions on Petri nets using this graphical notation. A formal definition is not required for this chapter, and can be found elsewhere [59].
7.2.4.2 Overview Diagrams Prometheus captures the static structure of the system being designed using a range of overview diagrams. Specifically, there is a single System Overview Diagram which captures the overall structure of the whole system; there is an Agent Overview Diagram for each agent type in the system; and there is a Capability Overview Diagram for each capability. These overview diagrams use a common notation where nodes represent entities in the design — with a different icon being used to distinguish between different entity type (e.g. agent, plan, protocol) — and relationships between entities are depicted using arrows between entities (optionally labelled with the nature of the relationship, where this isn’t clear from context) [54]. Figure 7.2 shows the notation used, and figure 7.3 depicts an example System Overview Diagram for a conference management system.
Poutakidis et al.
224
scenario
agent «info»
Activity actor
Goal «info» resource / data
capability
Plan
role
soft goal
conversation «info»
«info»
position
message (in) «info»
percept «info»
message (out) «info»
Service
action «info»
event
Fig. 7.2 Overview Diagram Notation (From [54])
Fig. 7.3 Example System Overview Diagram (From [54])
«info»
organization «info»
7 Debugging and Testing of Multi-Agent Systems using Design Artefacts
225
7.2.4.3 Descriptors The overview diagrams (system, agent, and capability) provide a graphical visualisation of the static structure of the system. As their names suggest, they are wellsuited to giving a high-level overview, but they are not intended for capturing the details of entities. Instead, in Prometheus, the details of entities are captured using descriptors. Each entity type has its own descriptor form, which is filled out for each instance of that type. For example, each agent (type) has its own agent descriptor form, which captures such information as how many instances of the agent type will exist at run-time, when these agent instances are created and destroyed, and what needs to be done to initialise an agent instance. For the unit testing currently covered by the testing tool, belief, plan and event descriptors are used. Much of the information from the overview diagrams is also available in the descriptor as it is automatically propagated. Both the debugging and testing tool use information relating to coverage and overlap (defined below) which is extracted from message3 descriptor forms. In BDI agent systems such as JACK [10], JAM [31], and Jadex [58] in which agents select an appropriate pre-defined plan from a plan library, one common cause of errors is incorrectly specifying when a plan should be selected by the agent for execution. This often results in one of two situations: either there is no plan suitable to respond to a given goal or event, resulting in the goal not being attempted or the event not being reacted to; or alternatively there may be multiple suitable plans, and the one chosen is not the one intended4 . The Prometheus methodology prompts the developer to consider how many plans are expected to be suitable for each event type in all possible situations. For each event the developer is asked to specify whether it is ever expected that either multiple plans will be applicable5 , or that no plans will be applicable. Two concepts are introduced within Prometheus in order to facilitate this consideration. They are coverage and overlap. Having full coverage specifies that the event is expected to have at least one applicable plan found under all circumstances. Overlap specifies that it is possible, although not required, that multiple plans are applicable at the time the event occurs. Full coverage means that the context conditions of the plans that are relevant for the event must not have any “holes”. An example of an unintended hole that can occur is if two plans are specified for an event, one with context temperature < 0◦ and the other with context temperature > 0◦ . T emperature = 0◦ is then a “hole” and if that is the situation when the event occurs, no plan will be applicable. If at design time the developer specifies that an event type has full coverage, and yet at run-time a situation occurs when there is no applicable plan for an event of that type, then an error can be reported. 3
Prometheus views events as being “internal messages”. Both these situations may occur legitimately, however, they are sometimes an indication of a problem. 5 A plan is applicable if its context condition is true at the current time. 4
226
Poutakidis et al.
For an event to have no overlap requires that the context conditions of plans relevant for that event are mutually exclusive. If overlap is intended, the developer is prompted to specify whether plans should be tried in a particular order, and if so how that will be accomplished. Overlap can occur when multiple plan types are applicable or when a single plan can result in multiple versions of itself based on the variable assignments that may occur during plan initialisation. For example, in JACK if there is more than one way to satisfy a context method’s logical expression, there will be multiple instances of the plan that are applicable. One applicable instance will be generated for each set of bindings that satisfy the context condition. The developer is also prompted at design time to specify which of these situations is expected if overlap is possible.
7.3 Testing Tool Description The testing tool that we have developed does automated generation and execution of test cases. Test cases cover the internals of agents. In order to do so we need to make some assumptions about how the agents are structured internally, and we assume that agents are designed and implemented in terms of the BDI architecture, that is that agents consist internally of event-triggered plans and beliefs (as well as capabilities [9], a modularisation construct introduced by JACK). In terms of design artefacts, we use the Prometheus structural overview diagrams and descriptor forms, but the information that we require could also be extracted from the sorts of information provided by other methodologies, or from the code itself. The approach followed aims to support a “test as you go” approach to unit testing of the building blocks within an individual agent, as the developer moves from design to code. There are of necessity some constraints in that it does not make sense to test units which have dependencies on other units, before those units themselves have been tested. Consequently ordering of testing of units is an important part of the tool, and units which are depended on must be tested (and therefore developed) before those depending on them, or at least, they must be appropriately stubbed. As was indicated in section 7.2.4 the basic units being tested are beliefs, plans and events. There are some nuances, as discussed in [71], but the dependencies are essentially that: • a plan is dependent on beliefs that it accesses, on subgoals/events/messages that it posts, and on anything on which these subgoals/events/messages are dependent; • an event/subgoal/message is dependent on plans that it triggers and all that these plans are dependent on; • beliefs are independent of other units; • cycles must be treated as a unit, as described in [71].
7 Debugging and Testing of Multi-Agent Systems using Design Artefacts
227
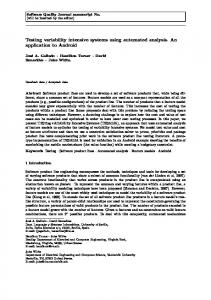
If testing all units within something such as a capability, or an agent (or any collection of units), an initial step is to generate the appropriate testing order for these units. Following this each unit is tested individually, by running a suite of automatically generated (or user defined) test cases. If a sufficiently serious error is encountered, no further testing will be attempted for units which depend on the unit for which an error was detected. The focus of the testing tool is to automatically generate and run a sufficiently comprehensive set of tests for each unit. However, there are cases where developers want, or need, to specify specific test cases, and this is also supported. User defined test cases are stored, and combined with system generated test cases each time testing is done. The overview of the testing process, using our tool, is as follows: 1. The user selects a set of units for test (often all units within a particular capability or agent). 2. Using the information available in the capability and agent overview models, the testing tool determines test case order. 3. Following the testing order, each unit is augmented with code to provide appropriate information to the testing system, and placed within the subsystem under test. 4. Units on which the unit under test is dependent are placed into the subsystem under test, with code augmented if needed. 5. Appropriate combinations of variable values are generated to adequately test the unit, using heuristics to reduce the number of cases as appropriate (see [71] for details). 6. The environment is initialised and a test cases for the unit is run for each set of variable values identified. 7. The data collected is analysed, and errors and warnings are recorded for the report. 8. Following completion of all tests on all units, a report is generated, providing both an overview and details. Problems are classified as either errors, or warnings. Figure 7.4 shows an abstract view of the testing framework for a plan unit. It has two distinct components, the test-driver and the subsystem under test. The testdriver component contains the test-agent, testing specific message-events that are sent to and from the test-agent, and a plan (test-driver plan) that initiates the testing process, and also sends certain results back to the testing agent. This plan is embedded into the subsystem under test as part of the code augmenting process. The subsystem under test is the portion of the system that is needed for testing of the unit under test and includes the units on which it depends. Figure 7.4 illustrates the steps in the testing process for a plan: the test-agent generates the test cases, and runs each test case by sending an activation message to the test-driver plan; the test-driver plan sets up the input and activates the subsystem under test that executes and sends information (via specially inserted code)
Poutakidis et al.
228 Test driver part
Activation Message
Test−Driver Plan
Subsystem under test posts
Triggering Event
sends sends sends
Finished Message agent Test Agent
Results Message
sends
Plan−under−Test
Fig. 7.4 Abstract Testing Framework for a Plan
back to the test-agent; when testing is complete the test-agent generates an HTML report providing both a summary and details of the testing results.
7.3.1 Errors detected As described earlier, our testing tool tests each belief, plan, and event, to ascertain whether, across a range of testing values, they behave as expected, based on the agent paradigm used, and on the specific application models, as exemplified in the relevant agent and capability overviews, as well as the descriptors. We list here the kind of errors that we are able to detect in the testing tool. Plan errors • Plan is never executed. If a plan is included in a system as one option for responding to an event/goal, one would expect to observe that it is used in some situations, if there is sufficient sampling of the state space. If when testing an event, some plan that is specified as triggered by that event never executes, then this is reported as a warning. This error is often caused by an incorrectly specified context condition of this plan, or another plan handling the same event. This can cause both to evaluate to true, unintentionally, and due to declaration order the other plan is always selected. This is however a warning only, as it is possible that the plan is developed only for use as a backup, if the intended plan (perhaps non-deterministically) fails. Also it is possible that despite an effort to cover the state space, a variable combination that would cause the context condition to evaluate to True was not selected. In this case, on reading the test report the developer/tester should add a test case which will ensure that the plan is chosen. • Context condition is never valid. If a context condition never evaluates to True, this is an indication that there is a problem. However, it is reported only as a warning, as it may be the case that (as above) the system, despite
7 Debugging and Testing of Multi-Agent Systems using Design Artefacts
229
its efforts, did not choose the correct set of variable values. As above, an appropriate test case should then be manually added. • Missing subtasks or messages. If there are events specified in the design to be generated from a plan, but these are not seen in any test case run, then this is likely to be an error. As above it is however possible that suitable values have not been chosen, in which case a test case should be manually added. • Plan does not complete. While it is difficult to determine whether a plan completes successfully or not, we can at least determine whether the plan executed to completion. If the plan does not complete then there is an error.6 Event errors • Failure to handle the event. If there is a test case for an event where the event has no applicable plan, then this indicates that there are gaps in what we call coverage. That is, there are some situations where there is no applicable plan to handle this event. This may be intended, but is in fact a very common cause of errors in agent programs. In the design descriptors for events in the Prometheus Design Tool (PDT), the developer notes whether coverage is intended. If it is, then this is a definite error. If not a warning is still generated to allow the developer to check that the lack of coverage was intended. • Multiple applicable plans. It is common that there are multiple applicable plans for handling an event. At design time this needs to be considered to ensure correct precedence in selection (if this matters). If the developer has indicated that overlap (the existence of multiple applicable plans in some situations) is not intended, then this is an error. A warning is always generated to allow easy checking of whether the overlap was intended, as this is a common cause of problems in practice. Unintended overlap easily results in a different plan being selected than that intended. Belief errors • Failure of basic operations. Basic operations of insert, update, delete and modify should work as expected. The testing framework attempts each of these operations on the beliefset and checks that the expected result holds using a beliefset query. • Failure to post specified events. Beliefsets can be specified to generate automatic events based on the basic behaviours of insert, modify, delete and update. If an event is not posted as expected, this is an error. • Posting of an event even if the corresponding beliefset operation fails. If for some reason a particular beliefset operation fails (e.g. insert may fail if the belief to be inserted already exists), then an automated event based on this operation should not be generated. If it is, then this is an error. The testing system currently only deals with testing of beliefs that are part of the agent’s explicit beliefset structure. In fact any arbitrary data can represent aspects 6
When deployed, a plan may well fail due to some change in the environment after the time it was selected. However, in the controlled testing situation where there are no external changes, a plan that does not complete properly (due to failure at some step) should not have been selected.
230
Poutakidis et al.
of the agent’s beliefs, but these are not currently tested, other than as they are used by plans. Faults identified (or possible faults) are categorised into different levels in order to specify the effect that they should have with regard to running an entire test suite. If a definite error is identified within a particular unit, there is no point testing other units dependent on it, and all such scheduled tests should be aborted until the problem is fixed. However if a warning is identified, this may be simply because suitable test cases have not been identified. The user can specify whether they wish the testing to continue or to abort in such situations, with regard to dependent units.
7.3.2 Test case input An aim of testing is to generate a range of test cases that adequately covers the entire space of situations that can be encountered. Specifying a comprehensive set of test cases for each unit is tedious and time consuming, and so we have automated this in an attempt to obtain good coverage. However, we also allow for specification of specific test cases by the developer/tester. Once specified these are stored and always used when the unit is tested, in addition to those automatically generated. The test cases are comprised of combinations of relevant variable values, which must then be initialised within the environment of the unit to be tested, or must be part of the input to the test. Relevant variables include those within an event, those referenced in a plan’s context condition or body, and those within a beliefset. We require the design documentation for a particular unit to identify the variables that affect that unit, as well as a mapping to enable values to be assigned to these variables during the testing process. In order to generate the value combinations that define the different test cases, we employ the following steps: 1. Variable extraction from the design documents. 2. Generation of equivalence classes within the input range of each variable. 3. Generation of combinations of the equivalence classes using a heuristic to reduce the number of different combinations. 4. Generation of specific input values. Values that are within the specified range for a particular variable we call valid values, while ones outside the specified range we call invalid. We test using both valid and invalid values, under the assumption that the system should gracefully degrade in the presence of invalid input, rather than crash. Partitioning into equivalence classes [56, p.67] [5, p.401] allows us to obtain groupings of values where it is assumed that any value in the group will be processed similarly. We use standard techniques to create equivalence class structures with five fields:7 7
More complete details are available in [71].
7 Debugging and Testing of Multi-Agent Systems using Design Artefacts
231
var-name: The name of the variable. index: A unique identifier. domain: An open interval or a concrete value. validity: Whether the domain is valid or invalid. sample: A sample value from the domain: if the domain is an open interval (e.g. (0.0, +∞)), it is a random value in this interval (e.g 778); if the domain is a concrete value (x=3), it is this value. As the number of all possible combinations of equivalence classes can be very large, we use combinatorial design [15]. to generate a reduced set of value combinations that cover all n-wise (n≥2) interactions among the test parameters and their values. We use the CT S (Combinational Testing Service) software library of Hartman and Raskin8 which implements this approach. Where viable, we do however ensure that all combinations of valid data are used to increase the likelihood that all options through the code are exercised. 1. 2. 3. 4. 5.
7.3.3 The testing report Once a suite of test cases have been run an HTML report is generated to allow the developer/tester to view the test results. The overview lists the agent that the units tested belong to, the number of units tested for that agent, the number of faults found and whether they were warnings or errors. The summaries for each unit can then be accessed via a link, and figure 7.5 shows an example of such a summary for the plan “Book_Query”. As shown in figure 7.5 it is then possible to review the specific values for the problematic test cases, in order to assess modifications needed. In some cases, as for the second fault in “Book_Query”, there is not a specific test case which causes the problem, but rather the fault arises from an analysis across the range of test cases. In this example “Book_Query” is specified to post the message “Check_Category”. This means that in some situation such a message would be posted by this plan. If in the set of test cases generated to cover the range of values of variables, the message is never posted, it is an indication either that there is an error, or that a suitable test case has not been generated to exercise this posting. Sometimes, by providing an appropriate test case, such faults can be eliminated.
7.3.4 Evaluation An initial validation of the testing tool has been done using the case study of the Electronic Bookstore system as described in [53]. The Stock Manager agent was implemented according to the design specified, and then deliberately seeded with a range of faults, such as failing to post an expected message. Examples of each 8
http://www.alphaworks.ibm.com/tech/cts
232
Poutakidis et al.
Fig. 7.5 Example of portions of testing report
of the kinds of faults discussed above, were introduced into the Stock Manager agent; for instance, the Stock Manager agent is designed with the plan Out of stock response, which posts the subtask Decide supplier, if the default supplier is out of stock and the number of books ordered is not greater than 100. The code was modified so that the condition check never returned true, resulting in the Decide supplier subtask never being posted. The testing framework generator automatically generated the testing framework for the testable units of the Stock Manager, and then executed the testing process for each unit following the sequence determined by the testing-order algorithm. For each unit, the testing framework ran one test suite, which was composed of a set of test cases, with each case having as
7 Debugging and Testing of Multi-Agent Systems using Design Artefacts
233
input one of the value combinations determined. Further details and examples are described in [71]. All faults were successfully found by the tool, which generated a total of 252 test cases. We are currently in the process of doing a more thorough evaluation, using a number of programs with design models, developed as part of a class on Agent Programming and Design. Once this is completed we will be able to comment on the kind of faults identified and the relationship of these to errors identified during marking the assignments. We have also evaluated the testing system on a demonstration program developed for teaching purposes. In this program 22 units were tested with 208 automatically generated test cases. This uncovered 2 errors where messages were not posted as specified in the design (apparently due to unfinished coding), and one error where certain data caused an exception to be thrown, due to a certain input data type that can not currently be handled by the testing tool (the tool is under improvement to solve this issue). This program had been tested by its developer, so the results of this testing process would seem to indicate that the generation and execution of automated test cases were effective in uncovering bugs in the system. However the testing tool is limited in what it tests for. It does not currently test for any higher level functionality, such as agent interaction according to specified processes, or the satisfactory following of scenarios as specified during requirements. We plan to add these aspects of testing in future work. Our debugging tool (described in the next section) should be able to be combined with automated generation of variable values and a test harness, to realise focussed interaction testing.
7.4 Debugging Tool Description In this section we describe the debugging tool. We begin (section 7.4.1) by describing the debugging framework which the tool instantiates. We then discuss the types of bugs that can occur in interactions (section 7.4.2) before proceeding to discuss how interactions are monitored (section 7.4.3) and how erroneous interactions can be identified (section 7.4.4) and reported (section 7.4.5).
7.4.1 Architecture of the Debugging Framework The debugging framework that we have developed uses the design artefacts, applying to them a process to produce debugging components to facilitate the automatic debugging of agent systems. The debugging framework is based on the premise that we can utilise the system design artefacts as a partial specification of correct system behaviour. We describe this framework in terms of the processes that are applied as well as the underlying debugging infrastructure required to support
234
Poutakidis et al.
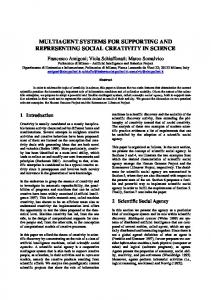
the observation of the system, comparison of the system against the developed debugging artefacts, and the reporting of the system to the user. Figure 7.6 provides an overview of our debugging framework. This consists of a set of debugging components, framed with a solid line and annotated with C1, C2, and so on, that together represent the run-time debugging environment. In addition to the debugging components are a set of processes, framed with a broken line and annotated with P1, P2, and so on, that represent the processes that need to be applied to generate the debugging components. The run-time system (C1) in the center of the figure depicts the agent system that is the focus of the debugging exercise. It is developed using the system design artefacts (P1). During execution the run-time system sends information to one or more monitoring components (C3). The monitoring components are supplied by a library of debugging artefacts that specify correct system behaviour (C2). The debugging artefacts represent a partial model of correct behaviour that is generated by following processes P1 through P3. The processes in the debugging framework specify how to develop a suitable debugging component from a system design artefact. Each of the design artefacts from the set of system design artefacts (P1) are considered. From these we identify and select suitable design artefacts that could be used as debugging components (P2). From the identified artefacts we develop a partial model of correct system behaviour. This requires that we develop a machine interpretable format for the design artefacts (P3). Each of the developed debugging artefacts feed into the library of debugging artefacts that is used in the monitoring component for run-time debugging. The monitoring components are where the comparison between actual system behaviour and expected system behaviour is carried out. Before such a comparison can be carried out we must determine a method for extracting the relevant run-time information from the run-time system that should be sent to the monitoring components. The necessary information is identified and the source code is instrumented (P4) so that when certain events of interest occur in the system they are forwarded onto the monitoring components for consideration. Once the system has been modified to send the relevant information it can be compared to the debugging artefact and then a report can be sent to the user via the user interface in (C4). In this chapter we focus our attention on two important design artefacts, Interaction Protocols for detecting interaction related bugs and Event Descriptors for detecting incorrect interactions between events and plans (as discussed in section 7.2.4.3). The debugging framework is generic: it does not make any assumptions about agent architectures or implementation platforms. However, when instantiating the framework in a tool, we must select design artefacts, and the choice may result in assumptions about the agent architecture. For example, debugging incorrect interactions between events and plans assumes that agents are implemented in terms of these concepts, i.e. that a BDI-like platform is used. On the other hand, no as-
7 Debugging and Testing of Multi-Agent Systems using Design Artefacts
235
(P2)
(P1)
Identify suitable design artefacts.
System Design Artefacts
(P4)
(C1)
Instrument source code.
Event
Interaction
Monitor
Monitor
Runtime System
Other Monitoring Structures
Generate suitable machine interpretable format.
(C2)
Library of debugging artefacts specifying correct behaviour.
Monitoring Components (C3)
(C4)
Reporting to the User
Fig. 7.6 Debugging Framework
(P3)
236
Poutakidis et al.
sumptions about the agent architecture are required in order to debug interaction related bugs. This framework forms the foundations of our approach to debugging multi-agent system. Before we move forward and discuss the generation of the different debugging artefacts we will first provide a review of the types of bugs that we will expect to resolve.
7.4.2 Types of Bugs Interaction related bugs, where agents at run-time do not interact with each other as expected, are a common source of problems in multi-agent systems. Following is a discussion of several types of interaction related bugs that we have identified as being characteristic in multi-agent systems. • Sending the wrong message: We define the sending the wrong message bug as the act of an agent sending a message that is not appropriate given the current expectations as defined by the protocol. This bug represents the case where the protocol requires an agent to send message m1 but instead some other message, m2, is sent. Typically m2 is a message that is valid at some other point in the protocol, but it may also be a message that is never valid in the protocol that the agents are meant to be following. • Failure to send a message: We define failure to send a message as the act of an agent failing to send a message when the protocol required that one be sent. Failing to send a message when one is expected is often symptomatic of a failure in some part of the agent system. When developing the agent goals and plans the requirements of the protocols are considered. Failure to respond according to the protocol can be an indication that the agent or some part of the agent has stopped functioning correctly. • Sending a message to the wrong recipient: We define sending a message to the wrong recipient as the act of sending a message to an agent that is not the intended recipient as specified by the protocol design. When sending a message to another agent the receiver is chosen and explicitly referenced in the message header. If at run-time the message is sent to a different agent than that specified in the design this is incorrect. The wrong recipient may be wrong based on the agent role that received the message, or could be wrong based on the agent bindings that may have already occurred in a conversation. • Sending the same message multiple times: We define sending the same message multiple times as the act of an agent incorrectly sending the same message multiple times when only one message should have been sent. When an agent wishes to send a message to another agent it should do so only once, unless the interaction protocol or some other logic dictates otherwise.
7 Debugging and Testing of Multi-Agent Systems using Design Artefacts
237
If the same message is sent multiple times it is possible that the message will be processed by the receiving agent multiple times. Doing so could result in incorrect or unexpected behaviour. For instance if a customer agent sends a message to purchase goods from a merchant multiple times, it is likely that the merchant will also process the order multiple times, sending more than one order. Although sending a message more than once may seem to be unlikely, it is, in fact, behaviour that can arise due to the failure handling mechanism used by a range of BDI systems. In such systems it is common to have a number of different ways of achieving the goals that the agent adopts. The choice of plan is made at run-time and it is inside these plans that the messages are created and transmitted to other agents. The plan failure mechanism within these systems enables the agent to select alternative plans if a plan fails to achieve the goal for which it is selected. If the same plan can be retried after a message is sent but before the goal is achieved, or if alternative plans can be tried that send the same message upon failure then unless care is taken it is possible that the agent is unaware that it might have sent the same message multiple times.
7.4.3 Monitoring Interactions We now discuss how we use derived Petri net protocols to monitor and provide useful information about the interactions occurring between agents to support the debugging of multi-agent systems. We present the Interaction Monitor: an instance of the abstract Monitoring component discussed in section 7.4.1. The Interaction Monitor is responsible for processing messages that are exchanged within the system by modelling the messages as conversations within the Petri net protocols. In addition to the mechanics of the Petri nets, the Interaction Monitor utilises a number of other processes and algorithms to determine the correctness of the messages exchanged in the monitored system. Following this, we describe how the Interaction Monitor detects the bug types which we have identified. Each of the bug types that were introduced in section 7.4.2 are discussed. Reporting the results of the Interaction Monitor is carried out by a reporting interface that we have developed as part of our Debugging Toolkit. The reporting interface is a basic prototype tool that we use to convey the results of the Interaction Monitor to the developer. Modelling and processing conversations occurs within the debugging framework introduced in section 7.4.1. Figure 7.7 shows an abstract view of the Interaction Monitor which is responsible for debugging agent interactions in a deployed multi-agent system. The Interaction Monitor is responsible for processing messages within the Petri net protocols for the purpose of detecting erroneous interactions. It is composed of a message queue that is used to store the incoming messages while an existing message is being processed, and a Conversation List which contains the set of active conversations. Messages are removed from the
Poutakidis et al.
238
M5
Message Queue M6 M1
M2
M3
M4
Conversation List ID=01
ID=02
ID=03
PPL
PPL
PPL
P1
P1
P1
P2
P2
P2
P3
P3
Fig. 7.7 Overview of the Interaction Monitor.
message queue and partitioned into conversations based on the conversation id that is included with each message9 . When a message is removed from the queue the conversation id is inspected. The first step in processing the message is to determine which conversation it belongs to. If the conversation id matches any active conversations then the message is directed to the respective conversation. If, however, the conversation id is not matched to a conversation a new conversation is initialised. We construct a conversation list which is used to hold all of the active conversations occurring in the multi-agent system. Each conversation is comprised of a conversation id, a Possible Protocol List (PPL), and a role map (not shown in figure 7.7) which is used to map agent instances with role types and is used to reason about role related bugs. The PPL contains an instantiation of each of the protocols that could be the protocol that the agents are using to direct their conversation. We need the PPL because we do not require that the agents include the name of the protocol when sending messages to one another, and take the view that each protocol in the PPL is potentially the protocol that the agents are fol9
The agents are required to create new conversation ids for new conversations, and then to include the relevant conversation id with each message.
7 Debugging and Testing of Multi-Agent Systems using Design Artefacts
239
lowing. When a message sequence violates a protocol we mark it as in error and continue to process any other remaining possible protocols. Initially the conversation list is empty. Upon removing a message from the message queue a conversation is created and the message is modelled in the conversation. If a conversation already exists, because the currently dequeued message shares the same conversation id as a previously received message, then the message is added to that conversation. Adding a message to a conversation is done by adding it to each of the protocols in the PPL. The message is simulated as a token in the Petri nets and the Petri nets are fired to enable any valid transitions. The protocols are then checked for errors and if necessary the user is alerted. The following summarises the monitoring procedure that we use to detect protocol related errors. Below we discuss the details for steps 1, 2, 6, and 8. Steps 3, 4, 5, 7 and 11 are trivial and do not require further discussion. Step 9 is covered in section 7.4.4 and step 10 is discussed in section 7.4.5.
1 2 3 4 5 6 7 8 9 10 11
intercept a message; add message to queue; while message queue is not empty do remove message from head of queue; if message does not belong to an existing conversation then initialise a new conversation; end add message to each protocol in the PPL for the relevant conversation and fire Petri nets; check for errors; report errors if necessary; end
7.4.3.1 Intercepting Messages (steps 1 and 2) The Interaction Monitor needs to receive a copy of every message that is transmitted in the system that it monitors. The mechanism for sending a copy of the message to the Interaction Monitor will be platform dependent. However, the technique of overloading which we use in our JACK prototype should be generally applicable. We overload the JACK send method so that each time it is invoked a message is also sent to the Interaction Monitor. This approach does not intrude on the developer, nor does it complicate the source code that the developer works with. The overhead in relation to the number of messages transmitted in the system is for every message sent, a copy of the message is also sent to the Interaction Monitor. If the target system is highly timing dependent then the additional messages
240
Poutakidis et al.
being transmitted and the additional time taken to transmit a carbon copy of messages may affect the system’s behaviour. This is a standard concern with adding debugging support to timing dependent systems. The benefit of the debugging support will need to be considered in terms of the possibility of adversely affecting the execution of the system. However, given that multi-agent systems are designed to function with often unknown numbers of agents, and hence unknown numbers of messages, this overhead should not prove a problem in any but the most sensitive systems.
7.4.3.2 Initialising a Conversation (step 6) Initialising a new conversation is primarily concerned with identifying and setting up the Petri net protocols so that the conversation can be modelled. A given message may require the initialisation of multiple interaction protocols, depending on the number of protocols for which the start message matches. Further, the starting message of a protocol is not guaranteed to be unique: for example, both the Contract Net protocol and the Iterated Contract Net protocol have a cfp message as their starting message. The process for creating a new conversation involves searching the Protocol Library for all correct protocols that could possibly be used to model the conversation. The protocols that will be used to model the conversation will be the protocols that have an initial message that matches the message type of the sent message m. We define an initial message as any message in a protocol from the Protocol Library where the message place in the Petri net has an outgoing transition that is also an outgoing transition of the start state (recall that the start state is the only non-message state that has no incoming transitions). For example, in figure 7.8, request is an initial message because it shares an outgoing transition (T1) with the start place (A). Note that identifying the initial messages for each protocol can be computed in advance. The Interaction Monitor creates a copy of each matching protocol (i.e. one with an initial message that matches the dequeued message) initialises the protocol by placing a token on its start place, and adds the protocol to the PPL of the conversation.
7.4.3.3 Add Message and Fire Petri Nets (step 8) After a conversation has been initialised, and the PPL contains at least one protocol, the currently dequeued message is added to each of the Petri nets in the PPL. The message place matching the dequeued message is identified and a token is created and deposited onto the place. The Petri net is fired to allow for any enabled transition to fire and the tokens are removed and deposited in the standard method for Petri nets.
7 Debugging and Testing of Multi-Agent Systems using Design Artefacts
241
Messages will be processed inside the Petri net in this manner until either an error is detected or the Petri net protocol terminates successfully. A conversation is said to have successfully terminated if all tokens in the net reside on a final state place. A final state place is any state place that is not an input to any transition. When one of the valid protocols terminates successfully the conversation is marked as successfully terminating, indicating that no errors were detected in the protocol. Given that the PPL may contain other currently valid protocols, it is possible that after one protocol terminates successfully there are other protocols that are not in error but also are not complete. Any further messages received in a conversation that has an already terminated protocol will still be processed inside the other relevant protocols, and in the event that one of these protocols results in an error this will be indicated to the user.
7.4.4 Identifying Erroneous Interactions The reason for processing messages inside Petri nets is to identify erroneous situations. For example, if a wrong message is sent we would want to identify this and report it accordingly. Identifying information such as this is precisely how we use the Petri net models of agent interactions to assist in debugging interactions. We can determine the state of a Petri net protocol by considering the distribution of tokens over places. Inspection of the Petri net can indicate, among other things, the current state of the conversation and the next valid message. This is an important property that we leverage to help identify errors, and provide useful debugging information. The various methods that we employ to identify errors will be the subject of this section. We now discuss the following three cases: 1. Observing a wrong message (which includes sending a message multiple times) 2. Failure to observe a message 3. Role-related errors (including situations where the message is correct, but the recipient or sender is the wrong agent)
7.4.4.1 Observing a Wrong Message Sending the wrong message is characterised by an agent sending a message that is not valid. There are two main cases that we focus on: (A) the message not being valid in the protocol at all, and (B) the message not being valid at the current time (because of the previous messages that have been sent). Case (A) is detected by identifying that the message does not match any messages in any of the protocols in the PPL. Case (B) is identified when the message does not successfully fire any transitions in any protocol. We now consider case (B), where the message is valid in the protocol but is not valid given the current state of the protocol. We begin this discussion starting from
Poutakidis et al.
242
the protocol state represented by figure 7.8. At this point the participant agent has agreed to perform the required task. Consider what happens if the next message sent and subsequently received into the Petri net is a refuse message. A token will be generated and the refuse message place will be located and a token deposited onto it. When the Petri net fires no transition is enabled. For a transition to fire there would need to be a token on state place B, which would enable transition T2. The conversation has already transitioned beyond this state, hence, the addition of the message does not trigger any transitions. request
(Start A place)
T1 refuse
C
accept
B
T2
T3
failure
inform−result
inform−done
D
T4 E
T5 F
T6 G
(d) Result of second Firing of the Petri Net
Fig. 7.8 Modelling a conversation following the FIPA request protocol.
We use the following logic to determine that this behaviour indicates an error in the conversation: when a token is deposited onto a message place the token represents the receipt of a message. If the message is valid, based on the current state of the conversation, a transition should be enabled to advance the protocol into a subsequent valid state. If no transition is enabled the message must not have been valid. Therefore, if after adding the message token and checking for enabled transitions (firing the net), a token still resides on a message place it can be concluded that the message was sent at the wrong time. As discussed previously the protocol is marked as in error but the conversation only reports an error if no error-free protocols remain in the PPL. In addition to identifying the error we can also identify the set of valid messages based on the current marking of the Petri net. We identify the valid messages by locating any message place that shares an outgoing transition with any state place
7 Debugging and Testing of Multi-Agent Systems using Design Artefacts
243
that contains a token. For example, in figure 7.8 both failure and inform-result share an outgoing transition with state place D, and hence are valid messages.
7.4.4.2 Failure to Observe a Message Thus far, we have described error detection based on receipt of messages. The Interaction Monitor receives a message and determines if it is valid based on the current state of the conversation. This process will not identify conditions in which an agent has failed to act, rather than acted in the wrong way. In terms of interaction modelling, this problem is characterised by an agent not sending a message that it was expected to send. In a framework based on observations, we need to consider the issue of observing something that does not happen. To enable this we need to redefine our semantics of observation, from those in which the observer waits forever for an event to occur, to one in which the observer waits for an event to occur over a specific time period. Under such conditions an observer can make assertions such as over time period t, event e has not been observed to have occurred. When developing an interaction protocol there is an expectation that if an agent receives a message it will reply with an appropriate message. Yet, although protocols can be specified with deadlines for message transmission this feature is often not used10 . The reason that time limits are not imposed on the replying agent is that there is an expectation that the agent will reply as soon as is practicable. Given that agents can engage in multiple dialogues, waiting for a reply in one conversation does not have an impact on executing another. There is, however, an expectation that the reply will be made in a reasonable time. Identifying when a failure has occurred requires that we both determine a time frame for each message and devise a method for determining when the time frame has been exceeded. The first problem is one that should be considered by the developers of the system. If one wishes to have support for identifying when a message is not sent, then, effort must be expended to determine the timing constraints on the interactions. Each protocol, or if desired, each protocol state, must have a duration added. The time limit will indicate the duration that the Interaction Monitor will use to determine if a message has been received. To support the detection of a failure to send a message we add timer support to the Interaction Monitor. The state places of the Petri net protocols (representing the state the conversation is in) have a timer added such that whenever a token is deposited the timer is triggered. When a valid message for the current state of the conversation is received a transition is enabled and the token that was marking the state is removed and a new token is generated on another state place. The removal of the token from the state place stops the timer indicating that the message has advanced the state of the conversation. If a timer expires it is inferred that a mes10
Auction protocols are a notable exception, however only the initial propose message has a deadline.
244
Poutakidis et al.
sage that should have been sent has not been sent, hence the error: failure to send a message. In the event that a timer does expire the Interaction Monitor is able to report the current state of the conversation and can indicate the next valid messages. However, instead of reporting an error, a warning is reported. We view the failure to send a message as a warning rather than an error because it is possible that too short a timer has been set. In the early stages of development the timing characteristics of the system may not be well understood and may require refinement. By reporting a warning we are able to alert the developers to possible problems for investigation. In terms of processing messages into the protocols stored in the Possible Protocols List, those protocols that have been marked as a warning are handled differently to a protocol that has been marked as an error. When a conversation is considered to be in error no more messages are delivered to the Petri net. In the case of a warning, messages are still delivered and processed by the Petri net. If a message that was previously marked as not being received subsequently arrives then the status of the Petri net will be changed to reflect that the conversation has returned to an active, valid state. Or in the case that the message was invalid, the protocol can then be marked with an error.
7.4.4.3 Role-related Errors During the initialisation phase we also assign agent instances to roles for each of the protocols in the PPL. The protocols are specified with role types and each role type is associated with a set of messages that it can send and a set of messages that it can receive. By mapping agent instances to roles in this way we are then in a position to identify certain role related errors. Roles are assigned to agent instances based on the contents of the header of the initial message that triggered the creation of a new conversation. The sending agent, whose name appears in the sender field of the message header, is mapped to the role that triggers the conversation. The recipient of the message, whose name appears in the recipient field, is mapped to the role that receives the message in the protocol. Once roles have been mapped to agent instances any message that appears in the conversation will only be considered valid if it first matches the role mapping. We consider the information relating to both the sender and the recipient of a message when performing the role checks. In the event that there are more than two roles in a protocol the role map will not be completely assigned after the first message is sent. Subsequent messages will be used to assign any unmapped roles. To illustrate the role mapping consider the situation where the Interaction Monitor receives a propose message that was sent from agent A to agent B. In this example there is only one protocol that matches the propose message. The messages that are valid for the initiator are: h initiator ⇒ propose i
7 Debugging and Testing of Multi-Agent Systems using Design Artefacts
245
The messages that are valid for the participant are: h participant ⇒ accept, refuse, failure , inform-done, inform-result i Since we are in the initialisation phase we simply map the agents to the roles for this protocol. Agent A is mapped to the initiator role and agent B is mapped to the participant role. For all subsequent messages that are exchanged in this conversation the role map is queried to verify that the sender and receiver fields in the message header match those that have been defined in the role mapping. Or if roles are appearing for the first time the agent instances are mapped and added to the role map. The role mapping procedure supports the mapping of agent instances to multiple roles within the same conversation. This is achieved by allowing a one to many association in the mapping procedure which allows agent instances to play multiple roles. Since role mappings are done at the conversation level there is no restriction placed on which roles an agent plays in different conversations. For example, an agent can play an initiator in one conversation and a participant in another. Having developed a procedure for mapping agent instances to roles we are in a position to identify certain errors to do with the sending and receiving of messages. We had previously stated that the rule for depositing a token into the net was to locate the message place that matched the received message and generate a token on that place. However, once the message place has been located a further check is performed to ensure that the agent that sent the message was permitted to send it, and that the recipient is permitted to receive it. This is the verification of the role assignments. Using the role map we can identify two different errors. Sending a message to the wrong agent, and the wrong agent sending a message. Both are identified in the same manner. After the first message from each role has been sent any further messages must conform to the (possibly partial) mapping established. When a message is received the sender and receiver are extracted from the message and compared against the role map. If either of the two fields conflict with what is stored in the mapping no token is generated for the Petri net. Instead, the Petri net is marked as being in error for either sending a message to the wrong recipient, or the wrong agent sending a message.
7.4.5 Reporting Errors When an interaction is found to be in error it is necessary to communicate this fact to the developer. In reporting errors (or warnings) we include a range of information such as which protocol was being followed, which agent instances were mapped to which roles, and the point at which a conversation diverged from the allowed behaviour. This information can assist in locating the underlying error in the agent code that is the cause of a bug.
246
Poutakidis et al.
The examples in this section are from the meeting scheduler application which was used for evaluation (see section 7.5.1 for details). We have developed a simple prototype interface to display information about the status of active and completed conversations that occur in the deployed multiagent system. The prototype interface also reports coverage and overlap errors. The user interface provides a collection of tabbed text areas, one for each conversation. Each of the conversation panels displays the status of the conversation by both a text description of the status and the icon on the conversation tab. The text area is responsible for displaying the messages received for each conversation. While a conversation is progressing correctly the text area in the tool will simply output each of the messages in the form11 :
AddTaskEv(Lenny -> Carl) Possible Protocols: AddTask, AddTaskMoveTask When a conversation is known to be in error, i.e. there are no remaining possible protocols that are not in error, the relevant conversation’s tab has a red cross added, and the text area provides details of the error, with a message of the form:
*** ERROR TaskAddedByDP (Lenny -> Carl) Message is not a valid start message In this example the conversation is in error because the message that was sent as the first message in the conversation is not a start message in any of the protocols within the system, hence an error is immediately reported. The Interaction Monitor keeps track of the time elapsed since the last message is received in a conversation. If the time exceeds the developer defined duration then a warning can be reported by changing the conversation’s tab label to include a warning icon and giving a warning message which indicates what messages were expected based on the current state of each protocol in the PPL:
*** WARNING. Expected a message by now. Expected: AddTaskToDPEv from AddTaskProtocol. AddTaskToDPEv from AddTaskMoveTask protocol.
11
In the interests of brevity and readability we have simply provided the output text, rather than given screenshots.
7 Debugging and Testing of Multi-Agent Systems using Design Artefacts
247
Since this is only a warning, if a correct message is received after the conversation has been set to a warning then normal operation can continue. The conversation is switched back to active and the warning icon is removed. When a conversation completes successfully the icon on the tab will change to a green tick and a message will be displayed indicating that the conversation has completed successfully:
TaskAddedEv (TodoList@John -> GUIProxy) Conversation finished successfully If any further messages are received with the conversation id of an already completed conversation they will cause the conversation to be in error. In the current version of the reporting interface all previous conversation panels are retained. If the number of conversations becomes large it would not be practical to keep the successfully completed panels on the main interface. A first step would be to move the completed conversation panels to a secondary location. From the user’s perspective using the debugging tool is non-intrusive: the application being developed is run and tested as normal, and the debugging tool monitors its behaviour and reports errors/warnings.
7.5 Evaluation of the Debugging Tool We wish to evaluate the degree to which such debugging support translates to an improvement in debugging performance. In the background section we discussed the three main stages that a user will proceed through during a debugging task. These are, firstly, identifying the bug by identifying that the program is not acting as expected. Secondly, locating the cause of the bug, by locating the part (or parts) of the source code that are responsible for the bug. And finally, fixing the bug by providing the necessary source code modifications to remove the bug. For each of these — identification, location and fixing — we investigate to what extent our tool assists. We measure both overall success, i.e. the number of programmers who were able to identify/locate/fix a given bug, and also the time that they took to do so.
7.5.1 Experimental Process The multi-agent test application that we developed for the experiment is a multiuser personal organiser (called “MAPO”) with support for managing a user’s daily activities. A user can add tasks and meetings with properties such as duration, pri-
248
Poutakidis et al.
ority and deadlines. MAPO automatically schedules (and re-schedules) tasks and meetings. The application was designed using the Prometheus methodology [53] and was implemented using the JACK Intelligent Agents programming platform [10]. Each user is support by an instance of the MAPO system, which contains 5 agent types which use 55 plans to handle 63 event types. For our experiments we used three instances of MAPO (corresponding to three hypothetical users). Four variants of MAPO were developed, each seeded with a different bug. Bugs one and two were of the plan selection type as discussed in section 7.2.4.3, and Bugs three and four were of the interaction type as described in section 7.4.2. Since MAPO was developed using JACK, participants in the experiment had to be familiar with the JACK platform. We contacted members of the local agent community in Melbourne, Australia, an email was also sent to an international JACK programming mailing list, and finally the developers of the JACK programming platform were contacted for participation. In total 20 subjects completed the experiment with the majority (17) being from Melbourne, Australia. To ensure comparable levels of ability between groups. we administered a preexperiment survey to measure the experience and ability of each participant with regard to programming generally and specifically programming on an agent platform such as JACK. The surveys were evaluated and the participants were assigned to one of three categories: beginner, intermediate and advanced. We then randomly allocated equal numbers of each category to the two groups. Group A used the debugging tool for bugs 1 and 2 but not for bugs 3 and 4, whereas Group B used the debugging tool for bugs 3 and 4 but not for bugs 1 and 2. By having each participant work both with and without our tool, we were able to compare the performance of individuals against themselves (see section 7.5.2.4, for more details see [59, Section 6.2.4]). Participants were provided with documentation for MAPO, consisting of approximately 40 pages of functional specifications and design documentation, including the design artefacts used as inputs to the debugging tool. These design artefacts included a number of Agent UML (AUML) interaction protocols, which were converted to Petri nets (using the translation rules of [59, Chapter 4]) and added to the debugging tool for use in the experiments. Each participant was also provided with instructions that included a set of steps to be followed. Each set of steps comprised the minimum test data that would ensure the system would encounter the planted bug. We chose to direct the testing activities of the participants rather than leave them to define their own test cases as there was a concern that if we did not direct the test input the participants may be unlikely to encounter the bugs in the limited time available. However, this approach inevitably results in the participants quickly identifying the bugs. Consequently we were unable to fully evaluate our first hypothesis, that the debugging tool would help to identify bugs more easily. This is a limitation of the evaluation procedure but seemed necessary. A maximum of 1 hour per bug was permitted to limit the experiment to approximately half a day per participant. This seemed to be the maximum length of time that many of the participants would be willing to spend on such an experiment.
7 Debugging and Testing of Multi-Agent Systems using Design Artefacts
249
For each bug we collected information on what the participants thought the bug was (i.e. identification), what they saw as the cause of the bug (i.e. location), and how they fixed the bug (i.e. fixing). For each participant and each bug we assessed whether they had successfully identified, located and fixed the bug. That is, a participant’s description of the bug’s existence, cause and its fix, was assessed as being either correct or incorrect12 . To limit the possibility of bias, grading was carried out without knowledge of which participant used the debugging tool for which debugging task. Only after the forms had been graded were the results added to the appropriate group. The bug data collection form also included a field for recording the time when each of the three debugging sub tasks was completed. Given that we asked participants to record the actual time we end up with a cumulative time for each of the debugging phases. This means that the time to fix a bug includes the time taken to locate the cause of the bug and to identify that the bug exists in the first place. Statistical analysis of how many participants were able to identify/locate/fix a given bug used a chi-square test, whereas statistical analysis of the time taken used a Wilcoxon rank sum test (see [59, Section 6.1.7] for a discussion of these tests and the rationale for their selection).
7.5.2 Results In this section we present the results of the debugging experiments We compare the results over each of the sub problems that occur during debugging: identify, locate and fix. For each of these problems we consider if the participant was successful as well as the time taken to resolve the bug (bug resolution speed). We analyse the difference between the two groups with respect to our hypothesis to identify the effect that our debugging tool has on debugging the test application.
7.5.2.1 Identifying the Bug Since participants were provided with instructions that guided them to identify the bug, we did not find significant differences in identifying bugs between debugging with and without the tool. Bug 1 was identified by all participants, and bugs 2-4 were identified by all ten participants with the debugger, and by 9 of the participants who did not use the debugger for that bug (this difference is not significant, p=0.3049). Similarly, there is little difference between the time taken for the two groups (p=0.4638 for bug 1, 0.898 for bug 2, 0.79 for bug 3). Bug 4 is interesting in that the median time for participants who used the debugger was higher (14 minutes, compared with 9), but this difference was was not quite significant (p=0.06317). 12
In fact, we originally used a three point scale.
Poutakidis et al.
250 10
Number of correct responses
9
9 8
8
8
7 6
6
Debugger No Debugger
4
2 1 0
0 Bug 1
Bug 2
Bug 3
Bug 4
Number of participants that located the cause of the bug when using the debugger compared to the number that located the cause of the bug without the debugger.
Fig. 7.9 Number of participants able to locate bug
7.5.2.2 Locating the Cause of the Bug Figure 7.9 shows the number of participants that successfully located the cause of the bug for each of the bug revisions. There is a very clear and significant difference between the proportions for both bug 1 (p=0.0062) and bug 4 (p=0.0003). For instance, for bug 4, only participants who used the debugger were able to locate the cause of the bug within an hour. The proportion data for bug 2 and bug 3 also show differences, but these do not appear to be significant (p=0.5312 for bug 2, p=0.1213 for bug 3). Figure 7.10 shows the box plots for each of the 4 bug revisions concerning the time spent trying to locate the cause of the bug. As previously mentioned, it should be noted that the time recorded here is cumulative from the time the experiment was started for the bug revision, i.e. it includes the time taken to identify the presence of the bug. Furthermore, since there was a one hour time limit imposed on the bug version the y-axis is marked from 0 to 61 minutes. We extend the axis by 1 minute to differentiate between participants that finished in exactly 1 hour and those that did not finish. The latter case is presented as taking 61 minutes to complete the task. Using the debugging tool clearly shows an improvement in performance for bugs 1 and 4. This difference is significant (p=0.0027 for bug 1, and p=0.0003 for bug 4). From these results we can conclude that the difference between the median time to locate bug 1 was at least 22 minutes (38 minutes vs. 60(+1) minutes). For bug 4 it was at least 19 minutes. This is quite a substantial amount and we can speculate that if the one hour time limit was not imposed the real difference could be greater. The results for bug 2 reveal less of a difference between the two groups. The group that used the debugging tool had a median time of 23 minutes compared with 37.5 minutes for the group that did not use the tool. However, this difference is not quite significant (p=0.0683). For bug 3 there was a greater
251
30 10
20
Time (minutes)
40
50
60
7 Debugging and Testing of Multi-Agent Systems using Design Artefacts
0
Debugger No Debugger
Bug 1
Bug 2
Bug 3
Bug 4
Bug Version Number
Fig. 7.10 Time taken to locate bug 10
Number of correct responses
9 8
8
8
7 6
6
Debugger No Debugger
4 3
2 0
0
0 Bug 1
Bug 2
Bug 3
Bug 4
Number of participants that fixed the bug when using the debugger compared to number that fixed the bug without the debugger.
Fig. 7.11 Number of participants able to fix bug
(and significant, p=0.0059) difference: more than a 20 minute increase in time for the group that did not use the debugging tool.
7.5.2.3 Fixing the Bug Figure 7.11 shows the proportion of participants that were able to successfully fix the bug within what time was left of the 1 hour time limit. There is a clear
Poutakidis et al.
30 10
20
Time (minutes)
40
50
60
252
0
Debugger No Debugger
Bug 1
Bug 2
Bug 3
Bug 4
Bug Version Number
Fig. 7.12 Time taken to fix bug
difference between the two groups for bug 1 (p=0.001), bug 3 (p=0.0246) and bug 4 (p=0.0034). However, the results for bug 2 do not show a significant difference between the two groups (p=0.5312). Figure 7.12 shows the box plots for each of the 4 bug revisions concerning the time spent trying to fix the bug. As in the previous phase there is strong evidence that the debugging tool was a significant advantage for bug 1 and bug 4. No participant was able to fix the bug for either of these two bug versions if they were in the group that did not have the tool. The median time for completing the task is therefore artificially set at 61 minutes, while the median time taken for the group that used the tool was 45.5 minutes for bug 1 and 47.5 minutes for bug 4. These differences are statistically significant with both recording a p-value of 0.0015. For bug 2 there is a large difference between the median times to provide the fix (24 minutes for one group versus 45 for the other), but there is also a large variation in the recorded times, and the difference between the groups is not significant (p=0.1192). Bug 3 shows a similar trend. The difference between the median time to provide a fix for the bug is the same as for bug 2, 21 minutes. There are, however, slight differences in the distribution of times that make this bug version more statistically significant than the previous one (p=0.0497).
7.5.2.4 Within Subject Analysis It is likely that a certain amount of variability exists because of the varying abilities of each of the participants. A within subject analysis is an effective method
253
2 3 4 5
6 7
8 9 10 11 12 13 14 15 16 17 18 19 20
Participant
0 −20
Time in minutes 1
−40
0 −20 −40
Time in minutes
20
20
40
40
7 Debugging and Testing of Multi-Agent Systems using Design Artefacts
1
2 3
4 5
6 7 8 9 10 11 12 13 14 15 16 17 18 19 20
Participant
Fig. 7.13 Difference in time to locate the bugs (left) and fix the bugs (right)
for handling the variability between subjects and can shed some further light on the effect of the debugging tool on an individual’s performance. The general process of evaluation is to have each participant complete a task under two different circumstances (typically described as a control task and a treatment task). Scores are recorded for each task and the difference between the scores for the two tasks is obtained. If the difference is close to zero then we can conclude that the treatment variable (the debugging tool) had no effect on the outcome. However, if a large difference is measured then there is evidence that the treatment condition did effect the outcome. For this analysis we will concentrate on bug 2 and bug 3, and on the second two phases (locating and fixing the bug). We do this because we have already noted a statistically significant advantage for using the debugging tool for bugs 1 and 4, and we see no advantage to using the debugging tool for the first phase. Group A comprises participants 1 though 10, who used the debugging tool for bug 2 but not for bug 3. Group B comprises participants 11 through 20 who used the tool for bug 3 but not for bug 2. Figure 7.13 (left) is a graphical representation of the differences in the time taken for each participant to locate the cause of bugs 2 and 3. Group A is represented by the light shading of grey and group B by the dark shading of grey. This graph shows how much quicker each participant was able to locate each of the bugs. For example, participant 1 was observed to have a 30 minute speed increase in locating bug 2 (using the tool) over Bug 3 (not using the tool). The graph shows an increase in performance for most subjects when the debugging tool was used to locate the bug. However, there are three exceptions. Participant 6, 10 and 13 had a performance decrease of approximately 7, 16 and 1 minutes respectively. However, overall the debugging tool results in bugs being located more quickly (p=0.00987). Figure 7.13 (right) shows the difference that the debugging tool had for each participant in fixing the bugs. Again this graph clearly shows that the majority of the participants were able to fix the bug more quickly when using the tool than without (p=0.00987).
254
Poutakidis et al.
7.6 Conclusion In this chapter we explored the problems associated with testing and debugging multi-agent systems and have provided a framework for testing and debugging based on using design documents to automatically identify errors in developed systems. We have demonstrated two proof of concept tools: one that uses design documents to generate extensive test cases for unit testing, and another that uses design documents (specifically protocol specifications and parts of event descriptors) to help in debugging. The debugging tool was used to assess the effectiveness of our debugging technique via an empirical evaluation. The results that we obtained clearly demonstrate that using the debugging tool translates to an improvement in debugging performance. We gathered data from twenty participants over four debugging tasks. Each debugging task was measured over the three aspects of debugging; identifying, locating and fixing a bug. In terms of overall successes in locating the cause and fixing the bugs we identified that using the debugging tool afforded the participant a considerable advantage. One advantage of using design artefacts in testing and debugging is that it provides continued checking that the design and code are consistent, thus helping to avoid the typical accumulation of differences, leading to out-of-date design documents. There are a number of areas for future work including: • Improving the user interface of the debugging tool, and looking at possibly integrating it into an agent-based design tool, such as the Prometheus Design Tool (PDT). • Developing a distributed debugging environment, with multiple debugging agents. This would be needed to debug large agent systems that comprise hundreds or even thousands of agents. A key challenge is managing the interactions between debugging agents and determining how to group agents. • Extending testing to focus on higher level aspects such as scenarios and goals. • Thorough evaluation of the testing approach including common types of errors not able to be identified. Although much interesting work remains to be done, this chapter has established the viability and effectiveness of the approach to using design artefacts in the testing and debugging of multi-agent systems. Acknowledgements We would like to thank John Thangarajah for discussions relating to the testing tool, and co-supervision of the PhD work on this topic. We would like to acknowledge the support of of Agent Oriented Software Pty. Ltd. and of the Australian Research Council (ARC) under grant LP0453486.
7 Debugging and Testing of Multi-Agent Systems using Design Artefacts
255
References 1. Apfelbaum, L., Doyle, J.: Model Based Testing. In: the 10th International Software Quality Week Conference. CA, USA (1997) 2. Bates, P.: EBBA Modelling Tool a.k.a Event Definition Language. Tech. rep., Department of Computer Science University of Massachusetts, Amherst, MA, USA (1987) 3. Bauer, B., Müller, J.P., Odell, J.: Agent UML: A Formalism for Specifying Multiagent Interaction. In: P. Ciancarini, M. Wooldridge (eds.) Agent-Oriented Software Engineering, pp. 91–103. Springer-Verlag, Berlin (2001) 4. Benfield, S.S., Hendrickson, J., Galanti, D.: Making a strong business case for multiagent technology. In: P. Stone, G. Weiss (eds.) Autonomous Agents and Multi-Agent Systems (AAMAS), pp. 10–15. ACM Press (2006) 5. Binder, R.V.: Testing Object-Oriented Systems: Models, Patterns, and Tools. AddisonWesley Longman Publishing Co., Inc., Boston, MA, USA (1999) 6. Binkley, D., Gold, N., Harman, M.: An empirical study of static program slice size. ACM Transactions on Software Engineering and Methodology 16(2), 8 (2007). DOI http://doi.acm.org/10.1145/1217295.1217297 7. Bresciani, P., Giorgini, P., Giunchiglia, F., Mylopoulos, J., Perini, A.: Tropos: An agentoriented software development methodology. Journal of Autonomous Agents and MultiAgent Systems 8, 203–236 (2004) 8. Bruegge, B., Gottschalk, T., Luo, B.: A framework for dynamic program analyzers. In: Object-Oriented Programming Systems, Languages, and Applications. OOPSLA, pp. 65– 82. ACM Press, Washington (1993) 9. Busetta, P., Howden, N., Rönnquist, R., Hodgson, A.: Structuring BDI agents in functional clusters. In: Agent Theories, Architectures, and Languages (ATAL-99), pp. 277–289. Springer-Verlag (2000). LNCS 1757 10. Busetta, P., Rönnquist, R., Hodgson, A., Lucas, A.: JACK Intelligent Agents - Components for Intelligent Agents in Java. Tech. rep., Agent Oriented Software Pty. Ltd, Melbourne, Australia (1998) 11. Caire, G., Cossentino, M., Negri, A., Poggi, A., Turci, P.: Multi-Agent Systems Implementation and Testing. In: the Fourth International Symposium: From Agent Theory to Agent Implementation. Vienna, Austria (EU) (2004) 12. Clarke, E.M., Grumberg, O., Long, D.E.: Model checking and abstraction. ACM Transactions on Programming Languages and Systems 16(5), 1512–1542 (1994). URL citeseer.ist.psu.edu/clarke92model.html 13. Coelho, R., Kulesza, U., von Staa, A., Lucena, C.: Unit Testing in Multi-Agent Systems using Mock Agents and Aspects. In: Proceedings of the 2006 International Workshop on Software Engineering for Large-Scale Multi-Agent Systems, pp. 83–90 (2006) 14. Cohen, B.: The use of bug in computing. IEEE Annals of the History of Computing 16, No 2 (1994) 15. Cohen, D.M., Dalal, S.R., Fredman, M.L., Patton, G.C.: The AETG system: An Approach to Testing Based on Combinatorial Design. Software Engineering 23(7), 437–444 (1997). URL citeseer.ist.psu.edu/cohen97aetg.html 16. Cost, R.S., Chen, Y., Finin, T., Labrou, Y., Peng, Y.: Using colored petri nets for conversation modeling. In: F. Dignum, M. Greaves (eds.) Issues in Agent Communication, pp. 178–192. Springer-Verlag: Heidelberg, Germany (2000). URL citeseer.ist.psu.edu/article/cost99using.html 17. Dalal, S.R., Jain, A., Karunanithi, N., Leaton, J.M., Lott, C.M., Patton, G.C., Horowitz, B.M.: Model-based testing in practice. In: International Conference on Software Engineering (1999) 18. DeLoach, S.A.: Analysis and design using MaSE and agentTool. In: Proceedings of the 12th Midwest Artificial Intelligence and Cognitive Science Conference (MAICS 2001) (2001) 19. DeLoach, S.A.: Developing a multiagent conference management system using the O-MaSE process framework. In: Luck and Padgham [39], pp. 168–181
256
Poutakidis et al.
20. DeLoach, S.A., Wood, M.F., Sparkman, C.H.: Multiagent systems engineering. International Journal of Software Engineering and Knowledge Engineering 11(3), 231–258 (2001) 21. Dignum, F., Sierra, C. (eds.): Agent Mediated Electronic Commerce: The European Agentlink Perspective. Lecture Notes in Artificial Intelligence. Springer-Verlag, London, UK (1991) 22. Doolan, E.P.: Experience with Fagan’s inspection method. Software Practice and Experience 22(2), 173–182 (1992) 23. Ducassé, M.: A pragmatic survey of automated debugging. In: Automated and Algorithmic Debugging, LNCS, vol. 749, pp. 1–15. Springer Berlin / Heidelberg (1993). URL citeseer.ist.psu.edu/367030.html 24. Ekinci, E.E., Tiryaki, A.M., Çetin, Ö.: Goal-oriented agent testing revisited. In: J.J. GomezSanz, M. Luck (eds.) Ninth International Workshop on Agent-Oriented Software Engineering, pp. 85–96 (2008) 25. El-Far, I.K., Whittaker, J.A.: Model-Based Software Testing, pp. 825–837. Wiley (2001) 26. Fagan, M.E.: Advances in software inspections. IEEE Transactions on Software Engineering SE-12(7), 744–751 (1986) 27. Flater, D.: Debugging agent interactions: a case study. In: Proceedings of the 16th ACM Symposium on Applied Computing (SAC2001), pp. 107–114. ACM Press (2001) 28. Gomez-Sanz, J.J., Botía, J., Serrano, E., Pavón, J.: Testing and debugging of MAS interactions with INGENIAS. In: J.J. Gomez-Sanz, M. Luck (eds.) Ninth International Workshop on Agent-Oriented Software Engineering, pp. 133–144 (2008) 29. Hailpern, B., Santhanam, P.: Software debugging, testing, and verification. IBM Systems Journal 41(1), 1–12 (2002) 30. Hall, C., Hammond, K., O’Donnell, J.: An algorithmic and semantic approach to debugging. In: Proceedings of the 1990 Glasgow Workshop on Functional Programming, pp. 44–53 (1990) 31. Huber, M.J.: JAM: A BDI-theoretic mobile agent architecture. In: Proceedings of the Third International Conference on Autonomous Agents (Agents’99), pp. 236–243 (1999) 32. Huget, M.P., Odell, J., Haugen, Ø., Nodine, M.M., Cranefield, S., Levy, R., Padgham., L.: Fipa modeling: Interaction diagrams. On www.auml.org under “Working Documents” (2003). FIPA Working Draft (version 2003-07-02) 33. Johnson, M.S.: A software debugging glossary. ACM SIGPLAN Notices 17(2), 53–70 (1982) 34. Jones, J.A.: Fault localization using visualization of test information. In: Proceedings of the 26th International Conference on Software Engineering, pp. 54–56. IEEE Computer Society, Washington, DC, USA (2004) 35. Knublauch, H.: Extreme programming of multi-agent systems. In: Proceedings of the First International Joint Conference on Autonomous Agents and Multi-Agent Systems (AAMAS) (2002). URL citeseer.ist.psu.edu/knublauch02extreme.html 36. LeBlanc, T., Mellor-Crummey, J., Fowler, R.: Analyzing parallel program executions using multiple views. Parallel and Distributed Computing 9(2), 203–217 (1990) 37. Lind, J.: Specifying agent interaction protocols with standard UML. In: Agent-Oriented Software Engineering II: Second International Workshop, Montreal Canada, LNCS, vol. 2222, pp. 136–147 (2001). URL citeseer.ist.psu.edu/lind01specifying.html 38. Low, C.K., Chen, T.Y., Rönnquist, R.: Automated Test Case Generation for BDI agents. Autonomous Agents and Multi-Agent Systems 2(4), 311–332 (1999) 39. Luck, M., Padgham, L. (eds.): Agent-Oriented Software Engineering VIII, 8th International Workshop, AOSE 2007, Honolulu, HI, USA, May 14, 2007, Revised Selected Papers, Lecture Notes in Computer Science, vol. 4951. Springer (2008) 40. Madachy, R.: Process improvement analysis of a corporate inspection program. In: Seventh Software Engineering Process Group Conference, Boston, MA (1995) 41. Mayer, W., Stumptner, M.: Model-based debugging - state of the art and future challenges. Electronic Notes in Theoretical Computer Science 174(4), 61–82 (2007). DOI http://dx.doi.org/10.1016/j.entcs.2006.12.030 42. McDowell, C., Helmbold, D.: Debugging concurrent programs. ACM Computing Surveys 21(4), 593–622 (1989)
7 Debugging and Testing of Multi-Agent Systems using Design Artefacts
257
43. Morandini, M., Nguyen, D.C., Perini, A., Siena, A., Susi, A.: Tool-supported development with Tropos: The conference management system case study. In: Luck and Padgham [39], pp. 182–196 44. Munroe, S., Miller, T., Belecheanu, R., Pechoucek, M., McBurney, P., Luck, M.: Crossing the agent technology chasm: Experiences and challenges in commercial applications of agents. Knowledge Engineering Review 21(4), 345–392 (2006) 45. Myers, B.A., Weitzman, D.A., Ko, A.J., Chau, D.H.: Answering why and why not questions in user interfaces. In: Proceedings of the SIGCHI conference on Human Factors in computing systems, pp. 397–406. ACM, New York, NY, USA (2006) 46. Mylopoulos, J., Castro, J., Kolp, M.: Tropos: Toward agent-oriented information systems engineering. In: Second International Bi-Conference Workshop on Agent-Oriented Information Systems (AOIS2000) (2000) 47. Naish, L.: A declarative debugging scheme. Journal of Functional and Logic Programming 1997(3), 1–27 (1997) 48. Ndumu, D.T., Nwana, H.S., Lee, L.C., Collis, J.C.: Visualising and debugging distributed multi-agent systems. In: Proceedings of the third annual conference on Autonomous Agents, pp. 326–333. ACM Press (1999). DOI http://doi.acm.org/10.1145/301136.301220 49. Nguyen, C.D., Perini, A., Tonella, P.: eCAT: A tool for automating test cases generation and execution in testing multi-agent systems (demo paper). In: 7th International Conference on Autonomous Agents and Multiagent Systems (AAMAS 2008). Estoril, Portugal (2008) 50. Nguyen, C.D., Perini, A., Tonella, P.: Ontology-based test generation for multi agent systems (short paper). In: 7th International Conference on Autonomous Agents and Multiagent Systems (AAMAS 2008). Estoril, Portugal (2008) 51. O’Hare, G.M.P., Wooldridge, M.J.: A software engineering perspective on multi-agent system design: experience in the development of MADE. In: Distributed artificial intelligence: theory and praxis, pp. 109–127. Kluwer Academic Publishers (1992) 52. Padgham, L., Thangarajah, J., Winikoff, M.: The prometheus design tool - a conference management system case study. In: Luck and Padgham [39], pp. 197–211 53. Padgham, L., Winikoff, M.: Developing Intelligent Agent Systems: A Practical Guide. John Wiley and Sons (2004). ISBN 0-470-86120-7 54. Padgham, L., Winikoff, M., DeLoach, S., Cossentino, M.: A unified graphical notation for AOSE. In: Ninth International Workshop on Agent Oriented Software Engineering (AOSE) (2008) 55. Padgham, L., Winikoff, M., Poutakidis, D.: Adding debugging support to the prometheus methodology. Engineering Applications of Artificial Intelligence, special issue on Agentoriented Software Development 18(2), 173–190 (2005) 56. Patton, R.: Software Testing (Second Edition). Sams, Indianapolis, IN, USA (2005) 57. Paurobally, S., Cunningham, J., Jennings, N.R.: Developing agent interaction protocols graphically and logically. In: Programming Multi-Agent Systems, Lecture Notes in Artificial Intelligence, vol. 3067, pp. 149–168 (2004) 58. Pokahr, A., Braubach, L., Lamersdorf, W.: Jadex: Implementing a BDI-Infrastructure for JADE Agents. EXP - In Search of Innovation (Special Issue on JADE) 3(3), 76–85 (2003) 59. Poutakidis, D.: Debugging multi-agent systems with design documents. Ph.D. thesis, RMIT University, School of Computer Science and IT (2008) 60. Poutakidis, D., Padgham, L., Winikoff, M.: Debugging multi-agent systems using design artifacts: The case of interaction protocols. In: Proceedings of the First International Joint Conference on Autonomous Agents and Multi Agent Systems (AAMAS’02) (2002) 61. Poutakidis, D., Padgham, L., Winikoff, M.: An exploration of bugs and debugging in multiagent systems. In: Proceedings of the 14th International Symposium on Methodologies for Intelligent Systems (ISMIS), pp. 628–632. Maebashi City, Japan (2003) 62. Purvis, M., Cranefield, S., Nowostawski, M., Purvis, M.: Multi-agent system interaction protocols in a dynamically changing environment. In: T. Wagner (ed.) An Application Science for Multi-Agent Systems, pp. 95–112. Kluwer Academic (2004) 63. Reisig, W.: Petri Nets: An Introduction. EATCS Monographs on Theoretical Computer Science. Springer-Verlag (1985). ISBN 0-387-13723-8
258
Poutakidis et al.
64. Rouff, C.: A Test Agent for Testing Agents and their Communities. Aerospace Conference Proceedings, 2002. IEEE 5, 2638 (2002) 65. Schwarz, R., Mattern, F.: Detecting causal relationships in distributed computations: In search of the holy grail. Distributed Computing 7(3), 149–174 (1994). URL citeseer.nj.nec.com/schwarz94detecting.html 66. Shapiro, E.Y.: Algorithmic Program Debugging. MIT Press, Cambridge, MA, USA (1983) 67. Sprinkle, J., van Buskirk, C.P., Karsai, G.: Modeling agent negotiation. In: Proceedings of the 2000 IEEE International Conference on Systems, Man, and Cybernetics, Nashville, TN, vol. 1, pp. 454–459 (2000) 68. Vessey, I.: Expertise in debugging computer programs: A process analysis. International Journal of Man-Machine Studies 23(5), 459–494 (1985) 69. Weiser, M.: Programmers use slices when debugging. Communications of the ACM 25(7), 446–452 (1982). DOI http://doi.acm.org/10.1145/358557.358577 70. Yilmaz, C., Williams, C.: An automated model-based debugging approach. In: Proceedings of the twenty-second IEEE/ACM international conference on Automated software engineering, pp. 174–183. ACM, New York, NY, USA (2007). DOI http://doi.acm.org/10.1145/1321631.1321659 71. Zhang, Z., Thangarajah, J., Padgham, L.: Automated unit testing for agent systems. In: Second International Working Conference on Evaluation of Novel Approaches to Software Engineering (ENASE), pp. 10–18 (2007)