15th North American Caribou Workshop Whitehorse, Canada 12-16 May, 2014
Decision-support model to explore the feasibility of using translocation to restore a woodland caribou population in Pukaskwa National Park, Canada Emily K. Gonzales1, Patrick Nantel2, Arthur R. Rodgers3, Martha L. Allen4 & Christine C. Drake5
Ecological Restoration Division, Parks Canada, 300-300 West Georgia Street, Vancouver, BC, V6B 6B4, Canada (Corresponding author:
[email protected]). 2 Office of the Chief Ecosystem Scientist, Parks Canada, 25 Eddy, 4th Floor 25-4-S, Gatineau, QC, K1A 0M5, 2 Canada. 3 Centre for Northern Forest Ecosystem Research, Ontario Ministry of Natural Resources and Forestry, 955 Oliver 3 Road, Thunder Bay, ON, P7B 5E1, Canada. 4 Bruce Peninsula National Park, Parks Canada, P.O. Box 189, 120 Chi sin tib dek Road, Tobermory, ON, N0H 2R0, 4 Canada. 5 Pukaskwa National Park, Parks Canada, P.O. Box 212, Heron Bay, ON, P0T 1R0, Canada. 1 1
Abstract: The distribution and abundance of woodland caribou (Rangifer tarandus caribou) have declined dramatically in the past century. Without intervention the most southern population of caribou in eastern North America is expected to disappear within 20 years. Although translocations have reintroduced and reinforced some populations, approximately half of caribou translocation efforts fail. Translocations are resource intensive and risky, and multiple interrelated factors must be considered to assess their potential for success. Structured decision-making tools, such as Bayesian belief networks, provide objective methods to assess different wildlife management scenarios by identifying the key components and relationships in an ecosystem. They can also catalyze dialogue with stakeholders and provide a record of the complex thought processes used in reaching a decision. We developed a Bayesian belief network for a proposed translocation of woodland caribou into a national park on the northeastern coast of Lake Superior, Ontario, Canada. We tested scenarios with favourable (e.g., good physical condition of adult caribou) and unfavourable (e.g., high predator densities) conditions with low, medium, and high numbers of translocated caribou. Under the current conditions at Pukaskwa National Park, augmenting the caribou population is unlikely to recover the species unless wolf densities remain low (200 individuals that fluctuate with the availability of vegetation (Environment Canada, 2012). The natural population on the mainland is now restricted to a narrow band along Lake Superior coast that includes Pukaskwa National Park (48°N, 85°W). Biennial surveys in the Park since the late 1970s have revealed a steady decline from 30 individuals to only 4 in 2009 (Bergerud et al., 2007; Patterson et al., 2014). With little to no recruitment for over a decade, Bergerud et al. (2007) suggested that extirpation is the likely outcome for this population by 2018. Parks Canada must decide between a costly intervention or risk extirpation of a species from a national park. Translocation has been proposed to augment 28
the population; however, translocations have mixed success as a management tool to recover caribou. Wildlife translocation is one of the more complex management actions used to restore or reinforce populations of species at risk (Decesare et al., 2011). The long-term success of translocations requires managing the behaviour, habitat, metapopulation, and ecosystem level issues that initially led to the decline of the population (Armstrong & Seddon, 2008). Since 1982, the Ontario Ministry of Natural Resources and Forestry has restored or introduced woodland caribou from the Slate Islands to a number of islands and the shoreline of eastern Lake Superior with little success (G. Eason, personal communication; Gogan & Cochrane, 1994). Failures of caribou translocation projects have been attributed to disease, predation, anthropogenic disturbance and/or insufficient and fragmented habitats (Bergerud & Mercer, 1989; Gogan & Cochrane, 1994; Compton et al., 1995). In a review of 33 caribou introductions in eastern North America from 1924 to 1985, introductions inevitably failed when animals, released in proximity to white-tailed deer (Odocoileus virginianus), contracted meningeal brain worm (Parelaphostrongylus tenuis) and died (Bergerud & Mercer, 1989). For example, a herd of 51 caribou, released in Cape Breton Highlands National Park, Nova Scotia in 1968 and 1969, was extinct by 1973 due to meningeal brain worm (Dauphiné, 1975). Similar results occurred on Anticosti Island, Quebec (145 reindeer introduced in 1924), Great Cloche Island, Ontario (12 caribou released in 1970), and southern Wisconsin (14 caribou in an enclosure with white-tailed deer) (Bergerud & Mercer, 1989). Predation was also a key factor in failed translocations. Wolf (Canis lupus), cougar (Felis concolor), and occasionally bear (Ursus americanus) predation were credited with the loss of translocated caribou in Ontario, Quebec,
This journal is published under the terms of the Creative Commons Attribution 3.0 Unported License Editor in Chief: Birgitta Åhman, Technical Editor Eva Wiklund and Graphic Design: H-G Olofsson, www.rangiferjournal.com
Rangifer, 35, Spec. Iss. No. 23, 2015
and British Columbia in Canada and Maine in the United States (Bergerud & Mercer, 1989; Gogan & Cochrane, 1994; Compton et al., 1995). Cougar predation was the primary cause of death for 60 woodland caribou translocated from British Columbia to northern Idaho between 1987 and 1992 (Compton et al., 1995). Wolf predation caused the failure of translocations in the Lake Superior region, Ontario, including the Gargantua Peninsula (39 caribou released in 1989) (Gogan & Cochrane, 1994) and Bowman Island (6 caribou released in 1985) (Bergerud & Mercer, 1989). Predation is also the primary limiting factor for almost all natural woodland caribou populations (McLoughlin et al., 2003; Wittmer et al., 2005; Festa-Bianchet et al., 2011). Wolves and whitetailed deer are absent from Newfoundland, which has the highest rate of successful translocations (Bergerud & Mercer, 1989). From 1961 to 1982, 384 caribou were released at 22 sites and 17 of these releases were successful. The failures in Newfoundland were attributed to illegal hunting and anthropogenic disturbance (Bergerud & Mercer, 1989). The failure of caribou translocations is consistent with reintroductions in general. An early review of reintroduction projects suggested that the majority failed to establish viable populations due to poor planning and insufficient consideration of the biological and ecological factors needed for success (Griffith et al., 1989; Wolf et al., 1998). A more recent review (1990-2005) of 454 projects found most reintroduction programs to be ad hoc rather than an organized attempt to assess risk, advance understanding in the field of reintroduction biology, or to improve reintroduction success (Seddon et al., 2007). The authors described most research in the field of reintroduction biology to be retrospective, that is, opportunistic project evaluations and post hoc interpretation of monitoring (Seddon et al., 2007). They recommended an increased role for formally planned Rangifer, 35, Spec. Iss. No. 23, 2015
projects that identify knowledge gaps and address uncertainty coupled with multidisciplinary teams of resource managers and scientists (Seddon et al., 2007). The planning, documenting, and decisionsupport for translocation is well served by structured decision analysis (Pérez et al., 2012; Converse et al., 2013). With such a tool, planners and advisors can explore the factors expected to influence the success of a caribou translocation and examine various combinations of environmental settings and introduction scenarios. Federal programs to recover species at risk also benefit from clear communication with stakeholders and the public. The framing of protection and recovery of species at risk is critical because it alters the way we think, talk, and approach the issue (Nie, 2001). Decision support tools are transparent, repeatable, and help conceptualize the key factors and their relationships – all of which facilitates framing and understanding the issue. It was under this premise that we developed a Bayesian belief network to explore the feasibility of a successful translocation of woodland caribou into Pukaskwa National Park. Bayesian belief networks (BBNs) are graphical models that represent a set of variables linked by conditional probability relationships (McCann et al., 2006; McNay et al., 2006; Rumpff et al., 2011; Conroy & Peterson, 2012). They facilitate communication at the interface of science, politics and community to enhance the decision making process (Reckhow, 1999). A BBN starts with an influence diagram, which is an intuitive graphical representation of the probabilistic dependence among variables (or nodes). In a BBN, a node leading to another one is a parent node, and the dependent node is a child node; the most external nodes (with no parent nodes) are used as the input to the model. Those diagrams are an effective method of modeling potential causal relationships/ conditional dependencies (Reckhow, 1999).
This journal is published under the terms of the Creative Commons Attribution 3.0 Unported License Editor in Chief: Birgitta Åhman, Technical Editor Eva Wiklund and Graphic Design: H-G Olofsson, www.rangiferjournal.com
29
Bayesian belief networks can also incorporate the uncertainty inherent in ecology. For example, experts may be uncertain about their own knowledge, there may be uncertainty inherent in the relationships being modeled (functional uncertainty), or uncertainty about the accuracy and or availability of information (epistemic uncertainty) (Kujala et al., 2013). They are particularly useful for articulating the uncertainty that propagates between management actions (such as translocation) and eventual outcomes (such as species persistence). Methods Model development We developed and quantified a BBN iteratively, with expert contribution and review at each stage, and used the freely downloaded software GeNie 2.0 (http://genie.sis.pitt.edu/). The initial graphical model was based on key variables and processes identified at a workshop with ten experts in caribou management, wolves and ge-
netics, as well as regional biologists, local First Nations and park staff (Parks Canada, 2010). Next, experts crafted the “influence diagram”, using as nodes the variables and processes identified at the workshop, and setting as input the parent nodes that describe the local environment as well as the variables that can be manipulated. That provided an intuitive presentation of the ecological relationships and a rapid scoping of the management issue (McCann et al., 2006). The influence diagram contributions were largely supported by scientific literature. Thresholds for each of the nodes are given in Appendix and include a citation when based on scientific literature. Where knowledge gaps existed, particularly with running scenarios specific to Pukaskwa National Park, we relied on expert opinion and identified predictions that could be tested in the event of a translocation. The influence diagram went through six major and several minor iterations before the team
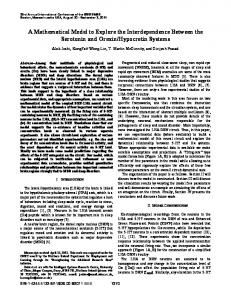
Figure 1. Influence diagram underlying a Bayesian Belief Network for a proposed woodland caribou translocation into Pukaskwa National Park. Grey shaded nodes are those presented in Table 1; the resultant (outcome) node has a thicker border.
30
This journal is published under the terms of the Creative Commons Attribution 3.0 Unported License Editor in Chief: Birgitta Åhman, Technical Editor Eva Wiklund and Graphic Design: H-G Olofsson, www.rangiferjournal.com
Rangifer, 35, Spec. Iss. No. 23, 2015
reached a consensus (Fig. 1). Whenever possible we were parsimonious with the model because the conditional probability table (CPT) of a child node becomes difficult to parameterize with increasing numbers of parent nodes. Also, the more links there are among nodes, the less tractable the model becomes (Marcot et al., 2006). Parsimony was also appropriate given the degree of precision available for each node. Developing the influence diagram (Fig. 1) The general structure of the BBN is consistent with other efforts to identify key variables for caribou in Ontario (Rodgers et al., 2008). Caribou declines are ultimately caused by habitat alterations and proximately caused by predation. More specific divisions can be traced back to these two broad effects (Festa-Bianchet et al., 2011). The most external parent nodes of the BBN, also called “input nodes” herein, are the key ecosystem variables and processes that affect caribou persistence and that either are determined by the local conditions or can be modified through management. These include descriptors of the caribou’s environment, such as amount of escape habitat, the extent of linear features, and landfast ice, which all influence the access of wolves to caribou (Bergerud et al., 2007). Other parent nodes include “logging and prescribed fire”, “wildfire” and “quality of non-winter forage”, which all influence moose and bear density and the amount and quality of habitat for caribou (Rodgers et al., 2008; Environment Canada, 2012; Pinard et al., 2012) (Fig. 1). For details on each node’s states, thresholds used to separate states, and conditional probability values, see tables in the Appendix. The child nodes are key variables and processes that influence population dynamics more or less directly, such as rate of predation and adult survival, which in turn are a main deRangifer, 35, Spec. Iss. No. 23, 2015
terminant of the population recovery potential. The rate of predation was primarily determined by the densities of wolves and bears (Ballard, 1994), and the accessibility of caribou to wolves, which are considered their most significant predator (Bergerud et al., 2007). Predation rate is also likely to be affected by the experience the introduced animals have with predators (Frair et al., 2007). If caribou translocated into Pukaskwa National Park were sourced from nearby predator-free islands, these individuals would be naïve and more susceptible to predators. Given that the experience of translocated animals with predators could affect their persistence, predator-experienced vs. predatornaive caribou was a factor included as a parent (input) node in this model. Wolf density is in turn affected by the density of their main prey species, which could be moose or caribou depending on their relative availability (Bergerud & Elliott, 1986). For the period 1974–1988, the dynamics at Pukaskwa National Park suggested that wolf predation depended on caribou density (Bergerud, 1996). Caribou recruitment declined and adult mortality increased when wolf numbers increased beyond 20 individuals (Bergerud, 1996). Predation dynamics can partly offset the effect that a larger initial population of caribou would have on recovery potential. This is why the model includes the intermediate child node “number of translocated caribou surviving” between the nodes “number of caribou introduced” and “recovery potential” (Fig. 1). The number of surviving animals (over ~ 5 yrs) is modulated by the survival rate of adults, and therefore links the short-term dynamics to the longer-term projection. Vors and Boyce (2009) reviewed a variety of potential responses by caribou to climate change, such as indirect, density-independent effects of extreme weather events that cause unpredictable access to forage, or freezing rain events that eliminate access to grazing due to
This journal is published under the terms of the Creative Commons Attribution 3.0 Unported License Editor in Chief: Birgitta Åhman, Technical Editor Eva Wiklund and Graphic Design: H-G Olofsson, www.rangiferjournal.com
31
an impenetrable layer of ice. Therefore, we included physical condition (or body mass) as a qualitative biological integrator of key environmental variables: amount and quality of habitat, parasites and diseases, and human disturbances through recreation and resource extraction. Those key environmental variables are determined by the local conditions and/or can be altered through management, so they are set as external parent nodes in the model. The physical condition of caribou has implications for determining adult survival and recruitment, as relationships between body mass and survival and fertility have shown (Taillon et al., 2012). Caribou may skip reproduction if they are in poor physical condition due to insufficient food resources (Bergerud et al., 2007; NCASI, 2007; Taillon et al., 2012). Caribou are also susceptible to anthropogenic disturbances; they avoid resorts and recreation activities (Nellemann et al., 2000; Carr et al., 2011), active logging (Schaefer & Mahoney, 2007), and are subject to increased bear predation near campsites (Pitt & Jordan, 1996). In Pukaskwa National Park, human recreational activities could include tourists on foot and in boats around islands and coastlines. Timber volumes harvested in Ontario over the last decade have declined by more than 40%, including from lands adjacent to the park (Ontario Ministry of Natural Resources, 2012). Although wildfire and prescribed fires are permitted in some circumstances in the park, the fire cycle has departed significantly from what it would have been without human influence, and as a result, an older-than-usual forested landscape prevails. Fires are infrequent (Perera & Baldwin, 2000) and typically smaller in size along the coast (C. C. Drake, unpublished data), which is largely believed to be beneficial for caribou (Environment Canada, 2012). Fire improves habitat for moose, which attracts predators. The predators consume moose but also caribou, when they encounter 32
them (Bergerud et al., 2007). These factors were included in the model, incorporating the circumstances more to less favourable for caribou. Presently, disease is not considered the primary limiting factor in the Lake Superior range mainly because white-tailed deer, the vectors of brain worm, which is lethal to caribou (Anderson & Strelive, 1968), were not historically abundant (Whitlaw & Lankester, 1994). Nonetheless, we included disease as an input node in the model because white-tailed deer are expanding their distribution (Thompson et al., 1998) and have been increasingly detected in Pukaskwa National Park (C. C. D., unpublished data). The terminal child node of the model is the recovery potential. It is defined as the long-term probability of persistence of the population (i.e., whether a population will be self-sustaining). As such, the node has as parent nodes the population trends, the environmental variation (which drives the random variation in population trends), and the number of translocated caribou surviving. A high recovery potential could be defined as a time to extinction longer than 50 yrs, or a 95% chance of persistence over the next 50 yrs. Although the time scale of the processes included in the model is shortterm (~5 yrs), the end result is a projection into the future. When the result of a BBN scenario is a high probability for “high recovery potential”, it suggests that this scenario will produce a successful translocation. Other factors that might be relevant for other caribou populations, such as predation by felids (Compton et al., 1995), vehicle collisions, or avalanches (Hebblewhite et al., 2007), were not relevant at Pukaskwa National Park. Genetic diversity was not included in the model because, although it is lower in isolated populations, there is no immediate concern for conservation (Courtois et al., 2003; McLoughlin et al., 2004) nor did participants at the 2010
This journal is published under the terms of the Creative Commons Attribution 3.0 Unported License Editor in Chief: Birgitta Åhman, Technical Editor Eva Wiklund and Graphic Design: H-G Olofsson, www.rangiferjournal.com
Rangifer, 35, Spec. Iss. No. 23, 2015
caribou workshop feel this was a significant factor in the success of a translocation (Parks Canada, 2011). Parameterizing the model The links among the model’s nodes reflect the knowledge we have about the probable influence that a given parent node has on one or more child nodes. These links are assumed to be causal. All the links in this BBN are through CPTs, which we conceived as contingency tables. For example, the probabilities of a population decline were determined by the number of observed cases in which a decline was observed under each combination of two states of adult survival, recruitment, and three states of migration (positive, negligible, negative). For the node “Population trends”, we used data from population surveys and modeling, categorized each case, and compiled a contingency table (Appendix). For all other child nodes, data were less available so we first asked experts to determine what threshold values could be used to tell each state apart. Wherever possible, these thresholds were drawn first from the literature. We then asked the experts to consider how nodes would interact so that we could parameterize the CPTs. For example, we asked, “among all the possible cases where number of caribou introduced were high, in how many cases would the wolf density have remained low?”. Experts were asked to consider the breadth of the caribou literature, not specifically caribou in Pukaskwa National Park. Experts were also invited to review each other’s assessments. Most often there was consensus or suggestions for additions, fine-tuning of the model, or increased precision in a threshold based on a new literature reference. Exploring scenarios To explore the properties of the model and to apply it specifically to caribou translocation at Pukaskwa National Park, we set evidence in Rangifer, 35, Spec. Iss. No. 23, 2015
all the most external parent nodes according to these 10 scenarios: least favourable vs. most favourable environmental conditions with two levels of translocation effort (4 scenarios), current conditions at Pukaskwa National Park with three levels of translocation effort (3 scenarios), and current conditions at Pukaskwa National Park with low wolf densities with three levels of translocation effort (3 scenarios) (Table 1). The decline in logging, less frequent wildfire, combined with limited prescribed fire in the park over the last decade (Kuchta, 2012), has created older growth forests adjacent to and within the park that are favourable to caribou. Therefore, the probability of limited logging and prescribed fire and wildfire was set at 100%. Terrestrial lichen, a year-round food source for caribou (NCASI, 2007), is abundant at Pukaskwa National Park but entirely absent on Michipicoten Island (Bergerud et al., 2007) where caribou numbers are high. Therefore the probability of good “quality of non-winter forage” was set at 100%. Several nodes have high levels of uncertainty or show important variation among years, so virtual evidence was used as input for those nodes. Parasites or disease being transmitted by deer is unlikely to seriously threaten the physical condition of caribou in the near future because of the current low density of deer in the park and surrounding landscape, but the situation could change rapidly. Therefore, the probability of low “parasites and diseases” was set at 90%. In Alberta, human activities alter caribou behavior and mediate the effects of wolf predation on caribou (Hebblewhite et al., 2005; Wasser et al., 2011). However, Pukaskwa National Park has low human use at sensitive times (calving/ rutting), so the probability of low “human recreation/activity” was set to 80%. In the Lake Superior range, caribou remain vulnerable because escape habitat is limited and, importantly, habitat in their range has
This journal is published under the terms of the Creative Commons Attribution 3.0 Unported License Editor in Chief: Birgitta Åhman, Technical Editor Eva Wiklund and Graphic Design: H-G Olofsson, www.rangiferjournal.com
33
been altered by human disturbance (Vors et al., 2007). Near-shore islands may serve as a primary escape habitat from predators (Ferguson et al., 1988; Carr et al., 2011) and limited linear features likely keeps predator access low in the area (Bergerud, 1985). Trends toward warmer winters resulting in less landfast ice may have further limited the access of wolves to caribou in the coastal region (Thompson et al., 1998). To take into account the variation and uncertainty in those factors, the probability of plenty vs. little for the node “amount of escape habitat” was set to 20:80; the probability of limited “linear features” was set to 90% and to 50% for limited “landfast ice”. This set of values gives a probability of low “access of wolf to caribou” of about 50% (Appendix). Based on population size time series, environmental variation (i.e., the long-term yearly random fluctuation in population growth rate due to variation in survival, recruitment, and migration), remains low; therefore, the probability of low “environmental variation” was set at 80%. Once the values for the input nodes were set, we examined how the probability of recovery potential would increase following the introduction of an increasing number of caribou: less than 50, 50–300, and >300. These values were drawn from a non-spatial population viability analysis which concluded that a population of 300 animals with moderate calf and adult female survival had a 10% probability of quasi-extinction, and that large populations (≥ 300) had a high probability of persistence under favourable demographic conditions (Environment Canada, 2012). It could be argued that introducing such large numbers of animals is unrealistic, but one has to consider the (conceptual) 5 year time frame of the model, which would allow for a lower number of animals to be introduced annually over 5–10 yrs rather than all at once during a one-time translocation event. We also assumed that caribou that were 34
“available” for a translocation into Pukaskwa National Park would originate from islands where caribou are abundant, such as the nearby Slate and Michipicoten Islands and many of those naïve individuals would be lost annually. Results The least favourable scenario produced only a 1% probability of population recovery (Table 1). The most favourable scenario resulted in 58% probability of population recovery when fewer than 50 animals were translocated and 90% when more than 50 animals were translocated (Table 1). Under current conditions in Pukaskwa National Park, the chance of high recovery potential increased with the number of translocated animals to a high of 46% (Table 1). When we set the probability of high “wolf density” to 100%, regardless of its parent nodes, the probability of high predation rate reached 72%. This combination of inputs suggests that even introducing 300 caribou would not increase the probability of population recovery beyond 50% (Table 1). With the same set of evidence, but with probability of low wolf density set at 100%, introducing more than 50 caribou raised the probability of population recovery above 50% (Table 1). Discussion Interestingly, the probability of high recovery potential under the current conditions, and with even a large translocation effort, are roughly consistent with the 50% failure rate of caribou translocations in eastern North America (Bergerud & Mercer, 1989; Gogan & Cochrane, 1994) as well as estimates of translocation success in western North America (Decesare et al., 2011). However, the mechanisms leading to that result vary from one application to another, so we cannot claim that our model emulates or explains the more general result of many historic translocations.
This journal is published under the terms of the Creative Commons Attribution 3.0 Unported License Editor in Chief: Birgitta Åhman, Technical Editor Eva Wiklund and Graphic Design: H-G Olofsson, www.rangiferjournal.com
Rangifer, 35, Spec. Iss. No. 23, 2015
Table 1. Probability of recovery potential (%) under different model scenarios and number of caribou introduced. Percent probability of five child nodes are also presented. Model scenario
Least favourable1 Most favourable2 Most favourable2 Current3 Current3 Current3 Low wolf density4 Low wolf density4 Low wolf density4
# of Predation caribou rate introduced Low/High
Physical condition of caribou Good/Bad
Adult survival
10% of the population size over 5 years; Negligible: migration is less than or equal to 10% over 5 years. 2 Survival (annual rate): Low: S < 0.88; High: S >= 0.88. 3 Recruitment (calf:adult ratio): Low: R < 0.105; High: R >= 0.105. 1
Table A3. Conditional probability table for nodes adult survival and recruitment. Parent nodes and their state
Adult Survival
Recruitment
Predation Rate
Physical Condition
Low
High
Low
High
Low
Good
0.0
1.0
0.0
1.0
Low
Bad
0.1
0.9
0.5
0.5
High
Good
0.9
0.1
1.0
0.0
High Bad 0.9 0.1 1.0 0.0 Note: Probability values assume that predation affects recruitment much more than it affects survival of adults.
Rangifer, 35, Spec. Iss. No. 23, 2015
This journal is published under the terms of the Creative Commons Attribution 3.0 Unported License Editor in Chief: Birgitta Åhman, Technical Editor Eva Wiklund and Graphic Design: H-G Olofsson, www.rangiferjournal.com
43
Table A4. Conditional probability table for node translocated caribou surviving. Parent nodes and their state
Translocated caribou surviving
Adult Survival
N caribou introduced1
Large
Medium
Small
Low
Large
0.0
1.0
0.0
Low
Medium
0.0
0.0
1.0
Low
Small
0.0
0.0
1.0
High
Large
0.9
0.1
0.0
High
Medium
0.0
0.9
0.1
High Small 0.0 0.0 1 N caribou introduced: Small 300 animals.
1.0
Table A5. Conditional probability table for node predation rate. Parent nodes and their state
Predation Rate
Caribou predator experience
Wolf Density
Access of wolf to caribou
Bear Density
Low
High
Yes
Low
Low
Low
1.0
0.0
Yes
Low
Low
High
0.9
0.1
Yes
Low
High
Low
1.0
0.0
Yes
Low
High
High
0.9
0.1
Yes
High
Low
Low
0.9
0.1
Yes
High
Low
High
0.8
0.2
Yes
High
High
Low
0.4
0.6
Yes
High
High
High
0.3
0.7
No
Low
Low
Low
0.9
0.1
No
Low
Low
High
0.75
0.25
No
Low
High
Low
0.9
0.1
No
Low
High
High
0.2
0.8
No
High
Low
Low
0.5
0.5
No
High
Low
High
0.25
0.75
No
High
High
Low
0.0
1.0
No
High
High
High
0.0
1.0
44
This journal is published under the terms of the Creative Commons Attribution 3.0 Unported License Editor in Chief: Birgitta Åhman, Technical Editor Eva Wiklund and Graphic Design: H-G Olofsson, www.rangiferjournal.com
Rangifer, 35, Spec. Iss. No. 23, 2015
Table A6. Conditional probability table for node physical condition of caribou. Parent nodes and their state
Physical Condition
Parasites & diseases1
Amount & quality of habitat
Human recreation/activity
Good
Bad
Low
High
Low
1.0
0.0
Low
High
High
0.9
0.1
Low
Low
Low
0.2
0.8
Low
Low
High
0.1
0.9
High
High
Low
0.3
0.7
High
High
High
0.1
0.9
High
Low
Low
0.0
1.0
High Low High 0.0 1.0 1 Thresholds for parasite and diseases: based on deer density: Low: < 6 deer/km2; High: > 6 deer/km2 (Bergerud & Mercer, 1989).
Table A7. Conditional probability table for node wolf density. Parent nodes and their state
Wolf density1
Moose density
N of caribou introduced
Low
High
Low
Large
0.75
0.25
Low
Medium
0.9
0.1
Low
Small
1.0
0.0
High
Large
0.0
1.0
High
Medium
0.25
0.75
High Small 0.5 0.5 Low: =5.5/1000 km2 Bergerud and Mercer (1989) have suggested that even in the absence of deer (the source for P. tenuis) when wolf densities exceed 10/1,000 km2, caribou re-introductions will fail. Bergerud and Elliot (1986) indicated that generally, in the absence of escape habitat, caribou populations cannot maintain their numbers when wolf densities are >=6.5/1,000 km2. 1
Rangifer, 35, Spec. Iss. No. 23, 2015
This journal is published under the terms of the Creative Commons Attribution 3.0 Unported License Editor in Chief: Birgitta Åhman, Technical Editor Eva Wiklund and Graphic Design: H-G Olofsson, www.rangiferjournal.com
45
Table A8. Conditional probability table for nodes moose density and bear density. Parent nodes and their state
Moose Density1
Bear Density2
Logging & prescribed fire
Wildfire
Low
High
Low
High
Limited
Limited
0.90
0.10
0.90
0.10
Limited
Extensive
0.75
0.25
0.75
0.25
Extensive
Limited
0.40
0.60
0.50
0.50
0.20.
0.80
Extensive Extensive 0.20 0.80 1 Thresholds for moose density: Low : 0.3 moose/km2 2 Thresholds for bear density: Low: 10/100 km2
Table A9. Conditional probability table for node access of wolves (to caribou). Parent nodes and their state
Access of wolves
Amount of escape habitat
Linear features
Landfast ice
Good
Bad
Plenty
Limited
Limited
1.0
0.0
Plenty
Limited
Extensive
0.8
0.2
Plenty
Extensive
Limited
0.7
0.3
Plenty
Extensive
Extensive
0.5
0.5
Little
Limited
Limited
0.5
0.5
Little
Limited
Extensive
0.4
0.6
Little
Extensive
Limited
0.3
0.7
Little
Extensive
Extensive
0.0
1.0
46
This journal is published under the terms of the Creative Commons Attribution 3.0 Unported License Editor in Chief: Birgitta Åhman, Technical Editor Eva Wiklund and Graphic Design: H-G Olofsson, www.rangiferjournal.com
Rangifer, 35, Spec. Iss. No. 23, 2015
Table A10. Conditional probability table for node amount and quality of habitat. Parent nodes and their state
Amount & quality of habitat
Quality of non-winter forage
Logging & prescribed fire1
Wildfire1
High
Low
Good
Limited
Limited
1.0
0.0
Good
Limited
Extensive
0.2
0.8
Good
Extensive
Limited
0.2
0.8
Good
Extensive
Extensive
0.1
0.9
Poor
Limited
Limited
0.5
0.5
Poor
Limited
Extensive
0.0
1.0
Poor
Extensive
Limited
0.0
1.0
Poor Extensive Extensive 0.0 1.0 1 Logging and prescribed fire node, and for Wildfire node, the threshold for limited vs. extensive is 40% of the range. When total disturbance exceeds 40% of the range, the probability that a Woodland Caribou population would be stable or increasing drops below 0.5 (Environment Canada, 2012).
Rangifer, 35, Spec. Iss. No. 23, 2015
This journal is published under the terms of the Creative Commons Attribution 3.0 Unported License Editor in Chief: Birgitta Åhman, Technical Editor Eva Wiklund and Graphic Design: H-G Olofsson, www.rangiferjournal.com
47
48
This journal is published under the terms of the Creative Commons Attribution 3.0 Unported License Editor in Chief: Birgitta Åhman, Technical Editor Eva Wiklund and Graphic Design: H-G Olofsson, www.rangiferjournal.com
Rangifer, 35, Spec. Iss. No. 23, 2015