International Journal of Modern Mathematical Sciences, 2017, 15(1): 1-13 International Journal of Modern Mathematical Sciences ISSN: 2166-286X Florida, USA Journal homepage: www.ModernScientificPress.com/Journals/ijmms.aspx Article
Decision Support System through Data Envelopment Analysis & Stochastic Frontier Analysis Qaiser Farooq Dar1, *, Tirupathi Rao Padi1 and Arif Muhammad Tali1 1
Department of Statistics, Ramanujan School of Mathematical Science, Pondicherry University.
*Author to whom correspondence should be addressed; E-Mail:
[email protected] Article history: Received 19 August 2016; Revised 2 December 2016; Accepted 5 January 2017; published 18 January 2017.
Abstract: The two principal methods that have been used for estimating the Frontiers in the production theory are Data Envelopment Analysis (DEA) and Stochastic Frontier Analysis (SFA), which involve mathematical programming and Econometric Methods respectively. DEA is a nonparametric linear Programming approach for measuring the relative efficiency of a Set of decision-making units (DMUs), which are using multiple inputs to produce multiple outputs. There are two different orientations of objectives in DEA namely inputorientation and output-orientation; two different DEA models based on scales namely Constant Returns to scale (CRS) and variable Returns to scale (VRS). Stochastic Frontier Analysis is the technique that has been used for estimating the frontier parametrically. This approach was used by Aigner and Chu (1968) who considered a Cobb-Douglas production frontier for estimating the Economic efficiency. Computing the efficiency measures involves estimating the unknown production frontier. This study has proposed the validity verification procedures through DEA & SFA for developing suitable Decision Support Systems (DSS) in the frontier Analysis. For the said objective, the study has considered the basic approaches of DEA like classical Charnes-Cooper-Rodes (CCR) model, classical Banker-CharnesCooper (BCC) model and Slack Based Measure (SBM) models along with different production functioning approaches like SFA. Keywords: Data Envelopment Analysis, Decision-sporting system, Decision Making -Units, Stochastic frontier analysis Technical efficiency, Scale and Economics efficiency. Mathematics Subject Classification (2010): 62D05, 94A17
Copyright © 2017 by Modern Scientific Press Company, Florida, USA
Int. J. Modern Math. Sci. 2017, 15(1): 1-13
2
1. Introduction A decision support system (DSS) is a programming through which we can analysis the business data and presents it so the users can make business decisions. There are so many techniques in the field of applied operational research which are using for decision support system either based on optimization or based on efficiency of the production processes through mathematical programming. Optimization is a technique for obtaining wanted results under the given constraints in any business operation. Business operators have to take many technological and optimal decisions at several stages. The ultimate aim of all such decisions is either to reduce the effort required or to expand the desired benefits. Since the efforts required or the benefit desired in any practical situation can be express as functions of certain decision variables, optimization can be defined as the process of finding the conditions that give the maximum or minimum value of such functions. There is no single method available for solving all such optimization problems efficiently. Hence, a number of optimization methods have been developed for solving different types of optimization problems. Operational research is concerned with the application of scientific methods and techniques to decision making problems and with establishing the optimal solutions. Another approach of decision support system is on the basis of an efficiency of the production process. Efficiency signifies a level of performance that describes a process that uses the lowest amount of inputs to create the greatest amount of outputs. It relates to the use of all inputs in producing any given output, including personal time and energy. It is a measurable concept that can be determined by determining the ratio of useful output to total input. It minimizes the waste of resources such as physical materials, energy and time while successfully achieving the desired output. The two principal methods that have been used for estimating efficiency in the frontier analysis are DEA and SFA, which involve mathematical programming and econometric methods respectively. An Empirical analysis is carried out to measure the efficiency of 48 stock-traded companies in Saudi Arabia using a nonparametric frontier technique called DEA. These companies represent about 70% of all companies listed in the stock market and are classified into three major sectors which are: the banking sector, the industrial sector and the service sector (Alhosan-2004). The cost efficiency of public and private sector banks in India was estimated by stochastic cost frontier model with specification of the translog cost function (Kumbhakar and Sarkar - 2004). DEA and Analytic Hierarchy Process (AHP) approaches were used for investigating the efficiency of nationalized banks of India (Gayval, and Bajaj - 2016). Some studies attempted efficiency measure of Indian banks through Data envelopment Analysis (Arunava Bhattacharyya et al.-1997, Asis Saha and T.S. Ravisankar-2000, Milind Sathye-2003, Biresh K.Sahho and Kaoru Tone-2009, Qaiser et al.-2016 and Mukesh Kumar and Vincent Charles-2012). SFA technique was employed to study the efficiency of scheduled commercial banks in India for the period Copyright © 2017 by Modern Scientific Press Company, Florida, USA
Int. J. Modern Math. Sci. 2017, 15(1): 1-13
3
1986-2003 (Sensarma, R.-2005). An Empirical and theoretical study provided an overview of basics on service productivity and efficiency fundamentals; integrate extent concepts of productivity with a focus on DEA variants in the industrial sector given by Backhaus, et.al (2011). An analysis based on 121 firms during the period of 2000-05 with 726 pooled observations are tested to know whether firm’s age, size, market share, manufacturing classifications and time period have effects on the technical inefficiency in the manufacturing sector(Prabowo and Cabanda - 2011). With the background information on the above mentioned literature, this study proposed some significant contributions of DEA and SFA to develop suitable DSS. The paper structure includes, first section is on overview of DSS on the basis of optimization and efficiency. The second section expands DEA with CRS and VRS. Third section is on SFA with the production function. Practical implications, results, and conclusion are highlighted in subsequent sections.
2. Data Envelopment Analysis (DEA) DEA is an increasingly popular non –parametric tool based on linear programming for estimating the relative efficiency of organizational units which are termed DMUs in decision science given by Charnes, Cooper, and Rhodes (1978). DMUs can include manufacturing units, departments of big organizations such as universities, schools, bank branches, hospitals, power plants, police stations, tax offices, and prisons, deface bases, a set of firms or even practicing individuals such as medical practitioners. 2.1. Envelopment model with Constant Returns to Scale The mathematical formulation of DEA with the assumption of CRS1 was given by Charnes, Cooper and Rhodes (1978). Let xij and yrj denote the ith (i=1,2,3,…m) input and rth (r=1,2,3,….s) output of
jth
(j=1,2,3…n) DMU respectively. It is assumed that the data set is known and strictly positive. The
efficiency of Kth DMU (under evaluation) is defined as: s
Max hk (u, v)
u r 1 m
r
y rk
v x i 1
i ik
Subject to s
u r 1 m
r
y rj
v x i 1
1
i
1 ; j 1, 2, 3, ..., n.
ij
CRS=Constant Returns to Scale is defined as, the variation of inputs results the constant variation in outputs. Copyright © 2017 by Modern Scientific Press Company, Florida, USA
(2.1.1)
Int. J. Modern Math. Sci. 2017, 15(1): 1-13
4
Where ur and vi are the weight of rth output and weight of the ith input in the jth DMU respectively. The mathematical formulation of the model (2.1.1) is in the fractional form has an infinite number of solutions. In order to avoid fractional form, we are using transformation given by Charnes and Cooper in (1962). The linear form of mathematical model (2.1.1) is as below: s
Maxhk (u , v) u r y rk r 1
Subject to s
u r 1
m
r
y rj vi xij 0 ; j 1,2,3,...,n. i 1
m
v x i 1
i
ik
1.
(2.1.2)
u r 0 and vi 0 ; r 1,2,3,...,s and i 1,2,3,...m The mathematical model is given in the equation (2.1.2) is linear form but it is not feasible for solving under DMU technique for which we are using the principal of duality2 in linear programming. The standard form of envelopment model is as follow:
* Minimise k Subject to n
j 1
j
y rj s r y rk ; r 1, 2, 3, ..., s. (2.1.3)
n
x j 1
j
ij
s k xik ; i 1, 2, 3, ..., m. i
j 0 ; j 1, 2, 3, ..., n. s r 0 , si 0. Where xik and yrk are the inputs and outputs of the DMU0 under evaluation. si ; i 1, 2, 3,..., m and
sr ; r 1, 2, 3,..., s are the input excess and output shortfalls, otherwise referred as slacks. 2.2. Envelopment Model with Variable Returns to Scale There are two orientations of DEA in order to estimate the efficient DMU under evaluation. One is input-orientation, and other is output-orientation. Usually, we are solving input-oriented envelopment
2
The original programming is called the primal programming (P) which can be solved by transposing (or
reversing) the rows and columns of the algebraic statement of the problem. Inverting the programming problem in this way results in dual programming problem (D). Copyright © 2017 by Modern Scientific Press Company, Florida, USA
Int. J. Modern Math. Sci. 2017, 15(1): 1-13
5
model. In the input-oriented DEA model, we are minimizing the input level and the output is kept fixed. Banker Charnes and Cooper (1984) have extended DEA to the case of VRS 3 by adding one more constraint known as convexity constraint in CRS envelopment model. Following DEA model in the case of VRS is input-oriented4 model given by Banker Charnes and Cooper (1984):
* Minimise k Subject to n
y i 1
rj
j s r y rk ; r 1,2 , 3 , ..., s
n
x j 1
ij
n
j 1
j
j
si k xik ; i 1, 2 , 3 , ..., m .
(2.2.1)
1 ; j 1, , 2 , 3 , ..., n
j 0 and s r 0 , si 0. The DMU k is said to be efficient if and only if * 1 and all slacks must be zero i-e.,
sr 0 , si 0 . If * 1 , but all slacks are not zero. Then DMU under evaluation is week efficient, and if * 1 , then the DMUk under evaluation is inefficient.
3. Stochastic Frontier Analysis (SFA) In the previous sections, we used DEA as non-parametric technique used to estimate the position and shape of the production frontier. The advantage of DEA is that it can be applicable without knowing the algebraic form of the relationship between outputs and inputs. That is we can estimate the frontier without knowing whether an output is linear, quadratic, exponential or some other function of input. The SFA is a parametric technique that uses standard production function methodology for estimating the efficiency and productive of any production process in decision- making science. It is a technique which may be used for economic modeling showing the functional relationship of an inputs and outputs in the frontier analysis, where we have theoretical bounds. The introduction of the stochastic production frontier model, simultaneously given by Aigner, Lovell and Schmidt (1977) and Meeusen and Broeck (1977). Since then, stochastic frontier models have become popular in the subfield of econometrics. An interesting overview on SFA was presented by Kumbhakar and Lovell (2000). SFA technique deals with the functional form
3
VRS reflects the fact that production technology may exhibit increasing, constant and decreasing returns to scale.
4
Input-orientation is defined as, how much the input’s used of a firm could contract if used efficiently in order to achieve the
same output level. Copyright © 2017 by Modern Scientific Press Company, Florida, USA
Int. J. Modern Math. Sci. 2017, 15(1): 1-13
6
of input and outputs; the functional form is either of the form production, cost, and profit functions 5. In this study, we are expressing a single dependent variable as a function of one or more explanatory variables. The mathematical form of different functions can be written in the form:
q f ( x1 , x2 ,...,xn )
(3.1.1)
Where q is the dependent variable, xi (i=1, 2, 3… n) are explanatory variables and f (.) is the function. Some special functional from of variables. n
i.
q 0 i xi
Linear
i 1
n
ii.
Cobb-Douglas6
q 0 xii i 1
n
iii.
Quadratic
q 0 i xi i 1
iv.
Translog
1 n n ij xi x j 2 i 1 j 1
q exp( 0 ln xi n
1 n n ij ln xi ln x j ) 2 i 1 j 1
n
Generalized Leontief q ij ( xi x j )
v.
1 2
i 1 j 1
1
vi.
Constant Elasticity of Substitution
n q 0 i xi i 1
Where ij parameters satisfy identifying condition ij ji ; i and j (symmetry condition) Aiger, Lovell and Schmidt (1977) and Meeusen and Van Broeck (1977) independently proposed the Stochastic production function model of the from:
ln qi x'i vi ui
(3.1.2)
Where v i is a symmetric random error term. The model defined by (3.1.2) is called a stochastic frontier production function because the output value are bounded from above by the stochastic (i.e., random) variable exp(x'i vi ) . The random v i can be positive or negative and so the stochastic frontier outputs vary the deterministic part of the model exp(x'i ) . The model can be solved by using concept of linear programming with the objective function of minimizing the sum of the ui ln qi xi subject to ui 0 . Aigner and Chu also suggested the use of quadratic programming. Another solution given by Aiger and Chu (1968) called the
5
Profit function is minus the cost function; in symbols π = R –C = (P*Q) – (F+V*Q).
6
Cobb-Douglas production function defined over N inputs,
q Ax11 x22 x3b3 ...x N N , and En = βn.
Copyright © 2017 by Modern Scientific Press Company, Florida, USA
Int. J. Modern Math. Sci. 2017, 15(1): 1-13
7
probabilistic frontier approach. In the probabilistic frontier approach, we are estimating the frontier by using all the observations in the sample. Then deleting some arbitrary percentage of observation from the sample and make sample firms closet to the frontier. Finally re-estimate the frontier using the reduced sample. This approach was first used by Timmer (1971).
4. Results and Discussion This section provides an empirical illustration which helps to clarify the comparison and between the DEA with Constant Returns to Scale, DEA with Variable Returns to Scale RS and Stochastic Frontier Analysis as the methods for assessing the efficiencies of transaction Indictors data of 25 Indian banks for year 2014-15. The data structure has been collected and compiled from CMIE7. In this empirical illustration, we are using transaction Indictors data of Indian banking institution with 4-input indictors and 2-otput indictors of 25 Indian banks (DMU’s). The Sample of Paper and data structure are shown in the Appendix-I.
DMU's DMU1 DMU2 DMU3 DMU4 DMU5 DMU6 DMU7 DMU8 DMU9 DMU10 DMU11 DMU12 DMU13 DMU14 DMU15 DMU16 DMU17 DMU18 DMU19 DMU20 DMU21 DMU22
Table 4.1: Efficiency Analysis of DEA Using Output-orientation in CRS8. Constant Returns to Scale-2014 Constant Returns to Scale-2015 Efficiency Benchmarking Efficiency Benchmarking 1.000 1.000 DMU-(1) 1.000 1.000 DMU-(1) 0.915 36.038 DMU-(8,10,15,23) 0.864 18.350 DMU-(8,10,15,23) 0.989 15.891 DMU-(6,10,23) 1.000 1.000 DMU-(3) 0.749 6.824 DMU-(8,10,15,16,23) 0.752 11.382 DMU-(10,15,23) 1.000 1.000 DMU-(5) 1.000 1.000 DMU-(5) 1.000 1.000 DMU(6) 0.926 6.220 DMU(6, 8,10,15,16) 0.815 1.253 DMU-(6,16,23) 0.618 1.861 DMU-(1,5,15,16,23) 1.000 1.000 DMU-(8) 1.000 1.000 DMU-(8) 0.725 6.946 DMU-(8,10,15,23) 0.834 5.550 DMU-(8,10,15,23) 1.000 1.000 DMU-(10) 1.000 1.000 DMU-(10) 0.922 0.386 DMU-(6,10) 0.655 0.853 DMU-(8,10,15,16) 0.900 15.899 DMU-(8,10,15,23) 0.892 13.911 DMU-(8,15,18,23) 0.740 0.216 DMU-(1,8) 0.783 0.212 DMU-(1,8) 0.868 14.624 DMU-(8,15,18, 23) 0.873 13.744 DMU-(8,15,18, 23) 1.000 1.000 DMU-(15) 1.000 1.000 DMU-(15) 1.000 1.000 DMU-(16) 1.000 1.000 DMU-(16) 1.000 1.000 DMU-(17) 1.000 1.000 DMU-(17) 1.000 1.000 DMU-(18) 1.000 1.000 DMU-(18) 0.962 12.699 DMU-(6,10,15,23) 0.938 8.845 DMU-(10,15,23) 0.951 0.099 DMU-(8,17,23) 0.602 0.194 DMU-(8,17,23) 0.951 46.151 DMU-(8,15,18,23) 0.968 40.538 DMU-(8,15,18) 0.799 1.718 DMU-(15,16,23) 0.640 1.683 DMU-(1,5,15,16,23)
7
Centre for Monitoring Indian Economy Pvt. Ltd. (CMIE) https://www.cmie.com/
8
Note: The Input and output-orientation efficiency scores are equal in case of CRS. Copyright © 2017 by Modern Scientific Press Company, Florida, USA
Int. J. Modern Math. Sci. 2017, 15(1): 1-13 DMU23 DMU24 DMU25
1.000 0.761 0.799
1.000 7.318 1.940
DMU-(23) DMU-(6,10,23) DMU-(8,10,15,16,23)
8 1.000 0.601 0.942
1.000 8.575 1.525
DMU-(23) DMU-(10,15,23) DMU-(8,10,15,16)
Note: The results are estimated by using DEA-Frontier standard developed by Joe Zhu 2002.
Table 4. 1 shows that the efficiency scores of DEA Using Output-orientation in Constant Returns to Scale for year 2014- 15 are in the column 2 and 5. These efficiency scores are highly differ for these two specific year’s. Even for some DMU it is vice versa for example, the DMU-3 in year 2014 it is efficient, but in 2015 it becomes inefficient. The Benchmarking for inefficient DMU’s also change as shown in the above table in column 4 and 7. The identify the current trend of the particular DMU9.
DMU's DMU1 DMU2 DMU3 DMU4 DMU5 DMU6 DMU7 DMU8 DMU9 DMU10 DMU11 DMU12 DMU13 DMU14 DMU15 DMU16 DMU17 DMU18 DMU19 DMU20 DMU21 DMU22 DMU23 DMU24 DMU25
Table 4.2. Efficiency Analysis of DEA Using Output-orientation in VRS10. Variables Returns to Scale-2014 Variables Returns to Scale-2014 Efficiency Benchmarking Efficiency Benchmarking 1.000 DMU-(1) 1.000 DMU-(1) 1.000 DMU-(2) 1.000 DMU-(2) 1.000 DMU-(3) 1.000 DMU-(3) 0.856 DMU-(6,8,15,19) 0.855 DMU-(3,8,15,19) 1.000 DMU-(5) 1.000 DMU-(5) 1.000 DMU-(6) 1.000 DMU-(6) 0.845 DMU-(6,16,19,23) 0.773 DMU-(1,6,15,16) 1.000 DMU-(8) 1.000 DMU-(8) 0.848 DMU-(8,11,15,16) 0.961 DMU-(3,8,10,15,16) 1.000 DMU-(10) 1.000 DMU-(10) 1.000 DMU-(11) 1.000 DMU-(11) 1.000 DMU-(12) 1.000 DMU-(12) 1.000 DMU-(13) 1.000 DMU-(13) 1.000 DMU-(14) 1.000 DMU-(14) 1.000 DMU-(15) 1.000 DMU-(15) 1.000 DMU-(16) 1.000 DMU-(16) 1.000 DMU-(17) 1.000 DMU-(17) 1.000 DMU-(18) 1.000 DMU-(18) 1.000 DMU-(20) 1.000 DMU-(20) 1.000 DMU-(21) 1.000 DMU-(21) 1.000 DMU-(22) 1.000 DMU-(22) 0.843 DMU-(1,15,16,19,23) 0.719 DMU-(1,16,19,21,23) 1.000 DMU-(23) 1.000 DMU-(23) 0.894 DMU-(3,19,23) 0.926 DMU-(19,21,23) 0.861 DMU-(8,11,15,16,23) 0.973 DMU-(3,8,10,15,16)
Note: The results are estimated by using DEA-Frontier standard developed by Joe Zhu 2002.
The above table shows the Efficiency scores and Benchmark of corresponding DMU’s in case of variable returns to scale using Output-orientation as shown in the model (2.2.1). The efficient DMU’s
9
If then DMU having CRS, If then DMU having DRS, If then DMU having IRS.
10
Note: The Input and output-orientation efficiency scores are not equal generally in case of VRS. Copyright © 2017 by Modern Scientific Press Company, Florida, USA
Int. J. Modern Math. Sci. 2017, 15(1): 1-13
9
remains efficient in both the year’s (2014-15). But only Benchmark of inefficient DMU’s change’s for example: the Benchmark of DMU7 is DMU-(6, 16, 19, and 23) in year 2014 changes DMU-(1, 6, 15, and 16) in year 2015. This shows that even some times if the efficiency value remains same, but the benchmarks will be changed due to change of time.
Year 2015
Year 2014
Table 4. 3. Target of transaction Indictors of inefficient DMU's for the year 2014-15. DMU's Input-1 Input-2 Input-3 Input-4 Output-1 Output-2 DMU4 5020.000 3522.000 127338.540 17320149.777 581542.465 30032.503 DMU7 3683.243 1361.000 52951.000 8837836.000 346884.599 15609.050 DMU9 2533.000 4605.750 78874.000 6444417.000 244462.754 17617.627 DMU22 2448.000 1646.000 69836.000 7179877.000 315588.148 13671.947 DMU24 4026.533 5983.228 66220.000 13014114.587 550491.687 17303.586 DMU25 1540.000 1124.561 43720.000 3265926.000 146483.805 10050.624 DMU4 7285.000 12468.496 137291.000 26339281.971 730587.123 39257.775 DMU7 3163.707 1545.000 113482.000 16470410.000 512118.422 23221.872 DMU9 2966.000 5498.108 66648.000 8740450.000 256590.464 18052.885 DMU22 3515.000 2095.000 73419.000 10935773.000 423226.914 18130.907 DMU24 4323.583 8315.294 97602.000 16782532.000 594739.285 23117.519 DMU25 1502.000 1063.000 39429.000 4698795.000 156879.305 10316.037 Source: Author’s Calculations. The targets of inefficient DMU’s are find-out the most suitable Benchmark DMU’s for itself. The above table shows the targets for different inefficient DMU’s using output-orientation11 assessing in VRS situation for year 2014-15. Table 4.4. SFA score’s DMU's DMU1 DMU2 DMU3 DMU4 DMU5 DMU6 DMU7 DMU8 DMU9 DMU10 DMU11 DMU12 DMU13
year-2014 0.5795 0.7024 0.5604 0.4203 0.4463 0.4997 0.3983 0.934 0.3531 0.3897 0.2103 0.7793 0.3689
Year-2015 0.586 0.708 0.567 0.428 0.454 0.507 0.406 0.935 0.361 0.397 0.217 0.783 0.377
DMU's year-2014 DMU14 0.7039 DMU15 0.5257 DMU16 0.5305 DMU17 0.2768 DMU18 0.6364 DMU19 0.6681 DMU20 0.1305 DMU21 0.9421 DMU22 0.4132 DMU23 0.9473 DMU24 0.4992 DMU25 0.3489 Mean 0.5306
Year-2015 0.709 0.533 0.537 0.284 0.642 0.674 0.136 0.943 0.421 0.948 0.506 0.356 0.537
Source: Author’s calculations.
11
Note: output-orientation determines a firm’s potential output given its inputs if it operated efficiently
firms along the best practice frontier. Copyright © 2017 by Modern Scientific Press Company, Florida, USA
as
Int. J. Modern Math. Sci. 2017, 15(1): 1-13
10
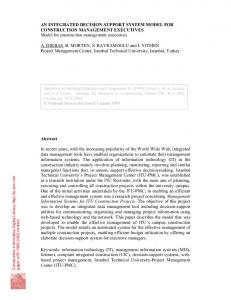
Figure 4.1. Graphical of SFA score’s for year 2014-15 The SFA score’s as mentioned in the table 4.4, identified that the inefficiency is due to by the stochastic term (due to random error term), but not due the technical. All the DMU’s shows the technical efficient. There is also very much less variation between the efficiencies of two years 2014 15. Almost the mean efficiency score are same for the time periods 2014-15. In this Empirical illustration, we are utilizing the concept of Cobb-Douglas production function assessing the four inputs and single output as mentioned in the Appendix. The MLE estimates of the parameters are β0 = 1.131, β1= 0.218, β2 = 0.00805, β3 = 0.20914 and β4 = 0.375402. The log likelihood function of parameters is 0.13012. For the estimating MLE estimates of the parameters of Cobb-Douglas production function, log likelihood of parameters and stochastic frontier efficiencies’ of different DMU’s accommodate panel data, we are using the software12. As per the results of above empirical illustration, we are able to identifying the some difference and similarities of DEA and SFA techniques. The similarities are, both the techniques are using for estimating the efficiency of different DMU’s utilizing the homogenous type of inputs and outputs. Both the techniques are data based, and can be used for further statistical analysis. Differences are, the DEA is more suitable for multiple inputs and multiple outputs than SFA. In other side, SFA is more suitable than DEA in case of panel data. DEA is assumption relax technique, whereas SFA is assumption based technique depends upon the assumptions of production function and use of distribution.
12
In this paper we using Frontier 4.1 software for SFA estimates, developed by coelli, T.j under CEPA in the University of
New England. Copyright © 2017 by Modern Scientific Press Company, Florida, USA
Int. J. Modern Math. Sci. 2017, 15(1): 1-13
11
4. Conclusions Both DEA and SFA are frontier technique for estimating the efficiency of DMU in decision science. This paper has considered the usage of frontier analysis to develop DSS. The decision based on the efficiency is more powerful than the optimization. The two approach of the frontier analysis namely DEA and SFA are powerful techniques through which we can estimate the efficiency and provide the benchmarking information for inefficient DMU’s. On the base of above difference and similarities, we can’t judge whether, which one of the technique is best. It is depends upon the situation, data type13, assumptions of production function and expected results of used technique.
Acknowledgments Authors are grateful to an anonymous referee and editor of this journal for the most constructive observations, and suggestion, which helped to improve this paper.
References [1] Aigner, D. J., & Chu, S. F., On estimating the industry production function. The American Economic Review, 58(4) (1968): 826-839. [2] Aigner, D., Lovell, C. K., & Schmidt, P., Formulation and estimation of stochastic frontier production function models. Journal of Econometrics, 6(1) (1977): 21-37. [3] Alhosan ZF, A Frontier Analysis Approach to Measuring Profitability and Marketability of StockTraded Companies in Saudi Arabia? In Proceedings of International Conference on Modeling and Simulation, AMSE, France: (2004): 13. [4] Backhaus, K., Bröker, O., Brüne, P., Reichle, F., & Wilken, R. Measuring service productivity with Data Envelopment Analysis (DEA). In RESER Conference, (2011). [5] Banker, R. D., Charnes, A., & Cooper, W. W., Some models for estimating technical and scale inefficiencies in data envelopment analysis. Management science, 30(9) (1984): 1078-1092. [6] Bhattacharyya, A., Lovell, C. K., & Sahay, P., The impact of liberalization on the productive efficiency of Indian commercial banks. European Journal of operational research, 98(2)(1997): 332-345. [7] Bhaumik, S. K., & Dimova, R., How important is ownership in a market with level playing field: The Indian banking sector revisited. Journal of Comparative Economics, 32(1) (2004): 165-180. [8] Charnes, A., & Cooper, W. W., Programming with linear fractional functional. Naval Research logistics quarterly, 9(3‐4) (1962): 181-186.
13
Data type whether is cross-sections or penel- data is available. Copyright © 2017 by Modern Scientific Press Company, Florida, USA
Int. J. Modern Math. Sci. 2017, 15(1): 1-13
12
[9] Charnes, A., Cooper, W. W., & Rhodes, E., Measuring the efficiency of decision making units. European journal of operational research, 2(6) (1978): 429-444. [10] Gayval, B. K., & Bajaj, V. H. A Comparative Approach of DEA–AHP for Performance Measurement of Indian Banks. International Journal of Science and Research (IJSR) ISSN, 5(1) (2016). [11] Kumar, M., & Charles, V., Evaluating the performance of Indian banking sector using data envelopment analysis during post-reform and global financial crisis. CENTRUM Catolica’s Working Paper Series, 9(2012): 0007. [12] Meeusen, W., & Van den Broeck, J., Efficiency estimation from Cobb-Douglas production functions with composed error. International economic review, (1977): 435-44 [13] Prabowo, H. E., & Cabanda, E., Stochastic Frontier Analysis of Indonesian Firm Efficiency: A Note. International Journal of Banking and Finance, 8(2) (2011): 5. [14] Dar, Qaiser Farooq, Tirupathi Rao Padi, and Arif Muhammad Tali. "Mixed input and output orientations of Data Envelopment Analysis with Linear Fractional Programming and Least Distance Measures." Statistics, Optimization & Information Computing 4.4 (2016): 326-341. [15] Saha, A., & Ravisankar, T. S., Rating of Indian commercial banks: a DEA approach. European Journal of Operational Research, 124(1) (2000): 187-203. [16] Sahoo, B. K., & Tone, K., Decomposing capacity utilization in data envelopment analysis: An application to banks in India. European Journal of Operational Research, 195(2) (2009): 575-594. [17] Sathye, M., Efficiency of banks in a developing economy: The case of India. European Journal of Operational Research, 148(3) (2003): 662-671. [18] Sensarma, R., Cost and profit efficiency of Indian banks during 1986-2003: a stochastic frontier analysis. Economic and Political Weekly, (2005): 1198-1209. [19] Timmer, C. P., Using a probabilistic frontier production function to measure technical efficiency. The Journal of Political Economy, (1971): 776-794.
Copyright © 2017 by Modern Scientific Press Company, Florida, USA
Int. J. Modern Math. Sci. 2017, 15(1): 1-13
13
Appendix-I.
No. of Input used for DEA & SFA analysis Input-1
No. Of ATM machine’s
Input-2
No. Of POS’s
Input-3
No. of Outstanding Credit Cards.
Input-4
No. of Outstanding Debit Cards.
Copyright © 2017 by Modern Scientific Press Company, Florida, USA
Amount of money (Rs in millions) through ATM & POS transactions using Credit & Debit Card's
HSBC = Hongokong and Shanghai Banking corporation
Amount of money(Rs in millions) through Pos transactions using Credit & Debit Card's
Note:
Output's DEA SFA
Amount of money(Rs in millions) through ATM transactions using Credit & Debit Card’s
List of Banks Assessing for (DEA & SFA) Analysis. DMU's Indian Banks DMU1 Andhra Bank DMU2 Axis Bank Ltd DMU3 Bank Of Baroda DMU4 Bank Of India DMU5 Bank Of Maharashtra DMU6 Canara Bank DMU7 Central Bank Of India DMU8 Citibank Ltd DMU9 Corporation Bank DMU10 Development Credit Bank DMU11 Dhanalakshmi Bank Ltd DMU12 HDFC Bank Ltd DMU13 HS Banking Corporation DMU14 ICICI Bank Ltd DMU15 IDBI Ltd DMU16 Indian Bank DMU17 Indian Overseas Bank DMU18 Indusind Bank Ltd DMU19 Jammu & Kashmir Bank DMU20 Ratnakar Bank Limited DMU21 State Bank Of India DMU22 Syndicate Bank DMU23 Tamilnad Mercantile Bank Ltd DMU24 Union Bank Of India DMU25 Vijaya Bank