(OBS). User observations are abstracted at a behavioural level, so to be useful for inferring the user's .... the action with the maximum expected utility (MEU): pop.
Decision-Theoretic User Modeling
Bowen Hui and Craig Boutilier Department of Computer Science, University of Toronto, Toronto ON Canada
Abstract Automated software customization is drawing increasing attention as a means to help users deal with the scope, complexity, potential intrusiveness, and everchanging nature of modern software. The ability to automatically customize functionality, interfaces, and advice to specific users is made more difficult by the uncertainty about the needs of specific individuals and their preferences for interaction. Following recent probabilistic techniques in user modeling, we model our user with a dynamic Bayesian network (DBN) and propose to explicitly infer the “user’s type” — a composite of personality and affect variables — in real time. We design the system to reason about the impact of its actions given the user’s current state. Our simulations show that user types can be inferred quickly and that a myopic policy offers considerable benefit by adapting to both different types and changing attitudes. We then develop a more realistic user model, using behavioural data from 45 users to learn model parameters and the topology of our proposed user types. With the new model, we conduct a usability experiment with 4 users and 4 different policies. These experiments, while preliminary, show encouraging results for our adaptive policy.
1. Introduction Online customization has become increasingly important as users are faced with more complex software. For a variety of reasons, software must be tailored to specific individuals and requirements (Hui et al., 2003). One of the difficulties facing developers of adaptive software, interfaces, and help systems is the uncertainty associated with assessing the needs of a specific user. Probabilistic assessment of user needs have proven to offer considerable advantages in this respect (Horvitz et al., 1998; Albrecht et al., 1999; Gorniak & Poole, 2000). Such approaches employ detailed models and often multimodal inputs to infer the user’s goals in the current system environment. Few of these approaches model user features explicitly (though some exceptions exist, e.g., systems in which user features are taken as input (Conati et al., 2002; Jameson et al., 2001; Bohnenberger & Jameson, 2001)). It is rarer still to learn such features. We argue it is more natural to model Appearing in Proceedings of the North East Student Colloquium on Artificial Intelligence (NESCAI), Ithaca, U.S.A., 2006. Copyright 2006 by the author(s)/owner(s).
BOWEN , CEBLY @ CS . UTORONTO . CA
human-computer interaction as a sequential stochastic process where the user moves from state to state. Here, states combine the user’s attitudes and abilities as well as the system’s environment. In this way, our method infers and adapts to the user’s current attitudes, and learns an on-going user profile that may be transferred to other software. In addition, complex tradeoffs must be assessed when deciding if and when an adaptation occurs. For example, deciding to offer help must balance the uncertain assessment as to whether help is needed, the costs of unwanted interruption, the benefits of providing the right type of help, etc. In a number of settings, decision-theoretic models have been adopted for precisely this reason (Horvitz et al., 1998; Albrecht et al., 1999; Horvitz & Apacible, 2003; Bohnenberger & Jameson, 2001; Jameson et al., 2001; Gajos & Weld, 2004; Foster et al., 2002; Boger et al., 2005), allowing a system to make the right decision based on such decision-theoretic tradeoffs. We adopt this general perspective, but tailor our approach so that decisions are influenced by the system’s beliefs about the (generally evolving) user state. We achieve this via online belief state monitoring, which we show to be tractable in the system prototype. In this paper, we develop a generic model of static user type and transient user state that are inferred over time based on observations of user behaviour. We model the dynamics using a dynamic Bayesian network (DBN), and the relative benefits of various types of help (and their interaction with user state) using a generalized additive utility model. The probabilistically estimated user state is then used to determine the expected utility of a specific course of action at any point in time. Section 2 elaborates on this model while Section 3 instantiates it in a text-editing domain. The computational assistance is motivated by users with mild cognitive or physical impairments, but the general principles illustrated in this task carry over to any form of automated software assistance. We discuss simulation results in Section 4, a protocol for learning model parameters in Section 5, and the results of a preliminary user study in Section 6. The qualitative user results are quite encouraging and do suggest that this general decision-theoretic approach to assistance we propose is indeed useful.
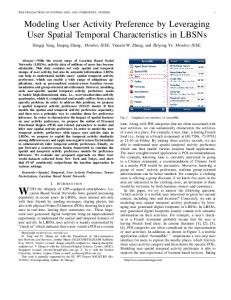
2. A Generic User Model 2.1. User State and User Types Whether a user accepts automated help depends on the quality of the assistance (QUAL) as well as the user’s tendency to work independently (TI) and the amount of attention that is directed toward considering help (CONS). For example, a user who is highly independent may not consider or accept help even if it is perfect. These relationships are illustrated in Figure 1 (left). The degree to which a user might consider help depends on the user’s current attitudes toward the automated agent (frustration, F) and immediate task (neediness, N) and general personality traits while working in a computing setting (distractibility, TD, and independence, TI). These influences are illustrated in Figure 1 (right). Additional factors can be modeled similarly. Variables {F, N, TD, TI} make up the user’s state. As we will see, these are sufficient to predict the probability of specific user behaviours (including accepting help) and how costly or rewarding a user perceives his experience with the system to be. Variables TD and TI are static, reflecting specific user traits that do not change over time.1 In contrast, F and N are transient, reflecting user attitudes that can change, often frequently, during a specific session. How these transient variables evolve can also be modeled by assuming additional static user traits. For this purpose, we propose latent variables TF and TN, representing the user’s tendencies toward frustration and neediness in the application. These influence the stochastic evolution of F and N respectively. We define a user’s type to be the state of all static user traits: {TF, TN, TD, TI}. In our prototype, user variables are discrete, with F, N, TD and TI being tertiary, and TN and TD being binary. F = 1 denotes that the user is not frustrated, F = 2 the user is somewhat frustrated, and F = 3 the user is very frustrated. Other variables are defined similarly. As a result, there are 81 user states and 36 user types. 2.2. Model Structure and Dynamics Since the user state is partially observable, the system must maintain a probability distribution, or belief state BEL(F, N, TD, TI), over user states given all past user behaviour (reflecting the relative likelihood that the user is in a particular state). Given the current belief state, the system reasons about the utility of its actions in its decision making, and updates its beliefs after each user observation. A user’s type (over traits TF, TN, TD, TI), despite having a fixed value for a specific user, is not known a priori to the system, and thus, must also be estimated probabilistically. 1 Naturally, these can change over certain time scales, but we take these to be static at least over the time frame associated with a reasonably small series of application sessions.
Figure 1 forms the structure of our Bayes net. In addition, the availability of automated assistance (HELP) affects when the user can consider help. Our model also incorporates system variables (SYS) and user observations (OBS). User observations are abstracted at a behavioural level, so to be useful for inferring the user’s state. Since these observations are domain-specific, we leave further discussion to Section 3.1. As an initial step, we handcrafted the model parameters but will learn them in Section 5. At each time step, the system observes the user’s action, infers the user’s current state, and decides whether to offer help next time. Naturally, certain variable values may persist over time, or influence the values of other variables at the next point in time. To model these temporal characteristics, we adopt a two-stage DBN (Dean & Kanazawa, 1989), as shown in Figure 2. In this model, user state and type variables have temporal dependencies on their counterparts overtime. This model allows the system to learn the user’s state and type through behavioural observations. We are interested in monitoring the system’s belief over the user’s state given past observations, P r(BELt |OBS1:t ), and predicting the likelihood of a user accepting help given that help is available, the help quality, the system environment, and past evidence: P r(OBSt+1 = acc|HELPt+1 ,QU ALt+1 ,SY St+1 ,OBS1:t ). Both terms are computed using the clique tree algorithm (Lauritzen & Spiegelhalter, 1988) to perform exact inference. 2.3. Reward Function To model a wide range of user types, we must consider multiple conflicting objectives: maintaining a level of independent functioning is desirable, so there is some cost to help; there is benefit of providing the right help when needed or desired, or even for providing partial help if users are in need; there is a higher risk of interrupting a frustrated user and creating added disturbance for someone who is easily distracted; dependent users may view imperfect help as less intrusive than highly independent users. With these considerations, we define a reward and cost function that incorporate user preferences toward automated assistance. The reward function depends on the user state and the quality of the suggestion, R(F, N, TD, TI, QUAL) and is decomposed as: R(F, TI, QUAL) + R(N, TI, QUAL) + R(TD, QUAL). This generalized additive decomposition reflects the assumption that the overall perceived value of help can be determined by independent contributions given the current levels of frustration and neediness (each of these conditioned on degree of independence) and degree of distractibility. The cost of interrupting the user is defined as C(F, N, TD, TI), irrespective of the quality of the automated help. We assume additive independence of the cost function: C(F) + C(N) + C(TD) + C(TI).
3. Text-Editing Assistance We chose a text editor as a test-bed application because it is familiar to many computer users and its functions are common to other communication software such as email and online chat. Furthermore, people with vocabulary and motor disadvantages often find that word processing and word prediction software allow them to concentrate on the quality of writing and give them a sense of authorship (Hasselbring & Glaser, 2000). Within the editor, word prediction is treated as automated help. Unlike traditional word prediction software, our system will not offer suggestions whenever a letter is typed. Rather, it learns the user’s traits and needs and make suggestions only when it believes that the user can benefit from them. This methodology is generalizable to more complex software and tasks. 3.1. Deriving Fully Observable Variables In a typical computing environment, keyboard and mouse events are the source of fully observable variables. We abstract these events into behavioural patterns that correlate with user characteristics. Examples of frustration behaviours include: continuously pressing a key down, jamming into the keyboard; distractibility: browsing due to distraction, pausing; neediness: erasing many characters, browsing for help, pausing; independence: explicitly indicating more or less help, accepting help as a function of quality. Note that browsing and pausing are common to both neediness and distractibility, which is consistent with other proposed models (Horvitz et al., 1998). This ambiguity creates additional uncertainty that the system needs to manage and further suggests the importance of a probabilistic model that account for multiple “causes” for observed behaviour. Other behaviours include responses to automated suggestions, such as accepting help (acc), hovering over the suggestion box (hh), and pausing when suggestions are present (hp). In this design, the system has 2 actions — to offer a set of completion words (POP), or not (¬POP). Together, there are 972 hidden states and 420 observations, yielding a total of 408,240 system states. 3.2. The Joint Expected Savings Model The word prediction component takes as input the previously typed word, wt−1 and the current prefix, wpref ix . As output, it returns a set of suggestions with a quality estimate. This quality value is important because it directly impacts whether a user will accept automated assistance. Moreover, the quality of word predictions vary widely depending on the prediction algorithm used. These factors have a strong influence on the system’s decision whether to offer help as we will see below.
Standard word prediction software makes use of collocation statistics such as n-gram probabilities (Shein et al., 2001). In particular, for n = 2, a bigram probability is defined as P r(wt |wt−1 ). (In a prediction task, wt must be consistent with wpref ix .) Our system adopts a bigram model trained on 40% of the 100 million word British National Corpus (BNC). We further design the word predictions so that the suggestion feature offers completion words that cover a larger probability mass. For example, with wt−1 = “the” and wpref ix = “nu”, a bigram model may offer suggestions “number”, “numbers”, and “nuclear” even though “number” and “numbers” only differ by one letter. Therefore, we propose a similarity metric that captures the expected savings for the user. At a given point in time, there is a set of {c1 , ..., cK } words that are plausible (i.e., non-zero probability) completions given wt−1 and wpref ix . Each ck has an associated bigram probability, pk . To attribute a utility measure to a suggestion, we first define its utility with respect to a true word s defining U (ck |s) to be the number of identical prefix characters less the number of characters erased less the number of characters added to change ck into s (Foster et al., 2002). For example, U(“apples”|“apple”) = 5 − 1 − 0 = +4. Given U (ck |s), we define the expected savings PK of ck as ES(ck ) = i=1 U (ck |ci )pi , where pi is ci ’s bigram probability. P We define the joint expected savings K JES(c1 , ..., cJ ) = i=1 argmaxcj U (cj |ci )pi for a suggestion with J words. The intuition is that, for any true ci , the user will accept the suggestion (among the J) offering maximum savings. In the example with wt−1 = “the” and wpref ix = “nu”, the JES model chooses the suggestions: “number”, “nuclear”, and “nurses”. Unfortunately, when J ≥ 2, the number of comparisons increases exponentially. We propose a greedy implementation for our JES model. First, among K words, choose s1 = argmaxck ES(ck ). With K −1 words left, choose the second best completion w.r.t. s1 ; and so on. This greedy approach results in O(J · K) comparisons. Table 1 compares these algorithms through experiments implemented in Matlab with 3.60G Hz CPU, K = 40, and J = 3. We use bigrams as the baseline comparison by taking the J most probable words, and we show the speed performance of using JES for word prediction, implemented both greedily and by full enumeration. We ran the three algorithms through a text of length 11,718 characters. We see that the average and maximum times for the bigram and greedy techniques are similar, while the enumerative method is too slow for an online task. We kept track of the number of correct predictions made (Exact), the number of predictions that contained a substring of the true word (Substr), and the actual character savings (Util). The JES greedy implementation scores almost as well as the bigram
model on correct predictions, but this is not our main concern. Critically, greedy JES provides much greater utility with respect to character savings. It is also significantly faster than full enumeration but still offers acceptable performance with respect to utility (note that Enum provides optimal suggestions). 3.3. Decision Policy The decision problem faced by the help system is characterized by considerable uncertainty. Obviously, the word a specific user is typing cannot be predicted with certainty, though the language model allows us to quantify this probabilistically and rather precisely. More importantly, whether a user could benefit from the system’s help, or desires such help, cannot be assessed with certainty either. Our model is designed to probabilistically predict whether a user needs or wants help based on past observed user behaviour. We define a policy that models the uncertainty and systematically trades off the conflicting objectives. At each time step, the system takes an action and the user can either accept it, OBS = acc, or not, ¬acc. With these possible outcomes, the expected utility of an action is EU (P OP ) = EU (P OP |acc)P r(acc) + EU (P OP |¬acc)P r(¬acc). If the user accepts the help, the system will “receive a reward” reflecting the net benefit of the suggestion. Of course, the system can only compute the expected reward since the user statePis not fully known. Thus, we define EU (P OP |acc) = F,N,T D,T I R(F, N, T D, T I, QU AL)BEL(F, N, T D, T I). If the user rejects the help, the system will receive a penalty, again, in expectation of the user’s type: P EU (P OP |¬acc) = F,N,T D,T I C(F, N, T D, T I) BEL(F, N, T D, T I). The overall system policy is to take the action with the maximum expected utility (MEU): pop up a suggestion if EU (P OP ) > EU (¬P OP ).
4. Simulation Results We ran text editing simulations and sampled from a simulated user model based on the DBN described in Figure 2. The test text consisted of sentences drawn randomly from 10% of an unseen portion of the BNC. For each user type, we ran 100 simulations with texts about 200 words long. The averaged results show that the system’s beliefs converged to the true type in all 36 cases. The time it took the system to reach convergence varied from about 20 to 150 words. Examples of convergence curves for three different user types (as a function of the number of observations) are shown in Figure 3. Belief state monitoring is currently implemented in Matlab. On average, this computation takes approximately 0.57 second on a Pentium
M, 1.2G Hz CPU, 386 MB RAM processor.2 A system’s overall utility is quantified in terms of the rewards and costs it receives during its interaction with the user. In Section 3.3, we defined implicit reward and cost functions that vary according to the user’s state in Section 2.3. Here, we use them to define the overall utility given the sampled user state and the actual quality of the suggestions, U (F, N, TD, TI, QUAL): 0 R(F, N, TD, TI, QUAL) U= 0 C(F, N, TD, TI)
¬POP POP and OBS = acc POP and OBS = hh,hp POP and OBS o/w
For each type, observed “reward patterns” reflect the system’s adaptivity to the user’s responses — more acceptances encourage more suggestions, and fewer acceptances fewer suggestions. Across user types, the patterns also show that more needy and dependent types receive higher overall utility, while more frustrated, distractible, and independent types receive lower utility. In Figure 4, we show some examples of the patterns of average accumulated rewards that the system receives for different types. For comparison purposes, we conducted experiments with other system policies. The policies we chose for this comparison are: suggest only if the quality is greater than a threshold (THRESH, for QUAL > 3), always make suggestions (ALWAYS), and never make suggestions (NEVER). We refer to our system policy as MEU. Table 2 compares average reward per time step for these different policies with respect to some representative user types. Generally, AL WAYS outperforms the other policies with dependent users who tend to need help, as we see in the first row of the table. However, it does poorly (often extremely) in all other cases. The second row shows that even with dependent users who are easily distracted or frustrated, the users may benefit more from the adaptive policies. In the remaining cases, an independent user, either easily frustrated or easily distracted or neither, benefits most from a system that learns to back off when help is undesired. These cases illustrate that a static policy, such as ALWAYS, or a policy that disregards the user type, such as THRESH, suffers most. Overall, MEU dominates THRESH for 17 of the 36 user types (sometimes quite significantly); for 12 of the types, MEU and THRESH perform comparably (within 0.05 of each other); and for 7 of the types, THRESH performs better than MEU, but only slightly. Although NEVER receives zero rewards in all the cases, it is unable to detect cases when the user in fact needs help, which is a state that could change from time to time. 2 This prototype implementation can be considerably accelerated, so real-time inference is not a concern in this task.
5. Learning Model Parameters We designed controlled experiments that explore different user states and logged corresponding user behaviour. Because user states are not directly accessible and cannot be explicitly elicited at every time step, our experiments collected data in a semi-supervised fashion. 5.1. Data Collection Experiments Since most potential participants can type quickly without help, we designed a procedure that requires the user to type with a Dvorak keyboard. There were 45 users and each participated in 3 conditions. First, artificial delays of 2-5 seconds and sticky keys were introduced into the system at fixed intervals. The second condition presented a mix of audio and visual pop-up distractors at regular intervals. These distractors have a lifetime of 7 seconds and can end earlier if the user closes their residing windows. In the third condition, the text to be typed by the user contains a higher percentage of long words and esoteric vocabulary, as measured using the Fog index (Gunning, 1968). The first two conditions used text with Fog index = 11, while the third used Fog index = 30. To assess the user’s current state, questions to elicit the user’s current F and N values were posed at the end of each clause in all the trials. A postquestionnaire was designed to assess the user’s general attitudes and tendencies under this computing environment so that we could elicit the user’s type. 5.2. Parameter Estimation The learning task at hand is known structure with incomplete data. With 45 participants and 3 sequences of observations each, there are M = 135 training cases. Each sequence on average consists of 845 observations, but ranges from 99 to 3097. Our goal was to learn the prior distributions F0 , N0 , CONS0 , the transition functions Ft , Nt , CONSt , and the observation function, OBSt . We applied standard expectation-maximization (EM) (Dempster et al., 1977; Murphy, 2002). The initial parameters were set randomly. To avoid the sparse data problem and to incorporate prior knowledge, we used the handcrafted parameters in the simulations as biases in the M-step. We report on the training results using different weights in Section 5.3.2. 5.3. Model Comparison 5.3.1. T OPOLOGY
OF
U SERS
The post-questionnaire in our experiments elicited the values of TF, TD, and TI using 19 items. Sample questions asked the user to self-report on a Likert scale whether they felt frustrated with the sticky keys, whether they were distracted by the pop-up animations, or whether imperfect suggestions were selected. Since this questionnaire was
newly designed for this experiment, we carried out factor analysis on the responses to identify possible clusters and underlying factors (Gorsuch, 1983). Due to the small sample size (45), this analysis is a preliminary step in checking for strong correlations only. After applying the Kaiser criterion, scree test, percentage of variance explained, and interpretability criterion, we retained 3 factors with a oneto-one correspondence to our design variables. We used variance maximizing rotation to extract principal components and the resulting factor loadings to identify each item to a cluster. Thereafter, we used the responses to compute the participants’ score for TF, TD, and TI as P l ri i=1 l , where ri is a score and l is the number of items in the factor. By inspection, we partitioned the results into the domain of our model variables, i.e., 2 categories for TF and 3 for TD and TI. For TN, we used typing speed (spd) as the motor attribute and the percentage of unfamiliar vocabulary (vocab) as the cognitive attribute in a user’s neediness level. Let f1 and f2 be the normalized factor loadings for spd and vocab respectively. Then T N = f1 ∗ spd + f2 ∗ vocab. By inspection, we partitioned the results into 2 categories for TN. Based on this procedure, each participant has a user type profile {TF,TN,TD,TI} capturing their general tendencies in a computer setting. We plotted these profiles in Figure 5 to identify the types of users in our pool. As shown, our pool did not cover all the user types — the reason could be due to the small sample size or that some types do not exist. In many cases, we had one or two participants of a type (e.g., {1,2,2,1}). For type {2,2,3,3}, five participants had this profile. This plot suggests that users who are highly independent (TI=3) tend to get frustrated (TF=2) by the system. It also suggests a correlation between dependent and needy users (with TN negatively correlated to TI). 5.3.2. PARAMETER S ETTINGS In training our model, we tried different weightings of the data and biases. The weights we used are: 0% of priors (i.e., data only), 10%, 30%, and 50%. If given enough representative data, we could compare these results using cross validation. However, our data set is very small relative to the state space so we discuss our choices informally. We computed the KL divergence (Kullback & Leibler, 1951) to assess the relative entropy of the learned distribuP tions using KL(P ||Qw ) = x∈X P (x)log QPw(x) (x) , where P is the handcrafted distribution and Qw is the learned one trained with weight w. The maximum KL divergence shows little difference among them: 3.1455 for the prior for CONS, 0.015 for the prior for N, and less than 0.01 for the others. Due to the insignificant differences, we chose to use the learned distributions trained with w = 10%.
6. Usability Experiments We designed an experiment to validate the learned model by comparing user preferences with other system policies. 6.1. Pilot Study We used the editor in Section 5.1 after removing the frustration and distraction inserts. We plugged in the Matlab inference engine from Section 4 and created a Matlab-Java server to the editor client. Users had to type 10 sentences into the editor using a Dvorak keyboard. Sentences were drawn from an unseen test set (Fog index = 15). Each experiment had 4 conditions corresponding to different system policies from Section 4: THRESH, MEU (our system), ALWAYS , and NEVER . Questionnaires were given at the end of each condition. In total, we had 4 participants. 6.2. Results All the users were novice Dvorak typists (speeds between 4-8 wpm), so they all preferred having as much help as possible. Contrary to other findings (Foster et al., 2002), one user commented that the system should provide completions even for short words like “and” and “to”. We believe that if our users varied more in their typing speeds, the results would reveal greater differences in their preferences. Three users preferred ALWAYS to both adaptive strategies, which were in turn preferred to NEVER (i.e., “the more help the better”). This pattern is supported by the average percentage of characters typed using the four policies, as well as the subjective responses to whether a particular policy helped reduced effort and time. The actual time, however, revealed that typing with NEVER was the fastest, followed by the two adaptive strategies, and ALWAYS was the slowest. The fourth user preferred the two static strategies equally over the adaptive ones, because he could not predict exactly when the suggestions would appear. Between the two adaptive strategies, we found that the overhead associated with the Matlab-Java engine3 caused MEU to be ranked lower for two users. They added that if the system were faster, they would have preferred it over THRESH . All four users noted the quality of the suggestions in MEU was notably better than those in THRESH, although in three of the four cases, the percentage of correct suggestions were higher in THRESH. This suggests that the users are perceiving the utility of character savings as part of the quality of a suggestion. Also, the percentage of acceptances were higher in THRESH. This behaviour indicates they are dependent users in our model. Indeed, from plotting the system’s inferred belief states, all four users 3 Unfortunately, an artifact of the implementation created extra threading and file I/O delays; there is no inherent problem in the model itself that causes these delays.
were inferred as dependent (TI = 1) and needy (TN = 2). The number of characters typed using MEU was on average lower than those using THRESH. Finally, about 20% of all the acceptances were partial suggestions, where users accept non-exact words and erase the endings. This indicates that the utility metric used in our language model (cf. Section 3.2) is more helpful than one that only uses a bigram statistic. Despite the overall ranking by the users, which suggests that the adaptive strategies were not as useful as the static strategies, overall we find the results quite encouraging. Apart from a time-delay artifact, and concerns about predictability, user comments suggest that utility-based help is more desirable than suggestions made purely based on probability of acceptance. The task itself was also perhaps more difficult than anticipated, leading to a bias for AL WAYS , which may not be present over time (as skill levels improve) or in less unfamiliar tasks.
7. Discussion and Conclusions We have outlined a general methodology for incorporating user models in automated assistance that encompasses a wide range of user types. We proposed to model user features explicitly so that they can be inferred and learned throughout the course of interaction with the system. Our results show that the model is able to adapt to different (static) user types and to evolving (transient) user state — changes in user attitude — during the course of the interaction. Although our model employs a myopic policy, its adaptive nature allows greater reward to be obtained over a wider range of user types than other fixed policies. In an effort to exploit the sequential nature of humancomputer interaction, we are currently exploring the construction of decision policies using partially observable Markov decision processes (POMDPs). This model enables the system to evaluate the long-term impact of system actions optimally, giving the system the ability to take exploratory actions to directly learn about user types. Informal observations of the participants in our experiments clearly indicated a range of user types and the need to customize system response to account for their preferences. Feedback from several participants pointed to users having different reward (cost) functions, varying in value and structure. In particular, the usability results show that our adaptive policy was unable to always provide suggestions, even after learning that the user type is needy and dependent. This problem is caused by having predefined reward and cost functions that are insensitive to finer, numeric differences among individuals. To truly assess the system’s overall utility, the user’s reward function needs to be assessed or learned in real time.
8. Appendix Need Help With Task Now
Considers Help Frustrated With System Now
Quality of Help
Independence (Work By Self)
User Type {1,2,1,1} {2,1,2,1} {1,1,3,2} {1,1,1,3} {2,1,1,3} {2,1,3,3}
Considers Help
Accept Help
Figure 1. Influence diagrams for a user accepting computational assistance (left) and considering such help (right).
TD
TI
TF
HELP
TN
TD
TI
HELP
QUAL N
1 Type 2 TN−>2
0.9
SYS
NEVER
0 0 0 0 0 0
1 Type 6 TD−>3 TI−>2
0.9
SYS
0.9
0.8
0.8
0.8
0.7
0.7
0.7
OBS
t−1
t
Figure 2. A two time-step DBN user model. Solid arcs indicate intra-temporal links while dashed lines indicate inter-temporal links. Observations are drawn with double lines.
Table 1. Comparison of prediction techniques. The fully enumerative JES model (Enum) outperforms the traditional use of bigrams but is extremely slow. The greedy implementation of the JES model (Greedy) enables good prediction accuracy and utility.
Avg (s) 0.1485 0.1743 0.7110
0.91 0.65 0.31 -2.29 -2.93 -1.43
1
CONS
F OBS
Method Bigrams Greedy Enum
THRESH
0.93 0.62 0.39 -2.15 -1.89 -0.07
QUAL N
CONS
F
MEU
1.64 0.46 -0.64 -10.29 -10.89 -6.04
Max (s) 0.9693 1.0285 3.5008
Exact 3629 3578 3708
Substr 5674 5706 5806
Util 9151 9740 10169
References Albrecht, D., Zukerman, I., & Nicholson, A. (1999). Pre-sending Documents on the WWW: A Comparative Study. Proceedings of the International Joint Conference on Artificial Intelligence (pp. 1274–1279). Stockholm, Sweden. Boger, J., Poupart, P., Hoey, J., Boutilier, C., Fernie, G., & Mihailidis, A. (2005). A decision-theoretic approach to task assistance for persons with dementia. Proceedings of the Nineteenth International Joint Conference on Artificial Intelligence (pp. 1293–1299). Edinburgh, Scotland. Bohnenberger, T., & Jameson, A. (2001). When policies are better than plans: decision-theoretic planning of recommendation sequences. Proceedings of the International Conference on Intelligent User Interfaces (pp. 21– 24). Santa Fe, NM, USA.
0.6
0.5
0.4
Pr(TD=3,TI=3,TN=1,TF=1)
TN
Pr(TD=1,TI=1,TN=1,TF=2)
TF
ALWAYS
Pr(TD=2,TI=1,TN=1,TF=2)
Independence (Work By Self)
Tendency To Be Distracted
Table 2. Comparison of policies using average rewards by user profile {TF,TN,TD,TI}. Static policies, ALWAYS and NEVER, cannot accommodate to different user needs. Policy THRESH can only act as good as the prediction model allows for, while our system’s MEU policy accounts for both prediction accuracy and user needs.
0.6
0.5
0.4
0.5
0.4
0.3
0.3
0.3
0.2
0.2
0.2
0.1
0.1
0.1
0
0
0
500 1000 number of observations
0
500 1000 1500 number of observations
Type 33 TD−>2 TN−>1
0.6
0
0
500 1000 number of observations
Figure 3. Examples of belief state monitoring behaviour. Left: early convergence. Middle: convergence with respect to competing types. Right: slow convergence with considerable uncertainty.
Conati, C., Gertner, A., & VanLehn, K. (2002). Using Bayesian networks to manage uncertainty in student modeling. User Modeling and User-Adaptive Interaction, 12, 371–417. Dean, T., & Kanazawa, K. (1989). A Model for Reasoning about Persistence and Causation. Computational Intelligence, 5, 142–150. Dempster, A., Laird, N., & Rubin, D. (1977). Maximum Likelihood from Incomplete Data via the EM Algorithm. Journal of the Royal Statistical Society, Series B, 1, 1– 38. Foster, G., Langlais, P., & Lapalme, G. (2002). Transtype: Text prediction for translators. Proceedings of the Aossiciation of Computational Linguistics Demonstrations (pp. 93–94). Philadelphia, USA. Gajos, K., & Weld, D. (2004). SUPPLE: automatically generating user interfaces. Proceedings of the International Conference on Intelligent User Interfaces (pp. 93– 100). Madeira, Portugal.
25
Horvitz, E., Breese, J., Heckerman, D., Hovel, D., & Rommelse, K. (1998). The Lumi`ere Project: Bayesian User Modeling for Inferring the Goals and Needs of Software Users. Proceedings of the 14th Conference on Uncertainty in Artificial Intelligence (pp. 256–265). Madison, Wisconsin, USA.
15
15 20
10 10
10
5
0
5
Avg Rewards (Total = 70.63)
Avg Rewards (Total = 277.50)
Avg Rewards (Total = 1125.50)
15
5
0
0
−5
−10 −5 −5 −15 −10
−10 500 1000 1500 number of observations
500 1000 1500 number of observations
−20
500 1000 1500 number of observations
Figure 4. Examples of system behaviour according to inferred user type. Left: a user who welcomes help so the system offers them regularly. Middle: a sporadic user so help is sparse. Right: a user who rejects help so the system learns to back off.
Hui, B., Liaskos, S., & Mylopoulos, J. (2003). Requirements Analysis for Customizable Software: A GoalsSkills- Preferences Framework. Proceedings of the 11th IEEE International Conference on Requirements Engineering (pp. 117–126). Monterey Bay, CA, USA. Jameson, A., Großmann-Hutter, B., March, L., Rummer, R., Bohnenberger, T., & Wittig, F. (2001). When actions have consequences: empirically based decision making for intelligent user interfaces. Knowlege Based Systems, 14, 75–92. Kullback, S., & Leibler, R. (1951). On information and sufficiency. Annals of Mathematical Statistics, 22, 79– 86. Lauritzen, S., & Spiegelhalter, D. (1988). Local computations with probabilities on graphical structures and their application to expert systems. Journal of the Royal Statistical Society, Series B (Methodological), 50, 157–224. Murphy, K. (2002). Dynamic Bayesian Networks: Representation, Inference and Learning. Doctoral dissertation, Department of Computer Science, UC Berkeley, CA, USA.
Figure 5. The topology of our participants. Each box indicates the number of users in that type.
Gorniak, P., & Poole, D. (2000). Building a stochastic dynamic model of application use. Proceedings of the 16th Conference on Uncertainty in Artificial Intelligence (pp. 230–237). Stanford, CA, USA. Gorsuch, R. (1983). Factor analysis. Lawrence Erlbaum.
Hillsdale, NJ:
Gunning, R. (1968). The techniques of clear writing. New York: McGraw-Hill. Hasselbring, T., & Glaser, C. (2000). Use of computer technology to help students with special needs. The Future of Children: Children and Computer Technology, 10, 102– 122. Horvitz, E., & Apacible, J. (2003). Learning and reasoning about interruption. International Conference on Multimodal Interfaces (pp. 20–27). Vancouver, British Columbia, Canada.
Shein, F., Nantais, T., Nishiyama, R., Tam, C., & Marshall, P. (2001). Word cueing for persons with writing difficulties: WordQ. Proceedings of the 16th Annual International Conference on Technology and Persons with Disabilities. Los Angeles, CA, USA.