this event: last year's winner of the New York marathon may win again this year. ... For example, Eke- hammar and Magnusson (1973) found that the length of.
Memory & Cognition
1988, 16 (2), 176-185
Decision time, subjective probability, and task difficulty GEORGE WRIGHT Bristol Polytechnic, Bristol; England and PETER AYTON City of London Polytechnic, London, England This study analyzed the relationships between decision time, subjective probability, and task difficulty in the context of a probability assessment task involving memory search. The results indicate that decision time and subjective probability do not yield identical functions. Also, decision time increases as subjective task difficulty increases. A similar relationship obtains between decision time and a measure of objective task difficulty. These latter two findings are inconsistent with Hogarth's (1975) prediction of a nonmonotonic relationship between decision time and task difficulty. Subjective probabilities are the prime numerical inputs to decision analysis (see Raiffa, 1968), cross-impact analysis (Dalkey, 1972), fault-tree analysis (Fischhoff, Slovic, & Lichtenstein, 1978), and many other management technologies. Often actuarial or relative-frequency-based data are unavailable or believed to be unreliable as direct inputs. In such cases, probability assessments must be provided by judgment. Two commonly used direct methods for probability assessment are point estimates and odds estimates. In decision analysis, a commonly used indirect method is the reference wager technique. Imagine this event: last year's winner of the New York marathon may win again this year. Wager A specifies that if the same person wins, you will win $10,000; otherwise, you win nothing. Under Wager B, you win $10,000 with probability p, and nothing with probability l-p. Wager B may be played by blindly drawing a ball from an urn filled with identically shaped balls, a proportion p of which are white, and l-p are black; you win if a white ball is drawn. There is one restriction on Wager B: the ball will not be drawn until the day of the New York marathon. Thus, under either wager, the consequences for you are identical: you mayor may not win $10,000 on the day of the New York marathon. Depending on whether you prefer Wager A or B, the probability p is varied until you are indifferent between the two wagers. The indifference probability associated with Wager B gives an indirect measurement of the subjective probability for the event in question. (See Wright,
This research was written up with the aid of a British Economic and Social Research Council project grant (C00232037) awarded to the first author. We wish to thank Alastair McClelland for invaluable statistical advice and much ungrudgingly suffered computational labor. Address correspondence to George Wright, Bristol Business School, Bristol Polytechnic, Coldbarbour Lane, Frenchay, Bristol BS16 lQY, England.
Copyright 1988 Psychonomic Society, Inc.
1984, for a fuller discussion of probability assessment methods.) Which of these three methods is the best for the elicitation of subjective probability? The empirical evidence is contradictory. Sometimes the indirect methods are inconsistent with the direct methods, and sometimes they are not. Beach and Phillips (1967) demonstrated consistency between probability estimates inferred from wagers and direct estimates. However, Winkler (1967) showed that statistically naive subjects were inconsistentbetween direct and indirect methods, whereas statisticians were not. Generally, direct odds estimates, perhaps because they have no upper or lower limit, tend to be more extreme than direct probability estimates. If subjective probability estimates derived by different methods for the same event are inconsistent, which method should be taken as the true index of degree of belief? In the present study we explored the relationships between a further indirect measurement of degree of belief, decision time, and direct subjective probability assessments. In an early study, Cohen, Hansel, and Walker (1960) investigated the relationship between decision time and measures of subjective probability. Decision time was defined as the time taken to decide whether a ball could or could not be successfully rolled through a gap that varied in width. Subjective probability can be defined as degree ofbelief in the truth of a proposition, in this case the binary yes or no decision. Cohen et al. related binary decision times to corresponding subjective probabilities. They found that when subjective probability increased from a to 0.5, implying increasing uncertainty between alternatives, decision time increased, whereas when subjective probability increased from 0.5 to 1.0, implying decreasing uncertainty, decision time decreased. Using a task similar to that of Cohen et al., Branthwaite (1974) obtained inverted-V relationships between decision time and 176
DECISION TIME two measures of subjective probability: confidence ratings on a 0% to 100% scale and estimates of number of successes from 10 trials. Branthwaite concluded that although decision time can be taken as an index of subjective probability, its interpretation requires calibration against another measure. This relationship between decision time and confidence is not found for all tasks, however. For example, Ekehammar and Magnusson (1973) found that the length of time required by interviewers to make personality ratings of interviewees on a 5-point scale, after observing an interview, was a monotonic increasing function of the interviewers' degree of confidence in their ratings. Diener and Thompson (1986) observed an inverted-V function between confidence and decision speed when they asked subjects to judge whether a series of coin tosses were produced by a coin biased to produce more heads than tails. However, when an independent group of subjects was asked to judge whether the same sequences were produced by a fair coin, the responses did not follow an inverted-V. Although, as in the biased coin condition, decision times increased between 0% and 50% confidence levels, decision times above 50% (indicating increasing confidence that the series are random) remained relatively flat; there was no significant correlation between decision time and confidence above the 50 % confidence level. Geller and Pitz (1968) examined the relationship between confidence and decision speed in the revision of opinion. They concluded that decision speed may be a better index of the objective probabilities given by Bayes's theorem than are confidence ratings, because the relative changes in decision speed reflected the probabilities calculated by Bayes's theorem more closely than did confidence ratings. They argued that subjects may be unwilling to reduce their explicit confidence ratings after disconfirming information. Independently, Phillips and Wright (1977) proposed a three-stage sequential model of the cognitive processes involved in answering a question. This model was developed in the context of probability responses given to general-knowledge questions. According to the model the cognitive processes involved follow up to three stages: a certainty response (i.e., either a "yes" or "no" answer or a probability estimate of 0 or 1) if the processes stop at Stage 1; a response consequent on a refusal to respond probabilistically (i.e., either a "don't know" answer or a .5 probability estimate) if they stop at Stage 2; and a truly probabilistic response (i.e., a probability estimate other than 0,0.5, or 1 or a corresponding verbal expression) at Stage 3. Wright (1982) used this model to describe task influences on answers given to questions. Phillips and Wright's model implies that .5 probability responses are quicker than any probability response other than 0 or 1. This prediction is in contradiction to the findings reviewed above. Hogarth (1975) presented a model of a nonmonotonic relationship between decision time and task complexity,
177
or difficulty, in the context of choices among multiattributed alternatives. In terms of this model, decision times for very simple tasks that require little information processing are short. Decision times are also short for very difficult or complex tasks for which the decision maker, due to the limits of information processing capacity, abbreviates task processing. According to Hogarth, decision time is longest when the decision maker's maximum information processing ability is reached. Hogarth (1975) speculated that experts would have shorter decision times than novices because experienced decision makers may find familiar tasks easier. Hogarth also argued that if feelings of certainty are positively correlated with expertise, then his model may account for the short decision times previously found for certainty responses. In this study, we investigated the relationship between decision times and subjective probability estimates in the context of probability assessments given to generalknowledge questions. In addition, two measures of difficulty were taken, one objective and one subjective, and the relationship of decision time to these was analyzed.
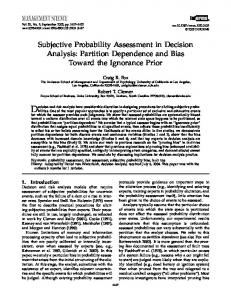
METHOD A total of 37 British students attending Huddersfield Polytechnic voluntarily completed the Probability Assessment Questionnaire (PAQ; detailed in Phillips & Wright, 1977), which contains 75 general-knowledge questions, such as "Which is larger? (a) Black Sea, (b) Caspian Sea." The full set of 75 questions and their two response alternatives are included in the Appendix of this paper. Since we had no a priori hypotheses concerning possible sex differences, this was not tested. The questions were sequentially presented by computer on a television screen. All parts of an individual question appeared simultaneously on the screen. The questions used were all roughly equal in length. Mean question length was 9.32 words, with a standard deviation of 2.52 words. Each subject read detailed instructions concerning the task and ordering of responses before responding to 10 warm-up and familiarization questions that preceded the PAQ. The ordering of questions within the PAQ was randomized for each subject. To be presented with a question, the respondent had to hold down a release button for 3 sec, after which time the question appeared on the screen. The respondent was required to press either an "a" or a "b" button to indicate the correct answer. The time elapsed between the presentation of the question and the "a" or "b" response, which we call binary decision time, was recorded. The respondent was then required to indicate how sure he or she was of the answer by pressing one of seven buttons, which were labeled; 50% sure, 51 %-59% sure, 60%-69% sure, 70%-79% sure, 80%-89% sure, 90%-99% sure, and 100% sure. The members of each set of response buttons were equidistant from the release button. Figure 1 shows the layout of response buttons. The detailed typewritten instructions that explained the task clarified use of the scale for percentage of confidence: It extends from 50 to 100, with 100 meaning absolutely sure to 50 meaning completely unsure. The two extreme buttons in the semicircle of buttons correspond to these assessments. Note that even if you had absolutely no idea what the correct answer was, you would still have a 50% chance of being correct as there are only two alternatives. For most of the questions, your
178
WRIGHT AND AYTON 70-79
A
B
Release Button Figure 1. Layout of response buttons.
reliable index of subjective probability. Branthwaite (1974) measured time to a binary decision-whether or not the subject thought a ball could be rolled through a gap-and then asked for an untimed confidence rating. This rating scale was used because it seemed to be more natural Geller and Pitz (1968) utilized a similar routine in a for college students to express their confidence on a 50% to 100% "bookbag and poker chip" probability revision task. scale than as a probability on a .5 to 1 scale. However, Cohen et al. (1960), using two groups of subThe elapsed time between pressing either the "a" or the "b" jects, measured time to a binary decision with one group button and pressing a confidence button, which we call probability and time to a probability estimate with the other. They estimation time, was also recorded. Alternatives "a" and "b" were each correct about 50% of the found that the time to make a binary yes or no decision time. With this manipulation, we anticipated that any differences was always shorter than the time to make a probability in the time for the respondent's finger to travel from either deci- estimate at corresponding levels of subjective probabilsion button to the confidence buttons would be counterbalanced. ity. Although an inverted-V relationship was obtained beAfter a confidence button had been pressed, the question disaptween binary decision time and subjective probability, no peared from the screen and the respondent was required to indiclear relationship was found between time to make a probcate, on a 7-point scale ranging from extremelyeasy (I) to extremely difficult (7), how difficult he or she had found the question to an- ability estimate and the estimate itself. For these reasons, swer. In this wayan individual's subjective difficulty was mea- our analysis focused on binary decision time rather than sured for each question. When the scale had been marked, the sub- on total decision time. ject was required to hold down the release button to signal the next Table 1 gives the means and standard deviations of the question. binary decision times for the 50 %-100 % range of subObjective difficulty was measured as overall proportion correct. jective probability used in this study. A one-way analysis This measure of task difficulty has been extensively used by Lichtenstein and Fischhoff (1977) and was computed for each question of variance (ANOVA) revealed that binary decision time across the 37 subjects. The mean probability response given by a was not constant across confidence levels [F(6,240)1 = "% sure" will probably lie between the extremes; that is you won't be absolutely sure, nor will you be completely unsure. You would therefore select a button between 50% and 100% to indicate how sure you were.
subject and his/her total number of 100% and 50% responses were also computed.
RESULTS AND DISCUSSION Subjective Probability and Decision Time From the literature it is unclear whether time to a binary decision or time to a probability estimate is the most
Table 1 The Relationship Between Subjective Probability and Binary Decision Time
Binary Decison Time M
SD
Probability Response 50 51-59 60-69 70-79 80-89 90-99 100 11.74 12.55 12.46 11.32 9.83 9.93 7.46 3.83 5.36 5.00 4.50 3.06 4.39 2.69
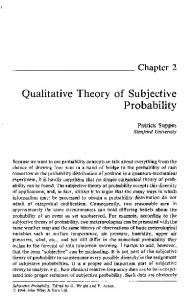
DECISION TIME 6.58, p < .001]. A linear trend test was significant [F(1,240) = 30.29,p < .001], as was a quadratic trend test [F(I,240) = 6.41, p < .01]. By inspection it would appear that the presence of nonlinearity in the data may largely be attributable to the response times for 50% judgments, which were discrepantly low. A post hoc trend analysis (Gaito, 1965; Kirk, 1982) omitting the 50% judgments confirmed this view; the linear component was again significant [F(1,240) = 33.61, p < .05], although there was no longer evidence for a quadratic trend [F(1,240) = 1.10, p > .05]. Unplanned comparisons (Scheffe, 1953) showed that the 50% response times were not significantly shorter than those for the next highest subjective probability category, 51 %-60% [F(1,240) = 0.64, p > .05]. Unplanned comparisons also showed that the binary decision times of 50 % responses were similar to the other responses, omitting 100% and then taken as a group [F(1,240) = 0.57, p > .05], whereas the binary decision times of the 100% responses were shorter than the other responses, taken as a group [F(1,240) = 25.45, p < .05]. The binary decision times for the 100% responses were also shorter than those for 50 % responses [F(1,240) = 19.05, P < .05]. These results were inconsistent with Phillips and Wright's (1977) sequential model of probabilistic processing, in that the decision time of a 50% response was no shorter than that of other probabilistic responses, excluding 100% responses. There was also only moderate support for a strict monotonic decreasing relationship between binary decision time and associated confidence or probability over the half (50%-100%) range of probability. The only unambiguous finding was that 100% responses showed a faster binary decision time than all other probabilistic responses. Supporting this interpretation, the correlation between mean probability response and mean binary decision time across all subjects was found to be near zero (r = - .002, P > .05). However, on analyzing subjects as individuals, 13 gave a significant, negative intercorrelation between binary decision time and probability response, whereas the remaining 24 subjects gave near-zero correlations between these two variables. These results suggest the intriguing possibility that a monotonic decreasing relationship between binary decision time and confidence holds true for some people, whereas no relationship holds for others. Mean comparisons on the measure of reaction time between these two groups of subjects revealed no differences. These results should, of course, be treated with caution due to the small sizes of the subdivided sample, We also considered analyzing in detail the time elapsed between the presentation of a question and the pressing of a confidence button, which we call total decision time, Although a one-way ANOY A revealed that total decison time was not constant across confidence levels [F(6,240) = 4.59, p < .01], the form of the relationship shown in Figure 2 reveals that, as Branthwaite (1974) and Cohen et al. (1960) suggested, binary decision time is the major determinant of variations in total decision time.
179
16
15 Total
14
rJl
"C
decision time
13
e
8 5l
,!:
12
~
Binary
'';::
c: 0
'iii '0
11
decision time
2l
10
9
8
7
iii
60
70
80
i
90
i
100
Subjective probability
Figure 2. Relationship between subjective probability and decision times.
A one-way ANOY A revealed no significant relationship between probability estimation time and subjective probability [F(6,240) = .78, p > .05]. Trend tests were not significant. Mean probability estimation time was 3.52 sec, with a standard deviation of 2.4 sec. These findings imply that either (1) probability estimation involves an equivalent amount of probabilistic processing for each probability response range, or (2) probability estimation time involves only a simple mapping of subjective uncertainty onto a response scale, whereas probabilistic processing occurs in binary decision time, as Branthwaite (1974) and Geller and Pitz (1968) assumed. To generalize, if probabilistic processing does occur in binary decision time, this time index is not a clear-cut substitute for subsequently assessed probability across the half-range of probability utilized in the present experiment. Why is there a difference between the present results and results of earlier research? The difference may be due to the nature of the tasks used. Cohen et al. (1960) and Branthwaite (1974) used a task that involved subjects' making decisions about rolling a ball through a gap that was varied in width. Clearly, the type of information processed by a subject varied little from decision to deci-
180
WRIGHT AND AYTON
sion. Similarly, Geller and Pitz (1968) used a probability revision task in which subjects were shown a sequence of red and white poker chips drawn from one of two bags containing either predominantly red or predominantly white poker chips. The subject's task was to decide, after each draw, which of the two bags was the data generator. In this paradigm, also, the task parameters remained very similar from decision to decision. Once a task is understood by a subject, it may be that binary time is a fairly pure indication of probabilistic processing involved in repetitive decisions. By contrast, the probability assessment task used in the present study consisted of75 questions, each entirely distinct from every other. The only similarity between questions was that each had only two possible answers, one of which was correct. Every question, by its nature, involved long-term memory search, which sometimes might have resulted in a great deal of question-relevant information being recalled, sometimes not. This information then had to be evaluated. Glucksberg and McCloskey (1981) reported evidence that suggests that subjects can make a "don't know" response faster than a true/false judgment when a search of memory reveals no relevant information. This is because, under such circumstances, there is no time-consuming evaluation of evidence. In the present study, the 50% responses plausibly consisted of a proportion of occasions when no evidence was obtained by subjects to delay an arbitrary choice; on other occasions, evidence might have been retrieved, but evaluation revealed it to be equivocal. Such a mixture may explain why the 50% responses were faster than allowable by a model predicting a linear relationship between subjective confidence and decision time (Branthwaite, 1974; Cohen et al., 1960) but not fast enough to fit the threestage model proposed by Phillips and Wright (1977). However, we found no evidence of a bimodal distribution of the binary decision times that resulted in 50% responses. In the present task, average binary decision time was about 11 sec; in Cohen's task, it was about 2.5 sec. In Geller and Pitz's (1968) task the average decision time was not reported, but perhaps we can assume that it was short since "decision times were recorded to the nearest millisecond" (p. 193). If we accept that most real-life decisions are not made repetitively in static environments, we can conclude that in many situations decision time may lack reliability as an indicator of subjective probability.
Table 2 The Relationship Between Subjective Task Difficulty and Binary Decision Time Binary Decision Time M SD
2
34567 7.98 8.62 10.31 10.99 12.04 11.92 12.30 3.47 3.55 3.36 4.27 5.11 4.71 4.51
model, a significant quadratic trend related binary decision time to subjective difficulty [F(1,233) = 4.25, p < .05], but the observed function is clearly not of the form postulated by Hogarth (see Figure 3); with one slight exception, decision time increased with subjective difficulty and the items rated most difficult resulted in the largest decision times. Moreover, there was a significant linear trend [F(l,233) = 37.7, p < .005]. This result suggests that as subjective difficulty increased, binary decision time increased. A one-way ANOVA on the probability estimation times for the seven levels of subjective difficulty was not significant [F(6,233) = 1.3, p > .05]. Thus the obtained curvilinear relationship between decision time and subjectivedifficulty was not as pronounced as our interpretation of Hogarth's (1975) model would predict. The average number of 50% responses and 100% responses given by subjects were 13 and 17, respectively, so it is assumed that the 7-point subjective difficulty scale utilized in the present study covered the very simple to complex range of task difficulty necessary for the valid application of Hogarth's model.
Objective Difficulty and Decision Time To achieve a somewhat comparable analysis of the relationship between overall proportion correct (OPC) and decision time, the 75 items in the probability assessment questionnaire were divided into seven groups of 10 items differing in ope. Five items were discarded from the analysis so that differences in OPC between the seven groups of items were maximized. Table 3 sets out the 13 (/)
"0
c 0
c