Data Science Journal, Volume 7, 23 February 2008
DECODING PATENT INFORMATION USING PATENT MAPS
Chen-Yuan Liu 1* and James Chingyu Yang2 *1
Department of Information Technology and Communication, Tungnan University, No. 152, Sec. 3, PeiShen
Rd., ShenKeng, Taipei, Taiwan Email:
[email protected];
[email protected] 2
Department of Information Management
Email:
[email protected]
ABSTRACT Patent information is a derivative product from the legal patent system. This information, which includes patent applications, patent descriptions, patent gazettes, patent abstracts, and patent data, is prepared in exact compliance with the regulations and specifications of the patent acts. Patent information, different from other published circulating information, is legally well protected. For convenience, this study classifies patent information into bibliographic and numeric data to create a patent map. Keywords: Patent information, Patent map, Bibliographic data, Numerical data
1
INTRODUCTION
We are now in an epoch of the knowledge economy in which innovation and development are essential touchstones. Human industrial economic development, as defined by the World Economic Forum (WEF) (http://en.wikipedia.org/wiki/World_Economic_Forum), is classified into three stages; the agricultural economy stage before the 19th century, the industrial economy in 19th and 20th centuries, and the knowledge economy in the 21st century. The Institute for Management Development
(IMD)
emphasizes
in
its
World
Competitiveness
Yearbook
Report
(http://www.imd.ch/research/publications/wcy/index.cfm) that patent performance is a major evaluation index of a nation’s competitiveness within the knowledge economy. A World Intellectual Property Organization (WIPO) (http://en.wikipedia.org/wiki/World_Intellectual_Property_Organization) report points out that almost 90-95% of the world’s R&D outcomes are covered in patent publications with the remaining 5-10% reported in the technical literature (essays and publications). Utilizing patent information to the best advantage would likely shorten R&D time by 60% and save 40% of R&D costs (Cantwell et al., 1999). Patent technology provides novel and industrial usability, which in the cutthroat competitive market strongly enhances a product’s competitive edge and produce substantial efficiency and benefits. The patent case derived from patent information, after careful search, retrieval, consolidation, and analysis, is presented in a patent map (Asakana, 2001) for 14
Data Science Journal, Volume 7, 23 February 2008
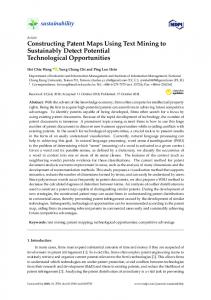
a variety of industries in order to further process analysis and development, tendency forecasts, and patent strategies and finally to plot out the most dominant effective value of each patent technology. This study is dedicated to discussing these key problems and offering feasible recommendations. Patent information can be classified into bibliographic data and numeric data as shown in Figure 1.
Personal data Bibliogr aphic data
Patent information
N um er ical data
assignee inventor
patent classification claim object Technical data prior art problems to be solved solution Others technical features advantageous effect cited document reference decument trademark nationality legal priority Date data
date of application date of publication date of patent application number
Number data
Amount data
laid-open publication number patent number numbers of application numbers of inventor numbers of patent classification item of claim
Figure 1. Diagram of bibliographic and numerical data for patent information
2
BIBLIOGRAPHIC AND NUMERIC DATA
Bibliographic data cover personal data, technical data, and other terms. Numeric data cover date, numeric, and amount data. The bibliographic and numeric data collected and consolidated in this study are processed by means of various analyses as shown in Figure 2 in an attempt to identify the purpose of development and creation in a specific technical field (Archibugi, 1992). ● Quantitative analysis: including patent number statistics, changes, sequences, market shares, and clusters. ● Qualitative analysis: including technical development contents, key technology, trends, and forecasts. ● Relationship analysis: studying the mutual relationship among differing data terms and data relation changes derived from other factors. 15
Data Science Journal, Volume 7, 23 February 2008
Q ual i t at i ve anal ys i s
bibliographic data
Patent information
Rel at i ons hi p anal ys i s
Numeric data Q uant i t at i ve anal ys i s
Figure 2. Diagram of process and analysis of patent information Patent information embraces numerous potentialities. Analysis of patent information secures a clear picture of the development trend of a specific technology and identifies new technical developments and the technical strategies of competitors. It provides vital information for companies planning R&D work on a specific technology. By means of quantitative, qualitative, and relationship analyses on patent information, this study intends to obtain the following potentialities: ● Technical capability index A detailed analysis of patent documents to discover the total number of patents and the competitors who have obtained them along with their technical development direction. This can provide direction and focus for new technology (Fagerberg, 1994). ● Technical development and resource distribution Full discovery and understanding of the technical developments and industrial competition provides a better position for deciding R&D directions and resource distribution (Meyer-Kramer, et al 1998). ● Implied economic value The patent citation is a reliable method to identify all patents in a specific technical field. The greater the number of times a patent has been cited, the higher the implied economic value (David et al., 1992). 16
Data Science Journal, Volume 7, 23 February 2008
● Precise data for strategy planning and technical development Detailed analysis and statistics of patent information giving a clear picture of the present status of a specific technology provide a most advantageous position in planning a R&D direction that avoids the patent cluster problem (Holger, 2001). ● Creative technology Prior technology is an outstanding foundation for improvement and creation of other new technical patents (Narin, 1985).
3
PATENT MAP
The patent map is a diagram showing all related patent information (Grupp et al., 1999). The patent map presented in this study is a visually effective map in which all derived patent information related to a specific patent is collected and thoroughly processed by quantitative, qualitative, and relationship analyses.
3.1
Targets
The major purpose of this patent map is to analyze the following targets as indicated in Figure 3.
In n ve
Technical matrix
to r
si As
Technical independence
gn
ee
Number of patent
Patent Map Degree of referenced patent
at it nt c Pa te
D & R e ty iv i l i at b e l ap a c
io
R
n
Scientific linkage
Technical distribution and direction
Figure 3. Target of patent map
● Technical matrix 17
Data Science Journal, Volume 7, 23 February 2008
This study uses the FI & F-term classification system as a foundation and applies multiple technical viewpoints to prepare the technical matrix. The technical matrix reveals where the technical cluster lies and where technical gaps exist, in support of efforts to achieve patent “design around” and to create new technology (Meyer, 1998). ● Assignee In case the patent owner is a corporate entity, the statistics describe the R&D capability and identify who should be considered as the major competitor in this specific technical field (Trajtenberg, 2002). ● Number of patents From the total number of patents accumulated over the years, it is easy to understand the status of the technical development. More patent applications indicate that a specific technical field has come to maturity. If it is intended to enter such a technical field, efforts will encounter patent infringement or face powerful competition. Patent forecasts tell the life cycle of a specific technology (Carpenter et al., 1980). ● Degree of referenced patents This study counts the total number of cited patents for other companies in order to calculate the degree of referenced patents. The larger the number of cited patents, the more abundant patent knowledge this R&D team possesses and the more powerful its technical creative capability (Hicks et al., 2001). ● Relative R&D capability The relative R&D capability is collectively appraised by the number of patents, number of patents cited, and number of patents self-cited, together with varying weighting systems (Klevorick et al., 1995). ● Technical distribution and direction Counting the number of patent classifications exposes the technical distribution and direction for a specific technical field, which can be used as valuable information in R&D work (Narin et al., 1997). ● Patent citation The patent citation reveals the technical mainstream in a specific technical field and the direction of technical evolution (Robert, 2001). ● Scientific linkage This study utilizes the number of scientific papers referred to in the patent description. The more papers referenced, the stronger the scientific linkage of the patent document to basic science (Faulkner et al., 1994). ● Technical independence This study assumes that technical independence equals the total number of self-cited patents divided by the total number of cited patents. However, the value of the technical independence is never larger than “1.” This implies that the larger the value, the more powerful the R&D strength in the specific technology of a company, resulting in easy continuity and well organized strategy for this patent area (Meyer-Kramer et al., 1998). ● Inventor 18
Data Science Journal, Volume 7, 23 February 2008
The inventor is the producer of the patent. Controlling the inventor strengthens the technical development capability of an organization (Zhu et al., 1999).
4
FLOWCHART AND PREPARATION OF PATENT MAP
Figure 4 shows the preparation flowchart of patent maps, with the right hand displaying various patent maps. As shown in the figure, the following steps for the preparation of a patent map include:
Category of format
I. Data Collection Patent information retrieval Read data
Δ Δ Δ Δ
________________________ Applicator data s equence list Inventor data sequence list Key word sequence lis t Clas sified data sequence list
Δ Δ Δ Δ Δ Δ Δ Δ Δ
__________________________ Number of patent s equence list Date s equence analys is Ratio s equence analys is Dis tribution analys is Relations hip analys is Fres hnes s analys is Life cycle analysis Growth analys is Uniquenes s analys is
Δ Δ Δ Δ Δ Δ
Showed method __________________ Stick block diagram Bending line diagram Circle diagram Band diagram Radar diagram Nes t diagram
Download
II. Data Process Data retrieval
Category of data analysis
Clas s ified code Data input Data process
III. Data Analysis
Data format Data analys is
IV. Analysis Outcome
Displaying
V. Patent Map
19
Data Science Journal, Volume 7, 23 February 2008
Figure 4. Flowchart for patent map Data Collection step: the data to be analyzed are collected from IPC classification, FI & F-term classification, USPC classification, or the combination of key words processed after logic operations. Data Process step: the data are sorted and segregated according to the similarity of their nature to form a data group of a technical target for further analysis. Data Analysis step: the data are systematically analyzed and the outcome expressed as statistical data. Analysis Outcome step: the outcome is displayed in the form of figures to achieve a particular purpose. Patent Map step: a completed vision-effective patent map.
5
CONCLUSION
A patent map is a symmetric integration of patent information. Currently, a tremendous amount of patent information exists. This study provides an easy and concise way to integrate patent information by first dividing the patent information into bibliographic and numeric data, then undertaking thorough quantitative, qualitative, and relationship analyses, and finally presenting the outcome in different visual forms. This method offers an effective mechanism to use over patent information, and the patent map so prepared will open new avenues to develop and identify the newest technology in the most economical way.
5
REFERENCES
Archibugi, D. (1992) Patenting as an indicator of technological innovation: a review. Science and Public Policy, 19, pp 357-368. Asakana, K. (2001) Organizational Tension in International R & D Management: The Care of Japanese Firms. Research Policy, 30, pp 735-757. Cantwell, J.A., & Jane, M. (1999) Technological globalization and innovative centers: the role of corporate technological leadership and locational hierarchy. Research Policy, 28 (23), pp 119-144. Carpenter, M.P., Cooper, M., & Narin, F. (1980) Linkage between basic research and patents. Research Management (23), pp 30-35. David, P.A., Mowery, D., & Steinmuller, E. (1992) Analyzing the economic payoffs from basic research. Economics of Innovation and New technology (2), pp 73-90. Erkal, N. (2005) The decision to patent, cumulative innovation, and optimal policy. International Journal of Industrial Organization 23 (7-8), pp 535-562.
20
Data Science Journal, Volume 7, 23 February 2008
Fagerberg, J. (1994) Technology and international differences in growth rates. Journal of Economic Literature (32), pp 1147-1175.
Faulkner, W., & Senker, J. (1994) Making sense of diversity: public-private sector research linkage in three technologies. Research Policy (23), pp 673-695. Grupp, H., & Schmoch, U. (1999) Patent statistics in the age of globalization: new legal procedures, new analytical methods, new economics interrelations. Research Policy (28), pp 377-396. Hicks, D., Breitzman, T., Olivastro, D., & Hamilton, K. (2001) The changing composition of innovative activity in the US: a portrait based on patent analysis. Research Policy (30), pp 681-703. Holger, E. (2001) Patent applications and subsequent changes of performance: evidence from timeseries cross-section analyses on the firm level. Research Policy, 30, pp 143-157. Klevorick, A.K., Levin, R.C., Nelson, R.R., & Winter, G.S. (1995) On the sources and significance of interindustry differences in technological opportunities. Res. Policy (6), pp 185-205. Meyer, M. (1998) Patent citing scientific literature: is the relationship causal or causal? The IPTS Report, 28, pp 11-18. Meyer-Kramer, F., & Schmoch, U. (1998) Science-based technologies: university-industry interactions in four fields. Research Policy (25), pp 835-851. Narin, F., & Noma, E. (1985) Is technology becoming science? Scientometrics, 7, pp 369-381. Narin, F., Hamilton, K.S., & Olivastro, D. (1997) The increasing linkage between US technology and public science. Research Policy, 26, pp 317-330. Robert, J.W. (2001) Global and domestic utilization of industrial relevant science: patent citation analysis of science-technology interactions and knowledge flows. Research Policy, 30, pp 35-54. Trajtenberg, M. (2002) A Penny for your quotes: patent citations and the value of innovations. In: Jaffe, A. & Trajtenberg, M. (Eds.), Patents, Citations and Innovations. The MIT Press: Cambridge. World Competitiveness Yearbook Report. Retrieved from the World Wide Web on Sep 20, 2007: http://www.imd.ch/research/publications/wcy/index.cfm World Economic Forum. Retrieved from the World Wide Web on Sep 20, 2007: http://en.wikipedia.org/wiki/World_Economic_Forum World Intellectual Property Organization. Retrieved from the World Wide Web on Sep 20, 2007: http://en.wikipedia.org/wiki/World_Intellectual_Property_Organization Zhu, A., Porter, D., Cunningham, S., Carlisie, J., & Nayak, A. (1999) A process for mining science 21
Data Science Journal, Volume 7, 23 February 2008
and technology documents databases, illustrated for the case of knowledge discovery and data mining. Cienc. Inf. 28 (1), pp 7-14.
22