Decoherence in Quantum Magnets: Theory and Experiment S. Takahashi1,2 , I.S. Tupitsyn3 , J. van Tol4 , C.C. Beedle5,⋆ , D. N. Hendrickson5 , P.C.E. Stamp3
arXiv:1107.5057v1 [cond-mat.mes-hall] 25 Jul 2011
1
Department of Chemistry, University of Southern California, Los Angeles, CA 90089, USA 2
Department of Physics and Institute for Terahertz Science and Technology, University of California, Santa Barbara, CA 93106, USA 3
Pacific Institute of Theoretical Physics,
and Department of Physics and Astronomy, University of British Columbia, Vancouver B.C., Canada V6T 1Z1. 4
National High Magnetic Field Laboratory,
Florida State University, Tallahassee, FL 32310, USA 5
Department of Chemistry and Biochemistry,
University of California, San Diego, La Jolla, CA 92093, USA
Decoherence in Nature has become one of the most pressing problems in physics. Many applications, including quantum information processing, depend on understanding it; and fundamental theories going beyond quantum mechanics have been suggested [1–3], where the breakdown of quantum theory appears as an ’intrinsic decoherence’, mimicking environmental decoherence [4]. Such theories cannot be tested until we have a handle on ordinary environmental decoherence processes. Here we show that the theory for insulating electronic spin systems can make accurate predictions for environmental decoherence in molecular-based quantum magnets [5]. Experimental understanding of decoherence in molecular magnets has been limited by short decoherence times, which make coherent spin manipulation extremely difficult [6–9]. Here we reduce the decoherence by applying a strong magnetic field. The theory predicts the contributions to the decoherence from phonons, nuclear spins, and intermolecular dipolar interactions, for a single crystal of the Fe8 molecular magnet. In experiments we find that the decoherence time varies strongly as a function of temperature and magnetic field. The theoretical predictions are fully verified
2 experimentally - there are no other visible decoherence sources. Our investigation suggests that the decoherence time is ultimately limited by nuclear spins, and can be extended up to about 500 microseconds, by optimizing the temperature, magnetic field, and nuclear isotopic concentrations. Environmental decoherence processes are reasonably well understood at the atomic scale [10] (although some poorly understood noisy sources remain [11]). However both quantum information processing, and the fundamental tests noted above, require an understanding of decoherence in larger systems, where experimental decoherence rates are usually much larger than theoretical predictions. This discrepancy is usually attributed to ”extrinsic” sources (external noise, uncontrolled disorder/impurities). We thus need to find systems, with many degrees of freedom, where extrinsic decoherence can be eliminated, and where we have a quantitative understanding of other decoherence sources. Many insulating electronic spin systems are currently the subject of intense experimental interest, notably in semiconductor quantum dots [12], nitrogen-vacancy centres in diamond [13–15], and large spin magnetic molecules [6–8]. In all these systems, three environmental decoherence mechanisms are involved. The electronic spins couple locally to (i) phonons (an oscillator bath [16]); (ii) to large numbers of nuclear spins (a spin bath [17]); and (iii) to each other via dipolar interactions. The long range of dipolar interactions is a major problem: it makes quantum error correction more difficult, is theoretically complicated [18], and is very hard to eliminate experimentally. Two great advantages of the Fe8 system [19] are that (i) the interaction strengths are well known, allowing quantitative predictions; and (ii) it can be prepared with little disorder and few impurities, reducing the danger of extrinsic decoherence. The number of relevant environmental degrees of freedom is very large; depending on isotopic concentrations, there are 1050 − 1054 nuclear spin levels in each molecule; and the system couples to a bulk phonon bath. At low temperature, the electronic spin system behaves as a 2-level quantum bit (qubit), with a splitting depending strongly on an applied transverse field, perpendicular to the easy axis zˆ (See Fig. 1(b)). While almost all previous experiments in the electron spin systems examined the low-field regime, where nuclear spins make the qubit dynamics incoherent, here we go to high transverse fields; by suppressing most nuclear spin decoherence, we unveil the coherent qubit dynamics. Spin echo measurements, using a Hahn echo sequence [20], were carried out on two single
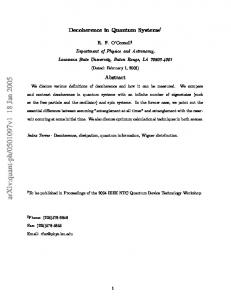
3 crystals of Fe8 molecules (see Fig. 1), with natural isotopic concentrations, using a 240 GHz pulsed ESR spectrometer [21, 22]. Fig. 1 shows Fe8 ESR signals obtained by echo-detected field sweep measurements. The resonant peaks are broadened, with a width ∼ 0.1 T ; the peculiar structure of the peak when H k yˆ comes from dipolar interactions [23].
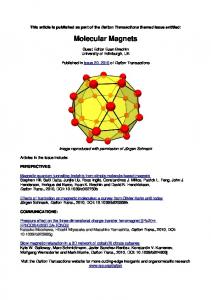
FIG. 1: Typical spin-echo detected field-sweep ESR signals as a function of transverse magnetic field H⊥ recorded in two different samples, at different temperatures and orientations of field. (a) For sample 1, Solid red line - H⊥ ||ˆ y , T = 1.58 K. Dashed blue line - H⊥ ||ˆ x, T = 1.67 K. The sample dimensions are approximately z : x : y = 1000 : 700 : 250 µm3 . The lower left inset (i) shows the low-T spin structure of the Fe8 molecule. The lower right inset (ii) shows the directions of the easy and hard axes of a Fe8 molecule (~a approximately gives the direction of the crystallographic vector a). (b) For sample 2, Solid red line - H⊥ ||ˆ y , T = 1.7 K. Dashed blue line - H⊥ ||ˆ x, T = 1.23 K. The sample dimensions are approximately z : x : y = 900 : 800 : 400 µm3 . The lower inset shows the tunneling splitting, 2∆o , as a function of transverse field at H⊥ ||ˆ y (solid red line) and at H⊥ ||ˆ x (dashed blue line).
These ESR signals may be understood as follows. The qubit splitting 2∆o varies with field as shown in the inset to Fig. 1(b). For fields Hy = 9.5T, Hx = 0, or Hx = 11.3T, Hy = 0, the electronic Hamiltonian for Fe8 [23] predicts 2∆o (H⊥ ) ≈ 11.5 K, equivalent to our spectrometer frequency of 240 GHz, implying we should see resonance peaks at these fields. These predictions are reasonably well satisfied in both samples. The discrepancies, discussed
4 in detail in the supplementary material, come from two sources: (i) sample misorientation (ii) weak high field departures from the model Hamiltonian [24] used to predict the field splitting. In this experiment, the uniform ESR precession mode (a k = 0 magnon) interacts with its surroundings; to understand the decoherence time T2 , and the ESR lineshapes, we need to look at the processes contributing to them. For convenience, we define a dimensionless decoherence rate γφ = ~/∆o T2 . Then the contributions to γφ are as follows (the full quantitative discussion, for the 2 samples in this experiment, is in the supplementary material): (i) In this high field regime, nuclear spins interact locally with each molecular spin, and cause decoherence by a ’motional narrowing’ process in which they attempt to entangle with the fast-moving qubit [18, 25]. The nuclear decoherence rate is γφN = Eo2 /2∆2o , where Eo is the half-width of the Gaussian multiplet of nuclear spin states coupled to the qubit; and the nuclear contribution to the ESR linewidth is just Eo . Now in this experiment, with naturally occurring isotopic concentrations, Eo = 4 × 10⁻⁴ K, whereas ∆o = 5.75 K. Thus γφN ∼ 10−9 is quite negligible, and the nuclear spin contribution ∼ Eo to the linewidth is also very small compared to the main contributions. Isotopic substitution of deuterium for the 120 protons in each molecule will further decrease γφN by a factor 15.2 to γφN ∼ 7 × 10⁻¹¹ . (ii) The form of the local spin-phonon interaction is determined by the system symmetry. At high fields this interaction simplifies, and we find a dimensionless phonon decoherence rate [18] given by γφph = [(FAS ∆2o )/(πρc5s ~3 )] coth(∆o /kT ), where ρ is the sample density, cs the sound velocity, and FAS is the spin part of the spin-phonon matrix element [23]. While γφph depends strongly on field, its temperature dependence is very weak for these experiments. The contribution of this spin-phonon process to the ESR linewidth is negligible. (iii) The intermolecular dipole interaction leads to direct coupling of the k = 0 ESR precession mode to finite momentum magnons; these cause strong decoherence. The k = 0 magnon can in principle decay spontaneously into multiple magnons, or scatter off thermal magnons. The dipolar interaction affects the ESR lineshape and the decoherence rate very differently. The long-range interaction creates a distribution of demagnetization fields around the sample. In the case of highly polarized samples, this is strongly sample-shape dependent, but for annealed samples, it is Gaussian distributed [26, 27]; in both cases it can be calculated numerically. The lineshape then reflects the quite broad distribution of these fields. However, decoherence comes from the magnon decay process described above,
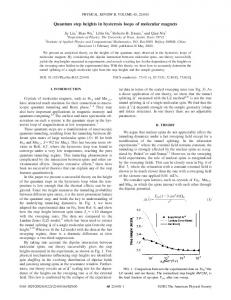
5 and depends only on the phase space available at the resonance field for these processes; it can then be calculated directly from the analytic expression for this process. At the experimental temperatures, the magnon decoherence rate ∼ exp(−2∆o /kB T ), coming almost entirely from thermal magnon scattering. This decoherence contribution increases rapidly with temperature. (iv) Finally, there can be extrinsic contributions from impurities and defects, which typically cause the easy-axis anisotropy parameter D of the Fe8 Hamiltonian to fluctuate around the sample (the ’D-strain’ effect [28, 29]). This will certainly contribute to the ESR linewidth. However these impurities and defects will not contribute to the decoherence rate at all, provided they are static, since then they simply shift the individual qubit energies. Any impurities or defects with significant dynamics will cause extrinsic decoherence, which would then lead to a disagreement between theory and experiment - which is not seen in the present study. The resulting theoretical decoherence times for Fe8 , for each sample, are presented in Fig. 2, together with the results of the measurements. The agreement is very good; we emphasize that apart from the size of the spin-phonon coupling, which is only known approximately, there are no adjustable parameters in these fits. A number of features should be stressed here. First, notice how different the effects of these mechanisms is on decoherence and on the the ESR lineshape. The ESR linewidth and lineshape are completely dominated by static impurity fields and by the spatially varying dipolar fields. However the decoherence is completely dominated, at these high fields, by the phonons and dipolar interaction effects. At lower fields, the nuclear spin decoherence would also be important, but its effect on the ESR linewidth would still be negligible. Note also that whereas the dipolar contributions to the ESR lineshape depends strongly on sample shape, this shape can only affect the dipolar decoherence near the edges of this line. In the middle of the line, where the decoherence is coming from molecules near the centre of the sample, where the field is homogeneous, one expects no dependence of the dipolar decoherence on sample shape. This is also what we found in the experiment. Second, we emphasize how the experiment tests the phonon and dipolar contributions to the decoherence separately - they have very different temperature dependences in the regime covered here, with phonons dominating below ∼ 1.2 K, and magnons dominating at higher temperature. We find agreement between theory and experiment, with no adjustable
6
FIG. 2: The measured and calculated decoherence times T2 in samples 1 and 2, as a function of temperature. (a) Results for H||ˆ y . Thin line with diamonds - experiment in sample 1, Hy = 9.845 T. Thin line with circles - experiment in sample 2, Hy = 9.875 T. Vertical and horizontal bars represent the experimental errors and uncertainty in temperature (∆T = ±0.05 K). Thick solid line - theory including phonon and magnon contributions, Hy = 9.5 T. The inset shows the partial contributions calculated for T2−1 (solid line) from magnons (dashed line) and phonons (long-dashed line), together with the corresponding experimental results for the two samples (diamonds and circles). The scale on the right-hand side of the main figure indicates the decoherence Q-factor Qφ = π/γφ = πT2 ∆o /~; the right-side scale on the inset shows γφ . (b) The same as for (a), but now for H||ˆ x. The experimental curves were measured at Hx = 10.865 T (sample 1) and Hx = 11.953 T (sample 2). The theoretical curves are obtained at Hx = 11.3 T. Again, the scales on the righthand side of the figure and inset indicate the decoherence Q-factor Qφ and γφ respectively, as in (a).
parameters, across nearly an order of magnitude in decoherence rate. Thus all decoherence in the experiment can be accounted for by environmental sources. This implies we have no measurable extrinsic decoherence here, either from disorder or dynamic impurities. Nor do we have evidence for any other contributions, either from ”3rd-party decoherence” [4], or from any of the ”intrinsic decoherence” sources [1] discussed in the literature. The present investigation suggests that T2 in the Fe8 SMM system can be increased significantly by optimizing the temperature and the qubit splitting 2∆o . If we extend the
7
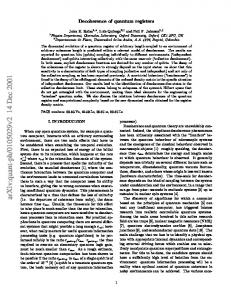
FIG. 3: Calculated contributions to the decoherence coming from the coupling to nuclear spins, phonons, and magnons respectively. (a) shows the 3 individual contributions which sum to give the dimensionless decoherence rate γφ = ~/T2 ∆o , as a function of the qubit splitting in the case H⊥ ||ˆ x. (b) shows the corresponding three contributions to the decoherence time T2 . In each figure: Brown dashed line - nuclear contribution; Solid lines - magnon contributions at different temperatures from 0.1 − 1.6 K; Long dashed lines - phonon contributions, shown for the same temperatures as in the magnon case.
calculations to cover all temperature and field regimes accessible to resonance experiments, we obtain [23] the results shown in Fig. 3. Going to lower temperature allows use of a smaller ESR frequency 2∆o ; both these changes strongly reduce the dipolar and phonon decoherence contributions, giving a large increase in T2 . The optimal decoherence rate comes at the point where the phonon and nuclear spin decoherence contributions cross (for 2∆o ∼ 2 K); provided that kT < 0.13 K, so that the dipolar contribution can be ignored. One then finds that γφ ∼ 1.5 × 10⁻⁷ , corresponding to a decoherence time T2 ∼ 50µsecs. Any further increase in T2 would require isotopic substitution, notably of deuterons in place of the protons; we then find the optimal decoherence time to be T2 ∼ 500µsecs, at 2∆o = 0.8K ≡ 17 GHz, and T = 45 mK. These considerations show the usefulness of this kind of theory in the optimal design of spin qubit systems. If quantum mechanics is to be tested on anything but microscopic scales, it will be essential to continue developing theory and
8 experiment for systems like the present one, where the environmental decoherence processes can be understood quantitatively, and where extrinsic decoherence sources can be largely eliminated.
9 ⋆ Present address: National High Magnetic Field Laboratory, Florida State University, Tallahassee, FL 32310 USA.
[1] ’t Hooft, G. Quantum gravity as a dissipative deterministic system. Class. Quantum Grav. 16, 3263 (1999). [2] Penrose, R. On gravity’s role in quantum state reduction. Gen. Rel. Grav. 28, 581 (1996). [3] Leggett, A. J. Testing the limits of quantum mechanics: motivation, state of play, prospects. J. Phys.: Condens. Mat. 14, R415 (2002). [4] Stamp, P. C. E. The decoherence puzzle. Stud. Hist. Phil. Mod. Phys. 37, 467 (2006). [5] Gatteschi, D. Sessoli, R. & Villain, J. Molecular Nanomagnets (Oxford University Press, New York, 2006). [6] Takahashi, S. et al. Coherent manipulation and decoherence of S = 10 single-molecule magnets. Phys. Rev. Lett. 102, 087603 (2009). [7] Bertaina, S. et al. Quantum oscillations in a molecular magnet. Nature 453, 203 (2008). [8] Schlegel, C. et al. Direct observation of quantum coherence in single-molecule magnets. Phys. Rev. Lett. 101, 147203 (2009). [9] Ardavan, A. et al. Will spin-relaxation times in molecular magnets permit quantum information processing? Phys. Rev. Lett. 98, 057201 (2007). [10] Liebfried, D. Blatt, R. Monroe, C. & Wineland, D. Quantum dynamics of single trapped ions. Rev. Mod. Phys. 75, 281 (2003). [11] Labaziewicz, J. et al. Temperature dependence of electric field noise above gold surfaces. Phys. Rev, Lett. 101, 180602 (2008). [12] Hanson, R. et al. Spins in few-electron quantum dots. Rev. Mod. Phys. 79, 1217 (2007). [13] Takahashi, S. et al. Quenching spin decoherence in diamond through spin bath polarization. Phys. Rev. Lett. 101, 047601 (2008). [14] Childress, L. et al. Coherent dynamics of coupled electron and nuclear spin qubits in diamond. Science 314, 281 (2006). [15] Hanson, R. et al. Coherent dynamics of a single spin interacting with an adjustable spin bath. Science 320, 352 (2008). [16] Leggett, A. J. et al. Dynamics of the dissipative two-state system. Rev. Mod. Phys. 59, 1
10 (1987). [17] Prokof’ev, N. V. & Stamp, P. C. E. Theory of the spin bath. Rep. Prog. Phys. 63, 669 (2000). [18] Morello, A. Stamp, P. C. E. & Tupitsyn, I. S. Pairwise decoherence in coupled spin qubit networks. Phys. Rev. Lett. 97, 207206 (2006). [19] Wieghardt, K. Pohl, K. Jibril, I. & Huttner, G. Hydrolysis products of the monomeric amine complex (C6 H15 N3 )FeCl3 :
the structure of the octameric iron(III) cation of
[(C6 H15 N3 )6 Fe8 (µ3 −O)2 (µ2 −OH)12 ]Br7 · 8H2 O. Angew. Chem. Int. Ed. Engl. 23, 77 (1984). [20] Hahn, E. L. Spin echoes. Phys. Rev. 80, 580 (1950). [21] van Tol, J. Brunel, L. C. & Wylde, R. J. A quasioptical transient electron spin resonance spectrometer operating at 120 and 240 GHz. Rev. Sci. Instrum. 76, 074101 (2005). [22] Morley, G. W. Brunel, L. C. & van Tol, J. A multifrequency high-field pulsed electron paramagnetic resonance/electron-nuclear double resonance spectrometer. Rev. Sci. Instrum. 79, 064703 (2008). [23] See supplementary material. [24] Barra,
A.
L.
Gatteschi,
D.
&
Sessoli,
R.
High-frequency
EPR
spectra
of
[Fe8 O2 (OH)12 (tacn)6 ]Br8 : a critical appraisal of the barrier for the reorientation of the magnetization in single-molecule magnets. Chem. Eur. J. 6, 1608 (2000). [25] Stamp, P. C. E. & Tupitsyn, I. S. Coherence window in the dynamics of quantum nanomagnets. Phys. Rev. B 69, 014401 (2004) [26] Cuccoli, A. et al., Dipolar interaction and incoherent quantum tunneling: a monte carlo study of magnetic relaxation. Euro. Phys J. B. 12, 39 (1999) [27] Tupitsyn, I. S. Stamp, P. C. E. & Prokofev, N. V. Hole digging in ensembles of tunneling molecular magnets. Phys. Rev. B 69, 132406 (2004). [28] Hill, S. et al. D-strain, g-strain, and dipolar interactions in the Fe8 and Mn12 single molecule magnets: an EPR lineshape analysis. Int. J. of Mod. Phys. B 16, 3326 (2002). [29] Park, K. et al. Effects of D-strain, g-strain, and dipolar interactions on EPR linewidths of the molecular magnets Fe8 and Mn12 . Phys. Rev. B 65, 014426 (2002).
11 Supplementary information Supplemental
material
is
linked
to
the
online
version
of
the
paper
at
www.nature.com/nature. Acknowledgments This work was supported by the NSF (DMR-0520481, DMR-0703925), and the Keck Foundation (S.T. and J.v.T.); and by NSERC, CIFAR, PITP, the John E. Fetzer Memorial Trust (grant D21-C62), and the Center for Philosophy and the Natural Sciences, California State University, Sacramento (I.T. and P.S.). The National High Magnetic Field Laboratory is supported by the NSF Cooperative Agreement DMR-0654118, by the State of Florida, and by the DOE. Author contributions S.T. I.T. and P.S. contributed to writing of the manuscript. S.T. I.T. and P.S. conceived the ESR experiments. The ESR measurement were carried out by S.T. and J.v.T. The theoretical work has been done by I.T. and P.S. C.B and D.H. synthesized Fe8 crystals and performed X-ray diffraction measurements. Author Information Reprints and permissions information is available at www.nature.com/reprints. The authors declare no competing financial interests. Readers are welcome to comment on the online version of this article at www.nature.com/nature. Correspondence and requests for materials should be addressed to S.T. (
[email protected]) or P.S. (
[email protected]).
SUPPORTING ONLINE MATERIAL
arXiv:1107.5057v1 [cond-mat.mes-hall] 25 Jul 2011
Decoherence in Quantum Magnets: Methods S. Takahashi, I. S. Tupitsyn, J. van Tol, C. C. Beedle, D. N. Hendrickson and P. C. E. Stamp
Here we provide details of the methods used in our high-frequency pulsed ESR experiments, and in the theoretical analysis of environmental decoherence contributions. (i) EXPERIMENTAL METHODS: We investigated two slab-shaped single crystals of Fe8 magnetic molecules (SMMs). These Fe8 crystals were synthesized using the original method developed by Weighardt et al. [1]. ESR measurements were carried out using a 240 GHz continuous-wave (cw)/pulsed ESR setup built at the National High Magnetic Field Laboratory (NHMFL), in Tallahassee FL, USA [2, 3]. The system consists of a 40 mW cw solid-state source at 240 GHz, quasioptical ESR bridge, superheterodyne detection system and 12.5 tesla superconducting magnet, and employs a 4 He flow cryostat to vary sample temperature down to ∼ 1.2 K. For control of the sample orientation relative to the external magnetic fields, the sample crystal was placed in a rotating sample holder consisting of a teflon rotating rod and nonmagnetic gears. The sample angle can be changed by rotating a control rod connecting from room temperature to the gear in the sample holder [2]. To measure the spin decoherence time T2 , we employed a Hahn echo sequence (π/2 − τ − π − τ − echo) where the delay time τ is varied [4]. π/2 and π are square pulses whose width (typically 200 ns to 300 ns long) was optimized for the maximum echo signals. This width corresponds to approximately 0.5 Gauss of the excitation bandwidth, much smaller than the ESR linewidth of the lowest lying Fe8 transition. The decoherence time T2 was extracted from the decay rate of the echo area, which was well fit by a single exponential exp(−2τ /T2 ). The temperature dependence of T2 at frequency of 240 GHz was then measured between 1.2− 2K, with the external magnetic field aligned either along the hard (H||ˆ x) or intermediate (H||ˆ y) crystal axes. Above 2 K, T2 became too short to give spin echoes within the time resolution of the pulsed ESR spectrometer. For the angle-dependent ESR measurement, the sample crystal was carefully mounted in a rotating sample holder, allowing us to vary the direction of the external magnetic field
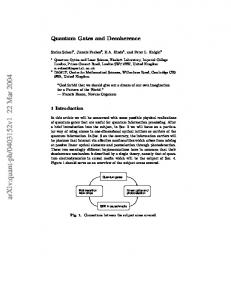
2 along the xy-plane. The orientation of the crystallographic axes was initially identified through X-ray diffraction measurements, and then the low-T determination of the actual sample orientation was made using cw ESR measurements at 20 K. To accurately determine the sample orientation, we rotated the sample crystal through 360o relative to the direction of the magnetic fields, and fit the measured resonance fields to the calculated values as a function of angle with the Fe8 spin Hamiltonian given in eqtn. (1) below. We show here an example of such a fit, for sample 2 (see Fig. 1). As a result of these fits, we determined that the direction of the external magnetic field in the sample 1 was tilted by < 14o from the xy-plane, whereas that in sample 2 was tilted by only < 3o .
FIG. 1: Plot of the resonance fields measured for Sample 2 as a function of rotation angle of the sample holder. The dashed red line shows the values calculated from the Fe8 spin Hamiltonian in eqtn. (1), described herein.
(ii) THEORETICAL METHODS: The Fe8 molecule has eight Fe3+ ions sj , of spin 5/2 each, with an electronic spin Hilbert space of dimension 68 ∼ 1.7 × 10⁶ . However below about 10 K these are locked by superexchange interactions into a ’giant spin’ array, of total spin |S| = 10. This has the effective Hamiltonian [5] H(S) = −DSz2 + ESx2 + K4⊥ (S+4 + S−4 ) − γS · H⊥ ,
(1)
where the easy/hard axes are along zˆ and xˆ respectively. The Zeeman coupling γ = ge µB µ0 , where ge ≈ 2 and the transverse field H⊥ is perpendicular to zˆ. The parameters of (1) were
3 tuned [6] to accurately reproduce both the experimental value of the tunneling gap 2∆o (H⊥ ) and its period of oscillations with field [7], and are D/kB = 0.23 K, E/kB = 0.094 K, and K4⊥ /kB = −3.28 × 10⁻⁵ K. The Hamiltonian (1) is easily diagonalized numerically. For all fields used in this experiment, a low-energy doublet clearly separates off from the higher-energy states - this is the electronic ’qubit’. The energy splitting of this doublet was shown in Fig. 1(b) of the main text. We write these 2 states as |Si, |Ai, where the lowest energy state is |Si. Let us define linear combinations |Z± i = (|Si ± |Ai)/21/2. In the experiment, almost all molecular spins are in the low-T |Si state. A π/2 microwave pulse then sends these into the |Z+ i state, thereby initiating spin oscillations between |Z± i at a frequency 2∆o /~ (which may then resonate with the applied ESR signal at frequency ΩR = 240 GHz, provided 2∆o /~ = ΩR ). If we ignore any field inhomogeneity (which, because of dipolar interactions, does exist in the sample - see below), these spin oscillations are equivalent to a uniform spin precession around the sample along the field directions, i.e., to a k = 0 magnon. A calculation of environmental decoherence is then equivalent to a calculation of the coupling of this magnon to the various environmental modes. Decoherence Rates: We now calculate the three different sources of environmental decoherence in the experiment (and their rather different effect on the ESR linewidth). Note that the results of these calculations are shown graphically in Fig. 3 of the main text. Nuclear Spins: In this high field regime, the dimensionless nuclear decoherence rate reduces to γφN = Eo2 /2∆2o , where Eo is the half-width of the Gaussian multiplet of nuclear spin states coupled to the qubit states [6]. To evaluate Eo one requires all the hyperfine couplings. These were previously determined for the Fe8 system, both in low-field experiments [8, 9] and theoretically [6]. We extend the theory to high fields by defining the vector ω k , for the k-th nuclear spin in the molecule, with components ωkα =
1 X jk α S A (hs i − hsαj iA ) 2 j αβ j
(2)
where hsαj iS,A is the expectation value of the individual spin sj , when the molecule is in the |Si, |Ai states. Then 2ω k measures the difference ω Sk − ω A k between the hyperfine fields acting on this nuclear spin when the molecule is in the |Si, |Ai states. The nuclear multiplet
4 halfwidth is then Eo2 =
X Ik + 1 k
The hyperfine couplings
{Ajk αβ }
3Ik
(ωk Ik )2
(3)
themselves are essentially independent of field, but the field-
dependence of the qubit states leads to a strong decrease of Eo at high fields. This is easily found numerically: for these calculations we assumed natural isotopic concentrations, and found Eo = 4 × 10⁻⁴ K for the fields used in this experiment. This gives a quite negligible contribution to the decoherence rate. It also gives a very small contribution Eo to the ESR linewidth. If we do selective isotopic substitution to remove nuclear spins, we can further decrease the nuclear contribution to the decoherence rate. Thus substitution of deuterium for protons decreases Eo from the above value, computed assuming protons at the 120 different Hydrogen sites, by a factor 3.9, further decreasing the decoherence rate by a factor 15.2. Phonons: The large tunneling gap means that decoherence from low-energy acoustic phonons is important. We define ǫαβ = (∂β uα + ∂α uβ )/2 and ωαβ = (∂β uα − ∂α uβ )/2, the symmetric and antisymmetric parts of the strain tensor, written in terms of the lattice displacement u(r) for a molecule at position r. For Fe8 crystals, the mass density ρ = 1920kgm−3 for the natural isotopic concentrations used here, and the unit cell volume is 3
Vo = 1956˚ A . We assume a phonon spectrum ωq = qcs , with the sound velocity cs = (kB ΘD /~)(Vo /6π 2 )1/3 assumed the same for transverse and longitudinal phonons; here ΘD = 33 K is the Debye temperature [6].
P ˆ S ˆ ph We write the spin-phonon coupling as VˆS,ph = i ηi O i Oi , where the subscript i labels
different irreducible group representations for the lattice and molecular symmetry groups, ˆS, O ˆ ph operate separately on the spin and phonon degrees of freedom and the operators O i i [10]. At high fields the dominant terms in VˆS,ph can be written as (X) VˆS,ph → (η1 ǫxz + η2 ωxz ){Sˆx , Sˆz }
+(η3 ǫxy + η4 ωxy ){Sˆx , Sˆy }
(4)
(Y ) VˆS,ph → (η1 ǫyz + η2 ωyz ){Sˆy , Sˆz }
+(η3 ǫxy + η4 ωxy ){Sˆx , Sˆy }
(5)
where the indices (X), (Y ) indicate that H is parallel to xˆ or to yˆ respectively and the ˆ B} ˆ = AˆB ˆ +B ˆ Aˆ are evaluated at the fields used here. The coupling anticommutators {A,
5 constants ηj can only be determined accurately from experiment. However, simple estimations [11–13] shows that they are ∼ D/2, where D is the main easy-axis anisotropy energy. Since the phonons themselves are only weakly affected by the field, all field effects come from the field dependence of the qubit states and ∆o (H⊥ ). The spin-phonon decoherence rate is then calculated using standard methods [14, 15] to give ∆3o −1 coth(∆o /kB T ) τph = FAS πρc5s ~4 Z dΩ X ˆ S |Si|2 FAS = | ηi fi (Ω)hA|O i π i
(6) (7)
where dΩ is an infinitesimal solid angle in real space, and the fi (Ω) are rather complicated angular functions coming from the tensors ǫαβ and ωαβ , which are independent of q. If we now go to the high field regime, and assume that all the couplings are equal to D/2, we find (X)
D2 (|hA|{Sˆx, Sˆz }|Si|2 + |hA|{Sˆx, Sˆy }|Si|2 ) 3 D2 (|hA|{Sˆy , Sˆz }|Si|2 + |hA|{Sˆx, Sˆy }|Si|2 ) ≈ 3
FAS ≈ (Y )
FAS
(8) (9)
These functions are evaluated numerically, by exact diagonalisation; the results are shown here in Fig. 2. 200
FAS (spin-phonon)
H⊥=HX H⊥=HY
100
HZ=0
0
0
5
10
15
H⊥(T)
FIG. 2: Plots of FAS defined in Eqs. (8),(9), as a function of the transverse applied field. The results are shown for H⊥ along x ˆ (red) and along yˆ (blue).
In general the phonon decoherence rate depends on temperature, but in our experiments,
6 kB T ≪ 2∆o , and so the rate has already reached its low-T saturation value; this is seen for both field orientations in Fig. 2 of the main text. −1 We note immediately that the contribution ~τph to the ESR linewidth will be completely
negligible. Dipolar Interactions: The dipole field of each molecular spin leads to a global sample shape-dependent demagnetization field Hdm (r), which varies around the sample. Thus the qubit energy splitting 2∆o (H(r)) varies around the sample with the in-plane component of the total local field H(r) = Ho + Hdm (r). Only in the close vicinity of ’resonant surfaces’ in the sample, where 2∆o (H(r)) = ~ΩR , can molecules be flipped by the applied ESR signal. The strength of the ESR signal at a given applied field Ho is then directly proportional to the number of molecules in this surface, i.e., to the density of states Z N (Ho ) = d3 r δ(~ΩR − 2∆o (Ho + Hdm (r))
(10)
The lineshape will then be complicated, with multiple peaks coming from the van Hove singularities arising each time a new resonant surface moves in from the sample boundary, as one varies the external field. By further varying this field, we sweep the resonant surfaces through the sample. The edges of the lineshape correspond to fields where the resonant surfaces are small and near the sample boundaries, in regions where the demagnetisation field is varying rapidly with r. In the middle of the ESR line, the resonant surfaces occupy a large region near the centre of the sample, where the demagnetization field is relatively uniform in space; there are then a large number of molecules in resonance. In this latter case, the approximation that the tipping pulse corresponds to a uniform (in space) precession mode, i.e., a k = 0 magnon, is a very good one. We therefore compare theoretical calculations of the decoherence with T2 measurements taken at the centre of the line, where the signal is strongest anyway. In the present experiment, where kB T ≪ 2∆o , only 4-magnon processes where the k = 0 mode scatters off a thermally excited magnon, with two magnon final states, contribute to the decoherence; decay into three magnons is blocked by kinematic restrictions. It then follows that the dipole contribution to the dimensionless decoherence rate γφ is γφm =
2π X (4) 2 |Γ ′ | F [nq ] δ(ω0 + ωq − ωq′ − ωq−q′ ) ~∆o qq′ qq
(11)
7 (4)
where F [nq ] is the statistical distribution function for the magnons, Γqq′ is the 4-magnon scattering amplitude, and the magnon dispersion ωq depends on the applied field and on the sample geometry [15]. We calculated numerically the dipolar field distributions and the magnon dispersion and decoherence rates for samples 1 and 2, approximating them as parallelipipeds with the measured aspect ratios. The Fe8 molecules, described by the full 8-spins si = 5/2 model with the known positions of each Fe ion [16], were organized in triclinic arrays in the numerical calculation of the magnon decoherence rates, with angles and crystallographic axes as in [1] and directions of the anisotropy axes as in [5]. We found the width of the dipolar distributions in both samples to be ∼ 0.1 T which is comparable with the width of the experimental ESR peaks. The magnon contribution to the decoherence rate for this process is shown in Figs. 2 and 3 of the main text. Finally, as noted in the main text, the sample certainly contains some static disorder, coming from dislocations and defects, as well as from other lattice strains (which can be induced by a strong field). The disorder will also cause variation of the Fe8 Hamiltonian parameters between molecules [17, 18]. The spin energy levels of each molecule are thus in general shifted, by different amounts, by this disorder. This will certainly influence the sample linewidth and lineshape, and thus give an inhomogeneous broadening contribution to T2 . However, provided this disorder can be considered to be static, it cannot give any contribution to the decoherence, which is completely unaffected by static level shifts. We also note that the experiment is designed so that any inhomogeneous broadening is canceled by the rephasing π-pulse in the Hahn echo sequence. However, any dynamic local degrees of freedom, such as ’loose spins’ (i.e., spin impurities with energy levels in the energy range below ∼ 10 K), or mobile charge defects, can cause decoherence. No evidence is seen in the experiments for such an extrinsic contribution.
[1] Wieghardt, K. Pohl, K. Jibril, I. & Huttner, G. Hydrolysis products of the monomeric amine complex (C6 H15 N3 )FeCl3 :
the structure of the octameric iron(III) cation of
[(C6 H15 N3 )6 Fe8 (µ3 −O)2 (µ2 −OH)12 ]Br7 · 8H2 O. Angew. Chem. Int. Ed. Engl. 23, 77 (1984). [2] van Tol, J. Brunel, L. C. & Wylde, R. J. A quasioptical transient electron spin resonance spectrometer operating at 120 and 240 GHz. Rev. Sci. Instrum. 76, 074101 (2005).
8 [3] Morley, G. W. Brunel, L. C. & van Tol, J. A multifrequency high-field pulsed electron paramagnetic resonance/electron-nuclear double resonance spectrometer. Rev. Sci. Instrum. 79, 064703 (2008). [4] Hahn, E. L. Spin echoes. Phys. Rev. 80, 580 (1950). [5] Barra,
A.
L.
Gatteschi,
D.
&
Sessoli,
R.
High-frequency
EPR
spectra
of
[Fe8 O2 (OH)12 (tacn)6 ]Br8 : a critical appraisal of the barrier for the reorientation of the magnetization in single-molecule magnets. Chem. Eur. J. 6, 1608 (2000). [6] Stamp, P. C. E. & Tupitsyn, I. S. Coherence window in the dynamics of quantum nanomagnets. Phys. Rev. B 69, 014401 (2004) [7] Wernsdorfer, W. & Sessoli, R. Quantum phase interference and parity effects in magnetic molecular clusters. Science 284, 133 (1999). [8] Wernsdorfer, W. et al. Effects of nuclear spins on the quantum relaxation of the magnetization for the molecular nanomagnet Fe8 . Phys. Rev. Lett. 84, 2965 (2000); [9] Sessoli, R. et al. Isotopic effect on the quantum tunneling of the magnetization of molecular nanomagnets. J. Mag. Mag. Mater. 226-230, 1954 (2001) [10] Callen, E. & Callen, H. Magnetostriction, forced magnetostriction, and anomalous thermal expansion in ferromagnets. Phys. Rev. 139, A455 (1965). [11] Melcher, R. L. Experimental verification of first-order rotational effects in the magnetoelastic properties of an antiferromagnet. Phys. Rev. Lett. 25, 1201 (1970). [12] Melcher, R. L. Rotationally invariant theory of spin-phonon interactions in paramagnets. Phys. Rev. Lett. 28, 165 (1972). [13] Dohm, V. & Fulde, P. Magnetoelastic interaction in rare earth systems. Z. Phys. B 21, 369 (1975). [14] Hartmann-Boutron,F. Politi, P. & Villain, V. Tunneling and magnetic relaxation in mesoscopic molecules. Int. J. Mod. Phys. B 10, 2577 (1996). [15] Morello, A. Stamp, P. C. E. & Tupitsyn, I. S. Pairwise decoherence in coupled spin qubit networks. Phys. Rev. Lett. 97, 207206 (2006). [16] Cambridge database: www.ccdc.cam.ac.uk. [17] Hill, S. et al. D-strain, g-strain, and dipolar interactions in the Fe8 and Mn12 single molecule magnets: an EPR lineshape analysis. Int. J. of Mod. Phys. B 16, 3326 (2002). [18] Park, K. et al. Effects of D-strain, g-strain, and dipolar interactions on EPR linewidths of the
9 molecular magnets Fe8 and Mn12 . Phys. Rev. B 65, 014426 (2002).