Decomposing Large Networks: An Approach Based on the MCA based Community Detection La decomposizione di networks di grosse dimensioni: un approccio basato sull’identificazione di comunit´a via MCA Carlo Drago
Abstract The emergence of the big data has called for considering new methodologies to analyze big networks. In these particular contexts there are many cases in which it is important to take into account not only the single node but groups of nodes which can have the same or similar functions on a defined network. On large networks it is important to represent them in a meaningful way. Interval data seems an adequate representation which can be used to represent these networks. The specific contribution of this work it is to show the way in which is possible to rank the different structural characteristics of the different robust communities represented by the network. The rank applied to the structural characteristics allows the understanding also of the relevant core of the network Abstract L’emergere dei big data ha richiesto di considerare nuove metodologie per analizzare le grandi reti. In questi contesti ci sono molti casi in cui e` importante prendere in considerazione non solo il singolo nodo ma gruppi di nodi che possono avere le stesse funzioni o funzioni simili su una rete definita. I dati ad intervallo sembrano una rappresentazione adeguata che pu`o essere utilizzata per rappresentare queste reti. Il contributo specifico di questo lavoro e` mostrare il modo in cui sia possibile classificare le diverse caratteristiche strutturali delle diverse comunit`a robuste rappresentate dalla rete. Il rango applicato alle caratteristiche strutturali consente di comprendere il nucleo principale della rete Key words: Community Detection, Interval Data, MCA, Network Analysis, Symbolic Data
Carlo Drago University of Rome ”Niccolo
[email protected]
Cusano”,
Via
Don
Carlo
Gnocchi
3,
e-mail:
1
2
Carlo Drago
1 Big Data and Networks The emergence of the big data has demanded the consideration of new methodologies to analyze big networks. In particular the growth in size of the social networks has called for a new relevant role for the different platforms which have given various new services. At the same time the data related to the different attributes on the network is growing exponentially. In this way it is usually difficult to handle and analyze networks and it is necessary to define an approach which can be useful to deal with these types of networks. Furthermore in these contexts there are many cases in which it is important to take into account not only the single node but also the group of nodes which can have the same functions on a defined network. One strategy is to decompose the networks and to represent it in a manageable way [14]. The different groups of nodes need to be considered as kinds of compartments on the networks and they can have a similar function or role on the networks as a whole [6]. It could be important to consider the groups of the nodes as a relevant entity and it is relevant to analyze the different relationships between the different entities. The challenge is to represent the network by considering their more relevant parts. The approach proposed considers symbolic data [1]. So the proposal is to consider a specific representation for the community or the specific aggregated data and then consider the community also as an entire entity.
2 The Analysis of the Community Structure The different communities are groups of nodes which tend to be strongly connected to each other and they tend to be loosely connected with nodes of other communities [6]. The identification of the community structure is very important in order to detect groups of nodes which can be part of the same functional structure of the same network. The communities are the relevant elements on the construction of a network. In this sense we consider each different network as based on the communities which can be identified on the network. The first step is to identify the different communities which can be considered inside the network and then represent them. There are various different methodologies with the aim of detecting the different communities inside a network [9]. Each different method can have a different performance [11, 10]. In particular different algorithms can have different biases for the separate network structures and so we have to compare the results we obtain using different community algorithms. In this regard the global optimum as set of nodes of the considered objective can be really discrepant than the one returned by each method [10]. The use of a single methodology can as the Louvain method can be robustified by considering other methods and synthesize the eventually different results obtained. It is useful to consider approaches which can take into account an ensamble of different algorithms or approaches in order to synthesize the results obtained [4]. So we obtain a robust community structure via multiple correspondence analysis (MCA) and we validate them using the Rand Index. At this point it is nec-
Decomposing Large Networks
3
essary to represent the different communities in such a way which cannot lead to the loss of relevant information from the original data. The computed Rand Index gives us information on the capacity of the resulting representation to ”capture” the initial results of the different community detection on the network.
3 From the Communities to their Representation Each different community, can be represented as a different interval data [3]. Differently it is possible to consider the entire network as a symbolic data [7]. In this sense we are able to obtain different interval data for each community. The procedure used is comprised of three steps: identifying the different communities from a network using an approach of community detection [9] (eventually using an MCA approach), and then from the different member community we can obtain the interval data. Following [3] each different community is based on all the single nodes of the network. From the interval data considered it is possible to measure the different attributes which are relevant in order to represent the entire community. Each measure is related to structural characteristics or attributes of the same node. We can have the attribute or structural characteristics for the entire community in addition to the attribute of those of the single n nodes. Then we have the single interval measure for the community based on those of the nodes which are members of the community: X a = (x1 , x2 , . . . , xn )
(1) Xa
Where x is a measure for the nodes belonging to a community (for instance the different betweenness or the degree). The interval data for the single community is: X I,a = [x, x]
(2)
Where x represents the upper bound of the measure belonging to the community and the x the lower bound. At this point we can consider the descriptors of the different communities as intervals [8]. In this way we can consider both the single different observations, but also the different communities by considering the intervals of their measures. It is possible to compare the different communities by their attributes (the upper and the lower bound) but also the centers and the radii [12]. We have the center: 1 I,a Xcenter = (x + x) 2 we can also consider the range between the upper and the lower bound I,a Xrange = (x − x)
and the radii
(3)
(4)
4
Carlo Drago
1 I,a Xradius = (x + x) (5) 2 These descriptors allow to take into account the different communities and to compare them.
4 Ranking the Different Representations At this point it is necessary to identify the different rankings of the representations. In this sense we have to explicitly consider the different intervals and their attributes. In particular each interval can be characterized by their attributes as the lower bound and the upper bound. Starting from their descriptors it is possible to compare the different attributes or structural indicators for each community considered. Following [12] we consider the ranking for the different intervals obtained. The comparison can be conducted by considering the different attributes of the intervals (the upper and the lower bounds, the range and the radii). An application of ranking of the different attributes of the different communities is to detect the centre of the network based on the different communities. In this sense we are interested not in single nodes but in considering the communities as the initial point of the analysis. The ranking of centrality, for instance, is computed by considering the different communities, and at the same time those selected are considered on the final network selected by their structural characteristics. At this point, it is possible to consider the ranking also by taking into account only a number of different communities. The aim is to detect the central part of the network for some relevant structural characteristics. We obtain a stylized structure of the network considering the most relevant communities. The validation phase is performed by observing a graph in which are visualized the changes on some indicators (betweenness and degree for instance). We consider the changes on the center values for each community. A radar plot [13] is a tool to analyze and compare the different measures on the ranking: it could be used as a diagnostic tool in the choice. The final network structure is based on considering only these communities.
5 Simulation Study and Application on Real Data It is possible to consider different simulated networks in order to evaluate the procedure proposed. In order to test the algorithms then we consider various types of networks and we consider the approach for each different network. In particular we simulate different networks of different typology and different size and then we apply the approach (Barabasi Game, Erdos Renyi and also Forest Fire [2]). We are able to show the community structure by detecting the different communities using the MCA-based community algorithm procedure [4]. Then we represent them
Decomposing Large Networks
5
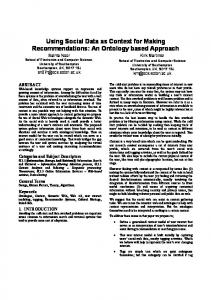
as interval data and we compute two descriptors as upper and lower bound for each community. Finally we are able to compute also the center and the radius. The statistical methods considered on the different intervals based on the communities are on [8]. The package RSDA on R allows the performing of different computations based on interval data [15]. We visualize the ranking of the different communities obtained by considering the appropriate methods and we can visualize them by using a radar plot. A radar plot visualizes each attribute of the community and structural indicator expressed as interval. At the same time we can choose the number of communities by observing the change on the relevant center parameters in the different communities (on betweenness and degree in our case). So we are able to visualize the most central communities by considering the highest ranked communities by their betweenness and the degree. At the same time the radar plot is actually showing the ranking considering also the other structural characteristics represented as interval data for each specific data. Finally by choosing the first ranked communities we are able to identify the stylized structure of the network starting from their specific initial structure. In this sense we start from the entire structure and then we are able to rank the different communities by considering the different attributes. Finally we select the first communities and we obtain the most central communities from the network. In the case of application on real data we consider the network of the Zachary karate club [16]. Here we are able to observe and select (see the figure 6) the most relevant part of the network by selection of the most central communities. These communities identify the ”core of the network” rather than other peripherical network structures.
6 Conclusions The procedure considered determines the different communities of the network and detects the most central different representations by considering some structural indicators as the betweenness or the Freeman degree. Other attributes of the different communities can be considered. The approach followed in this paper is to consider the different communities, representing them as interval data and then ranking them. It is important to emphasize that the analysis is community-based and it is robust allowing to enclosing the results of many community detection algorithms.
References 1. Billard, L., & Diday, E. (2006) Symbolic Data Analysis: Conceptual Statistics and Data Mining. England: Wiley & Sons Ltd 2. Csardi G, Nepusz T: The igraph software package for complex network research, InterJournal, Complex Systems 1695. 2006. http://igraph.org 3. Drago C. (2017) Identifying Meta Communities on Large Networks. SIS Italian Statistical Society 2017 Conference: Statistics and Data Science: New Challenges, New Generations.
6
Carlo Drago
Fig. 1 Zachary Karate Club: selected part of the network (on the left) and the entire network (on the right)
4. Drago C. (2017) MCA Based Community Detection In book: Classification, (Big) Data Analysis and Statistical Learning, Edition: Studies in Classification, Data Analysis, and Knowledge Organization, Publisher: Springer, Editors: Francesco Mola, Claudio Conversano, Maurizio Vichi 5. Duan, L., & Binbasioglu, M. (2017). An ensemble framework for community detection. Journal of Industrial Information Integration, 5, 1-5. 6. Fortunato, S. (2010). Community detection in graphs. Physics reports, 486 (3), 75-174. 7. Giordano G., Brito M. P. (2014) Social Networks as Symbolic Data, in: Analysis and Modeling of Complex Data in Behavioral and Social Sciences, Edited by Vicari, D, Okada, A, Ragozini, G, Weihs, C. (Eds, 06/2014; Springer Series: Studies in Classification, Data Analysis, and Knowledge Organization. 8. Gioia, F., & Lauro, C. N. (2005). Basic statistical methods for interval data. Statistica applicata, 17 (1), 1-27. 9. Khan, B. S., & Niazi, M. A. (2017). Network Community Detection: A Review and Visual Survey. arXiv preprint arXiv:1708.00977. 10. Leskovec, J., Lang, K. J., & Mahoney, M. (2010, April). Empirical comparison of algorithms for network community detection. In Proceedings of the 19th international conference on World wide web (pp. 631-640). ACM. 11. Mahmoud, H., Masulli, F., Rovetta, S., & Abdullatif, A. (2016, September). Comparison of Methods for Community Detection in Networks. In International Conference on Artificial Neural Networks (pp. 216-224). Springer International Publishing. 12. Mballo, C., & Diday, E. (2005). Decision trees on interval valued variables. The electronic journal of symbolic data analysis, 3(1), 8-18. 13. Noirhomme-Fraiture, M. (2002). Visualization of large data sets: the zoom star solution. International Electronic Journal of Symbolic Data Analysis, 26-39. 14. Richards, W., & Macindoe, O. (2010, August). Decomposing social networks. In Social Computing (SocialCom), 2010 IEEE Second International Conference on (pp. 114-119). IEEE. 15. Rodriguez R.O. (2017) with contributions from Carlos Aguero, Olger Calderon, Roberto Zuniga and Jorge Arce. RSDA: R to Symbolic Data Analysis. R package version 2.0.2. https://CRAN.R-project.org/package=RSDA 16. Zachary W.W. An information flow model for conflict and fission in small groups, Journal of Anthropological Research 33, 452-473 (1977).