a 3D data cube with two spatial and one frequency axis. The spectrum ... from the data cube. First, the spectra are ..... Sons Inc., Chichester (2008). 9. Mazet, V.
Decomposition and Classification of Spectral Lines in Astronomical Radio Data Cubes Vincent Mazet1 , Christophe Collet1 , and Bernd Vollmer2 1
LSIIT (UMR 7005 University of Strasbourg–CNRS), Bd S´ebastien Brant, BP 10413, 67412 Illkirch Cedex, France 2 Observatoire Astronomique de Strasbourg (UMR 7550 University of Strasbourg–CNRS), 11 rue de l’Universit´e, 67000 Strasbourg, France {vincent.mazet,c.collet,bernd.vollmer}@unistra.fr
Abstract. The natural output of imaging spectroscopy in astronomy is a 3D data cube with two spatial and one frequency axis. The spectrum of each image pixel consists of an emission line which is Doppler-shifted by gas motions along the line of sight. These data are essential to understand the gas distribution and kinematics of the astronomical object. We propose a two-step method to extract coherent kinematic structures from the data cube. First, the spectra are decomposed into a sum of Gaussians using a Bayesian method to obtain an estimation of spectral lines. Second, we aim at tracking the estimated lines to get an estimation of the structures in the cube. The performance of the approach is evaluated on a real radio-astronomical observation. Keywords: Bayesian inference, MCMC, spectrum decomposition, multicomponent image, spiral galaxy NGC 4254.
1
Introduction
Astronomical data cubes are 3D images with spatial coordinates as the two first axis and the frequency (velocity channels) as third axis. We consider in this paper 3D observations of galaxies made at different wavelengths, typically in the radio (> 1 cm) or near-infrared bands (≈ 10 μm). Each pixel of these images contains an atomic or molecular line spectrum which we called in the sequel spexel. The spectral lines contain information about the gas distribution and kinematics of the astronomical object. Indeed, due to the Doppler effect, the lines are shifted according to the radial velocity of the observed gas. A coherent physical gas structure gives rise to a coherent structure in the cube. The standard method for studying cubes is the visual inspection of the channel maps and the creation of moment maps (see figure 1 a and b): moment 0 is the integrated intensity or the emission distribution and moment 1 is the velocity field. As long as the intensity distribution is not too complex, these maps give a fair impression of the 3D information contained in the cube. However, when the 3D structure becomes complex, the inspection by eye becomes difficult and important information is lost in the moment maps because they are produced A.-B. Salberg, J.Y. Hardeberg, and R. Jenssen (Eds.): SCIA 2009, LNCS 5575, pp. 189–198, 2009. c Springer-Verlag Berlin Heidelberg 2009 �
190
V. Mazet, C. Collet, and B. Vollmer
by integrating the spectra, and thus do not reflect the individual line profiles. Especially, the analysis becomes extremely difficult when the spexels contain two or more components. Anyway, the need of an automatic method for the analysis of data cube is justified by the fact that eye inspection is subjective and time-consuming. If the line components were static in position and widths, the problem would come down to be a source separation problem from which a number of works have been proposed in the context of astrophysical source maps from 3D cubes in the last years [2]. However, theses techniques cannot be used in our application where the line components (i.e. the sources) may vary between two spatial locations. Therefore, Flitti et al. [5] have proposed a Bayesian segmentation carried out on reduced data. In this method, the spexels are decomposed into Gaussian functions yielding reduced data feeding a Markovian segmentation algorithm to cluster the pixels according to similar behaviors (figure 1 c). We propose in this paper a two-step method to isolate coherent kinematic structures in the cube by first decomposing the spexels to extract the different line profiles and then to classify the estimated lines. The first step (section 2) decomposes each spexel in a sum of Gaussian components whose number, positions, amplitudes and widths are estimated. A Bayesian model is presented: it aims at using all the available information since pertinent data are too few. The major difference with Flitti’s approach is that the decomposition is not set on a unique basis: line positions and widths may differ between spexels. The second step (section 3) classifies each estimated component line assuming that two components in two neighbouring spexels are considered in the same class if their parameters are close. This is a new supervised method allowing the astronomer to set a threshold on the amplitudes. The information about the spatial dependence between spexels is introduced in this step. Performing the decomposition and classification steps separately is simpler that performing them together. It also allows the astronomer to modify the classification without doing again the decomposition step which is time consuming. The method proposed in this paper is intended to help astronomers to handle complex data cubes and to be complementary to the standard method of analysis. It provides a set of spatial zones corresponding to the presence of a coherent kinematic structure in the cube, as well as spectral characteristics (section 4).
2 2.1
Spexel Decomposition Spexel Model
Spexel decomposition is typically an object extraction problem consisting here in decomposing each spexel as a sum of spectral component lines. A spexel is a sum of spectral lines which are different in wavelength and intensity, but also in width. Besides, the usual model in radioastronomy assumes that the lines are Gaussian. Therefore, the lines are modeled by a parametric function f with unknown parameters (position c, intensity a and width w) which are estimated as well as the component number. We consider in the sequel that the cube
Decomposition and Classification of Spectral Lines
191
contains S spexels. Each spexel s ∈ {1, . . . , S} is a signal y s modeled as a noisy sum of Ks components: ys =
Ks �
ask f (csk , wsk ) + es = F s as + es ,
(1)
k=1
where f is a vector function of length N , es is a N × 1 vector modeling the noise, F s is a N × Ks matrix and as is a Ks × 1 vector: ⎞ ⎞ ⎛ ⎛ f 1 (cs1 , ws1 ) · · · f 1 (csKs , w sKs ) as1 ⎟ ⎟ ⎜ ⎜ .. .. as = ⎝ ... ⎠ . Fs = ⎝ ⎠ . . f N (cs1 , w s1 ) · · · f N (csKs , wsKs )
asKs
The vector function f for component k ∈ {1, . . . , Ks } in pixel s ∈ {1, . . . , S} at frequency channel n ∈ {1, . . . , N } equals:
(n − csk )2 f n (csk , w sk ) = exp − . 2w2sk � For simplicity, the expression of a Gaussian function was multiplied by 2πw 2sk so that ask corresponds to the maximum of the line. In addition, we have ∀s, k, ask ≥ 0 because the lines are supposed to be non-negative. A perfect Gaussian shape is open to criticism because in reality the lines may be asymmetric, but modelling the asymmetry needs to consider one (or more) unknown and appears to be unnecessary complex. Spexel decomposition is set in a Bayesian framework because it is clearly an ill-posed inverse problem [8]. Moreover, the posterior being a high dimensional complex density, usual optimisation techniques fail to provide a satisfactory solution. So, we propose to use Monte Carlo Markov chain (MCMC) methods [12] which are efficient techniques for drawing samples X from the posterior distribution π by generating a sequence of realizations {X (i) } through a Markov chain having π as its stationary distribution. Besides, we are interesting in this step to decompose the whole cube, so the spexels are not decomposed independently each other. This allows to consider some global hyperparameters (such as a single noise variance allover the spexels). 2.2
Bayesian Model
The chosen priors are described hereafter for all s and k. A hierarchical model is used since it allows to set priors rather than a constant on hyperparameters. Some priors are conjugate so as to get usual conditional posteriors. We also try to work with usual priors for which simulation algorithms are available [12]. • the prior model is specified by supposing that Ks is drawn from a Poisson distribution with expected component number λ [7]; • the noise es is supposed to be white, zero-mean Gaussian, independent and identically distributed with variance re ;
192
V. Mazet, C. Collet, and B. Vollmer
• because we do not have any information about the component locations csk , they are supposed uniformly distributed on [1; N ]; • component amplitudes ask are positive, so we consider that they are distributed according to a (conjugate) Gaussian distribution with variance ra and truncated in zero to get positive amplitudes. We note: ask ∼ N + (0, ra ) where N + (μ, σ 2 ) stands for a Gaussian distribution with positive support defined as (erf is the error function):
�−1
(x − μ)2 μ 2 √ p(x|μ, σ) = exp − 1 + erf 1l[0;+∞[ (x); πσ 2 2σ 2 2σ 2 • we choose an inverse gamma prior IG(αw , βw ) for component width w sk because this is a positive-support distribution whose parameters can be set according to the approximate component width known a priori. This is supposed to equal 5 for the considered data but, because this value is very approximative, we also suppose a large variance (equals to 100), yielding αw ≈ 2 and βw ≈ 5; • the hyperparameter ra is distributed according to an (conjugate) inverse gamma prior IG(αa , βa ). We propose to set the mean to the approximate real line amplitude (say μ) which can be roughly estimated, and to assign a large value to the variance. This yields: αa = 2 + ε and βa = μ + ε with ε � 1; • Again, we adopt an inverse gamma prior IG(αe , βe ) for re , whose parameters are both set close to zero (αe = βe = ζ, with ζ � 1). The limit case corresponds to the common Jeffreys prior which is unfortunately improper. The posterior has to be integrable to ensure that the MCMC algorithm is valid. This cannot been checked mathematically because of the posterior complexity but, since the priors are integrable, a sufficient condition is fulfilled. The conditional posterior distributions of each unknown is obtained thanks to the prior defined above: � � csk | · · · ∝ exp − y s − F s as 2 /2re 1l[1,N ] (csk ), ask | · · · ∼ N + (μsk , ρsk ),
1 βw 1
ys − F s as 2 − 1l[0;+∞[ (w sk ), wsk | · · · ∝ exp − α 2re w sk wskw +1 � � Ks L 1 �� 2 ra | · · · ∼ IG + αa , ask + βw , 2 2 s k=1 � � NS 1� 2 + αe ,
y s − F s as + βe re | · · · ∼ IG 2 2 s where x| · · · means x conditionally to� y and the other variables, N is the spectum length, S is the spexel number, L = s Ks denotes the component number and
Decomposition and Classification of Spectral Lines
μsk =
ρsk T z F sk , re sk
ρsk =
ra re , re + ra F Tsk F sk
193
z sk = y s −F s as +F sk ask
where F sk corresponds to the kth column of matrix F s . The conditional posterior expressions for csk , wsk and the hyperparameters are straightforward, contrary to the conditional posterior for ask whose detail of computation can be found in [10, Appendix B]. 2.3
MCMC Algorithm and Estimation
MCMC methods dealing with variable dimension models are known as transdimensional MCMC methods. Among them, the reversible jump MCMC algorithm [7] appears to be popular, fast and flexible [1]. At each iteration of this algorithm, a move which can either change the model dimension or generate a random variable is randomly performed. We propose these moves: – – – –
Bs “birth in s”: a component is created in spexel s; Ds “death in s”: a component is deleted in spexel s; Us “update in s”: variables cs , as and ws are updated; H “hyperparameter update”: hyperparameters ra and re are updated.
The probabilities bs , ds , us and h of moves Bs , Ds , Us and H are chosen so that: � � p(Ks + 1) γ min 1, S+1 p(Ks ) 1 − bs − ds us = S+1
bs =
ds =
� � p(Ks − 1) γ min 1, S +1 p(Ks ) 1 h= S+1
with γ such that bs +ds ≤ 0.9/(S +1) (we choose γ = 0.45) and ds = 0 if Ks = 0. We now discuss the simulation of the posteriors. Many methods available in literature are used for sampling positive normal [9] and inverse gamma distributions [4,12]. Besides, csk and wsk are sampled using a random-walk MetropolisHastings algorithm [12]. To improve the speed of the algorithm, they are sampled jointly avoiding to compute the likelihood twice. The proposal distribution is a (separable) truncated Gaussian centered on the current values: ˜ csk ), csk ∼ N (c∗sk , rc ) 1l[1,N ] (˜
˜ sk ∼ N + (w∗sk , rw ) w
where ˜· stands for the proposal and ·∗ denotes the current value. The algorithm efficiency depends on the scaling parameters rc and rw chosen by the user (generally with heuristics methods, see for example [6]). The estimation is computed by picking in each Markov chain the sample which minimises the mean square error: it is a very simple estimation of the maximum a posteriori which does not need to save the chains. Indeed, the number of unknowns, and as a result, the number of Markov chains to save, is prohibitive.
194
3 3.1
V. Mazet, C. Collet, and B. Vollmer
Component Classification New Proposed Approach
The decomposition method presented in section 2 provides for each spexel Ks components with parameter xsk = {csk , ask , wsk }. The goal of component classification is to assign to each component (s, k) a class q sk ∈ IN∗ . One class corresponds to only one structure, so that components with the same class belong to the same structure. We also impose that, in each pixel, a class is present once at the most. First of all, the components whose amplitude is lower than a predefined threshold τ are vanished in the following procedure (this condition helps the astronomer to analyse the gas location with respect to the intensity). To perform the classification, we assume that the component parameters exhibit weak variation between two neighbouring spexels, i.e. two components in two neighbouring spexels are considered in the same class if their parameters are close. The spatial dependency is introduced by defining a Gibbs field over the decomposed image [3]: � � � 1 1 Uc (q|x) (2) p(q|x) = exp (−U (q|x)) = exp − Z Z c∈C
where Z is the partition function, C gathers the cliques of order 2 in a 4-connexity system and the potential function is defined as the total cost of the classification. Let consider one component (s, k) located in spexel s ∈ {1, . . . , S} (k ∈ {1, . . . , Ks }), and a neighbouring pixel t ∈ {1, . . . , S}. Then, the component (s, k) may be classified with a component (t, l) (l ∈ {1, . . . , Kt }) if their parameters are similar. In this case, we define the cost of component (s, k) equals to a distance D(xsk , xtl )2 computed with the component parameters (we see further why we choose the square of the distance). On the contrary, if no component in spexel t is close enough to component (s, k), we choose to set the cost of the component to a threshold σ 2 which codes the weaker similarity allowed. Indeed, if the two components (s, k) and (t, l) are too different (that is D(xsk , xtl )2 > σ 2 ), it would be less costly to let them in different classes. Finally, the total cost of the classification (i.e. the potential function) corresponds to the sum of the component costs. Formally, these considerations read in the following manner. The potential function is defined as: Uc (q|x) =
Ks �
ϕ(xsk , q sk , xt , q t )
(3)
k=1
where s and t are the two spexels involved in the clique c, and ϕ(xsk , q sk , xt , q t ) represents the cost associated for the component (s, k) and defined as: � D(xsk , xtl )2 if ∃ l such that q sk = q tl , (4) ϕ(xsk , q sk , xt , q t ) = otherwise. σ2
Decomposition and Classification of Spectral Lines
195
In some ways, ϕ(xsk , q sk , xt , q t ) can be seen as a truncated quadratic function which is known to be very appealing in the context of outliers detection [13]. We choose for the distance D(xsk , xtl ) a normalized Euclidean distance: �
2
2
2 ask − atl wsk − wtl csk − ctl D(xsk , xtl ) = + + . (5) δc δa δw The distance is normalized because the three parameters have not the same unity. δc and δw are the normalizing factors in the frequency domain whereas δa is the one in the intensity domain. We consider that two components are similar if their positions or widths do not differ for more than 1.2 wavelength channel, or if the difference between the amplitudes do not exceed 40% of the maximal amplitude. So, we set δc = δw = 1.2, δa = max(ask , as� k� ) × 40% and σ = 1. To resume, we look for: qˆ = arg max p(q|x) q
⇔
qˆ = arg min q
Ks ��
ϕ(xsk , q sk , xt , q t )
(6)
c∈C k=1
subject to the uniqueness of each class in each pixel. 3.2
Algorithm
We propose a greedy algorithm to perform the classification because it yields good results in an acceptable computation time (≈ 36 s on the cube considered in section 4 containing 9463 processed spexels). The algorithm is presented below. The main idea consists in tracking the components through the image by starting from an initial component and looking for the components with similar parameters spexel by spexel. These components are then classified in the same class, and the algorithm starts again until every estimated component is classified. We note z ∗ the increasing index coding the class, and the set L gathers the estimated components to classify. 1. set z ∗ = 0 2. while it exists some components that are not yet classified: 3. z ∗ = z ∗ + 1 4. choose randomly a component (s, k) 5. set L = {(s, k)} 6. while L is not empty: 7. set (s, k) as the first element of L 8. set q sk = z ∗ 9. delete component (s, k) from L 10. among the 4 neighbouring pixels t of s, choose the components l that satisfy the following conditions: (C1) they are not yet classified (C2) they are similar to component (s, k) that is D(xsk , xtl )2 < σ 2 (C3) D(xsk , xtl ) = arg minm∈{1,...,Kt } D(xsk , xtm ) (C4) their amplitude is greater than τ 11. Add (t, l) to L
196
V. Mazet, C. Collet, and B. Vollmer
4
Application to a Modified Data Cube of NGC 4254
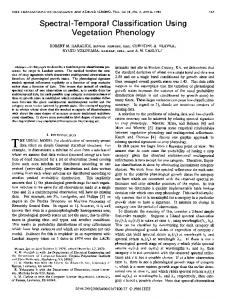
The data cube is a modified radio line observations made with the VLA of NGC 4254, a spiral galaxy located in the Virgo cluster [11]. It is a well-suited test case because it contains mainly only one single line (the HI 21 cm line). For simplicity, we keep in this paper pixel numbers for the spatial coordinates axis and channel numbers for the frequency axis (the data cube is a 512 × 512 × 42 image, figures show only the relevant region). In order to investigate the ability of the proposed method to detect regions of double line profiles, we added an artificial line in a circular region north of the galaxy center. The intensity of the artificial line follows a Gaussian profile. Figure 1 (a and b) shows the maps of the first two moments integrated over the whole data cube and figure 1 c shows the estimation obtained with Flitti’s method [5]. The map of the HI emission distribution (figure 1 a) shows an inclined gas disk with a prominent one-armed spiral to the west, and the additional line produces a local maximum. Moreover, the velocity field (figure 1 b) is that of a rotating disk with perturbations to the north-east and to the north. In addition, the artifical line produces a pronounced asymmetry. The double-line nature of this region cannot be recognized in the moment maps. 150
150
100
100
50
50
0 0
50
100
a
150
0 0
50
100
b
150
c
Fig. 1. Spiral galaxy NGC 4254 with a double line profile added: emission distribution (left) and velocity field (center); the figures are shown in inverse video (black corresponds to high values). Right: Flitti’s estimation [5] (gray levels denote the different classes). The mask is displayed as a thin black line. The x-axis corresponds to right ascension, the y-axis to declination, the celestial north is at the top of the images and the celestial east at the left.
To reduce the computation time, a mask is determined to process only the spexels whose maximum intensity is greater than three times the standard deviation of the channel maps. A morphological dilation is then applied to connect close regions in the mask (a disk of diameter 7 pixels is chosen for structuring element). The algorithm ran for 5000 iterations with an expected component number λ = 1 and a threshold τ = 0. The variables are initialized by simulating them from the priors. The processing was carried out using Matlab on a double core (each 3.8 GHz) PC and takes 5h43. The estimation is very satisfactory because
Decomposition and Classification of Spectral Lines
197
the difference between the original and the estimated cubes is very small; this is confirmed by inspecting by eye some spexel decomposition. The estimated components are then classified into 9056 classes, but the majority are very small and, consequently, not significant. In fact, only three classes, gathering more than 650 components each, are relevant (see figure 2): the large central structure (a & d), the “comma” shape in the south-east (b & e) and the artificially added component (c & f) which appears clearly as a third relevant class. Thus, our approach operates successfully since it is able to distinguish clearly the three main structures in the galaxy. 150
150
150
100
100
100
50
50
50
0 0
50
100
150
0 0
50
a
100
150
0 0
150
150
100
100
100
50
50
50
50
100
d
150
0 0
50
100
e
100
150
100
150
c
150
0 0
50
b
150
0 0
50
f
Fig. 2. Moment 0 (top) and 1 (bottom) of the three main estimated classes
The analysis of the two first moments of the three classes is also instructive. Indeed, the velocity field of the large central structure shows a rotating disk (figure 2 d). As well, the emission distribution of the artificial component shows that the intensity of the artificial line is maximum at the center and falls off radially, while the velocity field is quite constant (around 28.69, see figure 2, c and f). This is in agreement with the data since the artificial component is a Gaussian profile in intensity and has a center velocity at channel number 28. Flitti et al. propose a method that clusters the pixels according to the six most representative components. Then, it is able to distinguish two structures that crosses while our method cannot because it exists at least one spexel where the components of each structure are too close. However, Flitti’s method is unable to distinguish superimposed structures (since each pixel belongs to a single class) and a structure may be split into different kinematic zones if the spexels inside
198
V. Mazet, C. Collet, and B. Vollmer
are evoluting too much: these drawbacks are clearly shown in figure 1 c. Finally, our method is more flexible and can better fit complex line profiles.
5
Conclusion and Perspectives
We proposed in this paper a new method for the analysis of astronomical data cubes and their decomposition into structures. In a first step, each spexel is decomposed into a sum of Gaussians whose number and parameters are estimated via a Bayesian framework. Then, the estimated components are classified with respect to their shape similarity: two components located in two neighbouring spexels are set in the same class if their parameters are similar enough. The resulting classes correspond to the estimated structures. However, no distinction between classes can be done if the structure is continuous because it exists at less one spexel where the components of each structure are too close. This is the major drawback of this approach, and future works will be dedicated to handle the case of crossing structures.
References 1. Capp´e, O., Robert, C.P., Ryd`en, T.: Reversible jump, birth-and-death and more general continuous time Markov chain Monte Carlo samplers. J. Roy. Stat. Soc. B 65, 679–700 (2003) 2. Cardoso, J.-F., Snoussi, H., Delabrouille, J., Patanchon, G.: Blind separation of noisy Gaussian stationary sources. Application to cosmic microwave background imaging. In: 11th EUSIPCO (2002) 3. Chellappa, R., Jain, A.: Markov random fields. Theory and application. Academic Press, London (1993) 4. Devroye, L.: Non-uniform random variate generation. Springer, Heidelberg (1986) 5. Flitti, F., Collet, C., Vollmer, B., Bonnarel, F.: Multiband segmentation of a spectroscopic line data cube: application to the HI data cube of the spiral galaxy NGC 4254. EURASIP J. Appl. Si. Pr. 15, 2546–2558 (2005) 6. Gelman, A., Roberts, G., Gilks, W.: Efficient Metropolis jumping rules. In: Bernardo, J., Berger, J., Dawid, A., Smith, A. (eds.) Bayesian Statistics 5, pp. 599–608. Oxford University Press, Oxford (1996) 7. Green, P.J.: Reversible jump Markov chain Monte Carlo computation and Bayesian model determination. Biometrika 82, 711–732 (1995) 8. Idier, J. (ed.): Bayesian approach to inverse problems. ISTE Ltd. and John Wiley & Sons Inc., Chichester (2008) 9. Mazet, V., Brie, D., Idier, J.: Simulation of positive normal variables using several proposal distributions. In: 13th IEEE Workshop Statistical Signal Processing (2005) 10. Mazet, V.: D´eveloppement de m´ethodes de traitement de signaux spectroscopiques : estimation de la ligne de base et du spectre de raies. PhD. thesis, Nancy University, France (2005) 11. Phookun, B., Vogel, S.N., Mundy, L.G.: NGC 4254: a spiral galaxy with an m = 1 mode and infalling gas. Astrophys. J. 418, 113–122 (1993) 12. Robert, C., Casella, G.: Monte Carlo statistical methods. Springer, Heidelberg (2002) 13. Rousseeuw, P., Leroy, A.: Robust Regression and Outlier Detection. Series in Applied Probability and Statistics. Wiley-Interscience, Hoboken (1987)