Journal of Medical and Biological Engineering, 24(1): 23-28
23
Decomposition of Control Signals for Saccade and Vergence Eye Movements Using Independent Component Analysis Yung-Fu Chen
Tainsong Chen*,1
John L. Semmlow2
Department of Management Information Systems, Chung-Tai Institute of Health Sciences and Technology, Tai-Chung, 406, Taiwan R.O.C. 1 Institute of Biomedical Engineering, National Cheng Kung University, Tainan, 701, Taiwan R.O.C. 2 Department of Biomedical Engineering, Rutgers University, Piscataway, NJ, USA Received 17 February 2004; Accepted 10 March 2004
Abstract Saccade is believed to be the fastest eye movement, which is conjunctive and functions to redirect the fovea of the retina to the object of interest. Vergence, on the other hand, are disjunctive eye movements that two eyes move in different directions, which in turn bring the images of the target for two eyes into their corresponding retinal positions. Main sequence relations have been used for describing the dynamics of the saccadic and vergent eye movements. Saccadic duration is approximately proportional to its amplitude, whereas the peak velocity and amplitude relation could be described as an exponential function with saturation occurred at 30-40o. Main sequence relations are also used for quantitative analysis of vergence eye movements that the peak velocity is significantly smaller than saccades. Fourier analysis has also been used in quantitative investigation of saccades. Unlike the temporal analysis for the main sequence relations, spectral analysis relies on the whole trajectories of saccades. An inverse method was also used by previous investigators to reconstruct the input signal of a saccade from the fourier transform of the padded and mirrored position profile and the impulse response of the system model. In this paper, we present the application of independent component analysis (ica) to decompose the components of saccade and vergence eye movements. The results show that the pulse component is activated before the step for both vergence and saccade, which is consistent with previous findings. Also the effect of accommodative activation can be observed for vergence using ica. In conclusion, ica is useful in decomposing the control components for the saccade and vergence from ensembles of recorded profiles, which provides an alternative method for eye movement investigation. Keywords: Eye Movement, Vergence, Saccade, Independent Component Analysis
Introduction Based on the characteristics of oculomotor plant and a linear approximation of the relationship between motorneuron drive and muscle force, the formula shown in Eq. (1) depicts the relationship between the pulse intensity provided by the motorneurons and the muscle force [1]. •
••
• ••
• •••
•
B = b + kE + r E + u E + v E + w E − c B (1) in which b, k, r, u, v, w, and c are all constants, B indicates the firing rate of the motorneuron, and E is the eye position with • dots over it representing its time derivates. The term c B contributes to the exponential decay of the slide component. The above equation was further reduced to a first-order equation, as represented in Eq. (2), known as the pulse-step model [2]. •
B = b + kE + r E *Corresponding author: Tainsong Chen Tel: +886-6-2757575 ext.63423; Fax: +886-6-2343270 E-mail:
[email protected]
(2)
Saccadic Eye Movements Saccade is believed to be the fastest eye movement, which is conjunctive and functions to redirect the fovea of the retina to the object of interest [3,4]. Main sequence relations have generally been used for describing the dynamics of the saccadic eye movements for a long time [5]. Saccadic duration is approximately proportional to its amplitude, whereas the peak velocity and amplitude relation could be described as an exponential function with saturation occurred at 30-40o [6,7]. Fourier analysis has also been used in quantitative investigation of saccades. Unlike the temporal analysis for the main sequence relations, spectral analysis relies on the whole trajectory of a saccade. Van opstal and coworkers [8] used an inverse method to reconstruct the input signal (pulse and step) of a saccade. Fourier transform of the padded and mirrored position profile, y(ω), was taken and divided by the impulse response of the system model, h(ω), for obtaining the fourier transform of the input signal as shown below (3) X (ω ) = k (1 + jωT1 )(1 + jωT2 )Y (ω ) in which T1 and T2 indicate the time constants of the ocular
24
J. Med. Biol. Eng., Vol. 24. No. 1 2004
plant, and ω represents angular frequency. The input signal, x(t), can be obtained by inverse transform of Eq. (3), that is x(t ) = F −1 ( X (ω )) . Vergence Eye Movements Vergence eye movements, unlike saccades, are disjunctive that two eyes move in different directions, which in turn bring the images of the target for two eyes into their corresponding retinal positions. Vergence eye movements can be classified into four different types, including disparity (fusional), accommodative, proximal, and tonic vergence [9]. Disparity vergence is induced by the presence of binocular retinal disparity for obtaining a fused binocular perception of depth. Accommodative vergence is driven by blur response of the image because of the distance change of a target. This phenomenon is manifested by observing the nasalward movement of a covered eye with the other eye looking at an object moving from far to near. Proximal vergence is elicited by the change in vergence angle caused by the perceived nearness of an object [9]. In the absence of the above three types of vergence, tonic vergence shifting the eyes to a convergence position can be observed, which demonstrates a baseline midbrain stimulation on the vergence system. Main sequence relations, like saccades, are also used for quantitative analysis of vergence eye movements that the peak velocity for a vergence is significantly smaller than a saccade. Other temporal parameters, including latency, acceleration duration, and time constant, are also applied [10]. Convergence (both eyes move inward) was demonstrated to be faster than divergence (both eyes move outward) [10]. The phase plot delineating the instantaneous velocity against amplitude relationship demonstrates approximately the same fast component amplitude for convergence and divergence. Regarding to other temporal parameters the convergence was shown to be shorter than the divergence, in which time constant and total duration were amplitude dependent while latency and acceleration duration were not. Time constant is the parameter that provides the first-order estimation of the vergence dynamic response to a disparity step. Several models had been suggested to explain the relationship between vergence dynamic property and oculomotor control. The first model was proposed by Rashbass and Westheimer [11], in which the visual feedback was thought to regulate the vergence dynamics. It was not suitable in describing vergence response for sinusoidal stimulus and was later modified by Krishnan and Stark [12] with a derivative element was added. Both the step response and the sinusoidal response were well simulated, while fast dynamics simulation was argued to be unsatisfactory in matching experimental data [13]. Recently the dual-mode model [10] was proposed which stated that the initial (transient) component drives the eyes to an approximate position while the late (sustained) component eliminates residue disparity using visual feedback. An open-loop initial component model, consisted of a pulse generator, an integrator for generating step, and a first-order vergence plant, was constructed based on the dual-mode model for investigating the difference between convergence and divergence dynamics [14]. The response of
the isolated initial component was obtained by applying the disappearing step stimulus with the stimulus disappeared after 50 or 100 ms. Model parameters were adjusted to obtain close fit between simulated and experimental data. The results indicated that the ratio of pulse to step gain was much smaller for the divergence, suggesting that the convergence is driven by both pulse and step signals while the divergence by the step signal only, which was consistent to the neuro-physiological data [15]. The same model was later used to study the dynamics of the disparity vergence step response, where a second-order vergence plant was applied for simulation [16]. Decomposition of the Control Components As mentioned above, the control components for both vergence and saccade eye movements are composed of an initial fast component and a sustained slow component. In this study, ensembles of recorded vergence and saccade profiles were decomposed into separate components using ICA technique. The dynamic characteristics of the decomposed signals for two types of eye movements were compared.
Materials and methods Experimental Setups and Experimental Paradigms Binocular eye position was recorded by means of a Skalar infrared eye movement monitor (IRIS, Model 6500, Delft, The Netherlands). The horizontal linear range is between –25o and +25o with an accuracy of 3 minarc. Calibration is done on each test, and responses were sampled at 100Hz for vergence and 1000 Hz for saccade by considering the velocity for the latter is faster than the former. Eye movement recording hardware consists of a Pentium IV-based IBM compatible PC accompanied with an A/D converter for signal acquisition. The stimulus hardware consists of a light-bar controller driven by a digital I/O card for test patterns generation. The system configurations are shown in Fig 1 for saccade and vergence recordings. Customized computer programs designed using LabView and Matlab were developed to control the stimulus hardware and provided off-line data processing. Saccade Eye Movements Targets for saccadic eye movements consisted of light-emitting diodes (LED) arrayed on a stimulus arc of 120 cm in radius, with the subject seated at the arc center to eliminate changes in vergence. The stimulus arc is composed of 13 LEDs, spanned a range from 30o left to 30o right with 5o intervals, and is controlled by a computer for generating sequential commands to switch the LEDs on and off. To discourage subjects’ prediction, saccadic targets are displayed with pseudo random amplitudes, duration, and direction. All the experiments are performed in a dark room, the subjects are asked to sit in chair with headrest to avoid head movement. Experiments will be terminated if subjects show nervousness or fatigue. During calibration, targets ranging from 20o left to 20o right were displayed in the first 20 seconds for each test. Each test last for 3 minutes and the experiment repeated for at least 6 sessions. Subjects took a 3-minute break after each test. At least 40 profiles were acquired each amplitude for ICA
ICA for Eye Movement Analysis
(a)
(b) Figure 1. Configuration of the experimental setup for (a) saccade and (b) vergence eye movements.
Figure 2. Detection of the saccadic onset and offset for a saccade with 5o amplitude.
decomposition. Calibration was performed at the beginning of each test by asking the subject to look at the targets scanning from –20o to 20o and the linearity was calculated. The experiment proceeded only if the linearity was greater than 0.95. Vergence Eye Movements
25
As shown in Fig. 1(b), two experimental modes, LED mode and haploscopic modes, were used for vergence experiments. The stimulus always begins at the same initial position using an illuminated LED. For the LED mode, the subject was asked to fixate on an initial target LED and then made a convergent eye movement that the final target was closer to the subject. The computer initiated the extinguishing of the initial LED and the lighting of the next target LED where subjects were asked to track the new target positioned along the midline of the subject. Because the targets change in 3-dimensional space, the focal length of the target to the subject changes. This change in focal length stimulates disparity vergence with a change in accommodation. For the haploscopic mode, on the other hand, the targets consisted of two non-overlapping vertical lines displayed on two monitors providing the step stimulus, where two mirrors positioned 45o to the subject’s line of sight were used for partially reflecting the images and being observed by two eyes. After the subject pushed the trigger, the two lines would move in a step manner triggering either a four degree or six degree convergence response. The subject would follow the stimulus and would once again fuse the lines. Notice that the accommodative component is isolated and only the disparity component can be observed for the haploscopic mode, while both are observable for the LED mode. Data Analysis Vergence and saccade onsets were detected by scanning the velocity profiles until the first point where the velocity reaches a threshold was found. As indicated in Fig. 2, the saccade onset was defined as the point 3ms before the detected position (10o/sec threshold), whereas the offset was at the position 3ms after the last point where the velocity was still greater than the threshold. To apply ICA to ensemble saccade and vergence response data, each response is treated as an observed signal. According to the previous investigation [17] an ensemble of 25 responses for one target amplitude was used for the decomposition of vergence eye movement. Therefore, at least 40 responses for one target amplitude were tested. Ensembles for testing 3 target amplitudes (10o, 15o, and 20o) for saccade were obtained for each subject, while only 2 target amplitudes (4o and 6o) for the vergence. The number of active independent components was estimated using Scree test of the principle component analysis (PCA) that the principal components were calculated using the MATLAB “princmp” routine. The FastICA algorithm implemented with Window-based MATLAB was downloaded from the website (http://www.cis.hut.fi/projects /ica/fastica/fp.html) and modified for this study. In Fig. 3, position profiles recorded from a single subject and the ensemble average are displayed. The standard deviations for two principle components and one principle component are demonstrated in Fig 3(c), their differences to the ensemble standard deviation are also displayed in Fig 3(d). The Scree plot shown in Fig 3(e) indicates that there are only two principle components embedded in the recorded profiles. Figure 3(f) displayed two principal components which were successfully decomposed.
26
J. Med. Biol. Eng., Vol. 24. No. 1 2004
(a) Position profiles (N=40)
(b) Ensemble average
(c)Standard deviation
(e)Scree plot
(f) Decomposed components
(d) Standard deviation
Figure 3. (a) Ensemble of 38 saccadic position profiles recorded from a subject for 10o amplitude and (b) the ensemble average. Standard deviation for the ensemble profiles, principle component 1, and priciple components 1+2. Differences in standard deviation between the ensemble average and (c) the principal component and between the ensemble average and (d) sume of the first two principal components. (e) The Scree plot indicating two principle components are enough for representing a saccade. (f) The decomposed pulse and step components.
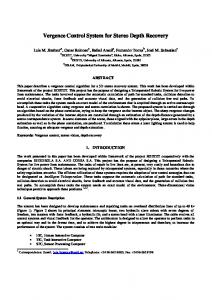
Results The results for the decomposition of vergence and saccade eye movements are shown respectively in Fig. 4 and Fig. 5. As displayed in these figures, the pulse components are activated before the steps, which is consistent with the previous findings [3]. In Fig. 4, the accommodative component, which was activated in the LED mode and absent in the haploscopic mode, can also be discriminated. (a) 6o Led
(c) 4o Led
(b) 6o Hap
(d) 4o Hap
Figure 4. Decomposition of vergence components for 4o and 6o with profiles recorded with Led ((a) and (c)) and Haploscopic ((b) and (d)) paradigms. Notice that the effect of accommodative activation can be easily seen on the Led (arrow) paradigm.
Discussion and conclusion Direct Fourier transform of saccades revealed that a local minimum (M1) in either the power spectrum or the frequency derivative of phase plot is visible for all saccades [18]. Computer simulation indicated that if the pulse component is rectangular, M1 must occur at a frequency that is the reciprocal of the pulse duration. It was shown nonetheless that the reciprocal of the frequency of M1 is actually shorter than both saccadic duration and the burst duration of the motorneuron, which supported that the pulse component might not be rectangular [18]. As shown in Figs. 3-5 the pulse components obtained from ICA demonstrate to be non-rectangular, which is consistent to previous investigations [18,19]. Recently the concept of spectral main sequence had been proposed to measure the characteristics of saccadic trajectories [19]. They showed that near-linear relationships among the frequencies of the first three minima (M1, M2, and M3) and the
ICA for Eye Movement Analysis
27
References [1] [2] [3] [4] [5]
(a)
[6]
[7]
[8]
[9] [10]
[11] (b)
[12]
[13]
[14]
[15]
[16] (c) Figure 5. Decomposition of saccade components for (a) 10o, (b) 15o, and (c) 20o amplitudes.
[17]
reciprocal of duration (1/T) were generally found by analyzing the Fourier transform of each saccade. It was also found that M2 and M3 are not harmonics of M1, which demonstrates that saccades are not activated by a rectangular pulse driving the ocular plant [19]. In conclusion, ICA is useful in decomposing the control components for the saccade and vergence from an ensemble of recorded profiles.
[18]
[19]
D.A. Robinson, “The mechanics of human smooth pursuit eye movement”, J Physiol., 180:569-591, 1965 D.A. Robinson, “Oculomotor unit behavior in the monkey”, J Neurophysiol, 33: 393-404, 1970. R.J. Leigh and D.S. Zee, “The neurology of eye movements”, 3rd Ed. New York: Oxford Univ Press, 1999. Becker W. Saccades, “In: Eye movements, Edited by Carpenter RHS”, MacMillan, 1991. A.T. Bahill, M.R. Clark and L. Stark, “The main sequence, a tool for studying human eye movements”, Math Biosci, 24: 191-204, 1975. R.W. Baloh, A.W. Sills, W.E. Kumley and V. Honrubia “Quantitative measurement of saccade amplitude, duration, and velocity”, Neurology, 25: 1065-1070, 1975. H. Collewijn, C.J. Erkelens, R.M. Steinman, “Binocular coordination of human horizontal saccadic eye movements”, J Physiol (London), 404: 157-182, 1988. A.J. Van Opstal, JAM Van Gisbergen and J.J. Eggermont, “Reconstruction of neural control signals for saccades based on an inverse method”, Vision Res, 25: 789-801,1985. K.J. Ciuffreda, B. Tannen, “Eye movement basics for the clinician”, Mosby-Year, 1995. G.K. Hung, H. Zhu and K.J. Ciuffreda, “Convergence exhibit different response characteristics to symmetric stimuli”, Vision Res, 37: 1197-1205, 1997. C. Rashbass and G. Westherimer, “Disjunctive eye movements”, J Physiol., 159: 339-360, 1961. V.V. Krishnan and L. Stark, “A heuristic moddel for the human vergence eye movement system”, IEEE Trans Biomed Eng., 24: 44-49, 1977. J.L. Semmlow, G.K. Hung and K.J. Ciuffreda, “Quantitative assessment of disparity vergence components” Invest Ophthalmol Vis Sci., 27: 558-564, 1986. J.L. Horng, J.L. Semmlow, G.K. Hung and K.J. Ciuffreda, “Initial component control in disparity vergence: A model-based study”, IEEE Trans Biomed Eng., 45: 249–257, 1998. L.E. Mays, J.D. Porter, P.D.R. Gamlin and C.A. Tello, “Neural control of vergence eye movements: Neurons encoding vergence velocity”, J. Neurophysiol. 56: 1007-1021, 1986. W. Yuan, J.L. Semmlow, T.L. Alverez and P. Munoz, “A model of motorneuron signal generation in vergence eye movements”, IEEE Trans Biomed Eng., 46:1191–1198, 1999. J.L. Semmlow and W. Yuan, “Adaptive modeification of disparity vergence components: An independent component analysis study”, Invest Ophthalmol Vis. Sci., 43: 2189-2195, 2002. C.M. Harris, J. Wallman and C.A. Scudder, “Fourier analysis of saccades in monkeys and humans”, J Neurophysiol, 63:877-886, 1990. M.R. Harwood, L.E Mezey, C.M. Harris, “The spectral main sequence of human saccades”, J Neurosci, 19:9098-9106,1999.