Conveniently, the conditional densities are also Gaussian: fA|fB â¼ N (µA + KABKâ1. BB(fB â µB),KAA â KABKâ1. BBKBA. ) fB|fA â¼ N (µB + KBAKâ1. AA(fA â µA) ...
Deep Gaussian Processes and Variational Propagation of Uncertainty
Andreas Damianou Department of Neuroscience University of Sheffield
This dissertation is submitted for the degree of Doctor of Philosophy
February 2015
I dedicate this thesis to my family.
Acknowledgements
I would like to thank my supervisor, Prof. Neil Lawrence, for his invaluable guidance, endless support and patience during my studies; for making sure that I focus on the journey, not only on the destination. Neil trusted me with his many great ideas and, at the same time, encouraged me to confidently further develop and explore them in my own ways, always while offering invaluable advice. Overall, he has inspired me both as an academic and as a person and, therefore, I feel very privileged to have worked under his supervision. I am very grateful to Dr Michalis Titsias, who was always keen to discuss matters ranging from high level ideas to small mathematical details. Our close collaboration in the early days of my studies and in the material of Chapter 3 of this thesis meant a lot for the rest of my trajectory. I would like to thank Prof. Carl Henrik Ek; our initial work in material related to Chapter 5 evolved in a miscellany of ideas and an ongoing collaboration and friendship. Thanks to Dr James Hensman for the literally dozens of useful discussions, on matters related to this thesis and not only, throughout the whole period of my studies. Thanks to Prof. Magnus Rattray and to my mentor in Microsoft Research, Dr Ashish Kapoor, for useful discussions. I am grateful to the funding bodies that enabled me to pursue my studies, offering me a scholarship each: the Greek State Scholarships Foundation (IKY) and the University of Sheffield / Moody Endowment Fund. I feel lucky to be part of a motivating group in Sheffield within the unique environment of SITraN. A big thanks to all of my current and past lab mates, too many to mention each separately; they all made this an unforgettable experience in so many ways. A special thanks to those who helped in particular ways (discussions, proofreading sections) with the development of this thesis. Alphabetically: Zhenwen Dai, Nicoló Fusi, Alfredo Kalaitzis, Ricardo Andrade Pacheco, Alan Saul, Max Zwiessele. A big thanks to my family, for sending their love and support from miles away and for being the first teachers of my life. This thesis is dedicated to them: my parents, Babis and Ritsa, my brother, Lefteris, my grandmother “γιαγι´ a Eλ´ ϵνη”; also to the memory of my loving grandfather, “παππo´ υ ς Λϵυτ ϵ´ρης”, who always inspired me to be a better person. Last but certainly not least, a big thanks to Alessandra, for being by my side and reminding me that happiness is in the simple things.
Abstract
Uncertainty propagation across components of complex probabilistic models is vital for improving regularisation. Unfortunately, for many interesting models based on non-linear Gaussian processes (GPs), straightforward propagation of uncertainty is computationally and mathematically intractable. This thesis is concerned with solving this problem through developing novel variational inference approaches. From a modelling perspective, a key contribution of the thesis is the development of deep Gaussian processes (deep GPs). Deep GPs generalise several interesting GP-based models and, hence, motivate the development of uncertainty propagation techniques. In a deep GP, each layer is modelled as the output of a multivariate GP, whose inputs are governed by another GP. The resulting model is no longer a GP but, instead, can learn much more complex interactions between data. In contrast to other deep models, all the uncertainty in parameters and latent variables is marginalised out and both supervised and unsupervised learning is handled. Two important special cases of a deep GP can equivalently be seen as its building components and, historically, were developed as such. Firstly, the variational GP-LVM is concerned with propagating uncertainty in Gaussian process latent variable models. Any observed inputs (e.g. temporal) can also be used to correlate the latent space posteriors. Secondly, this thesis develops manifold relevance determination (MRD) which considers a common latent space for multiple views. An adapted variational framework allows for strong model regularisation, resulting in rich latent space representations to be learned. The developed models are also equipped with algorithms that maximise the information communicated between their different stages using uncertainty propagation, to achieve improved learning when partially observed values are present. The developed methods are demonstrated in experiments with simulated and real data. The results show that the developed variational methodologies improve practical applicability by enabling automatic capacity control in the models, even when data are scarce.
Contents List of Figures
xiii
List of Tables
xvii
Notation
1
1
Introduction
3
1.1
Outline of the Thesis . . . . . . . . . . . . . . . . . . . . . . . . . .
4
1.2
Associated Publications and Software . . . . . . . . . . . . . . . . .
6
2
Gaussian processes
9
2.1
9
2.1.1
From Gaussian Distributions to Gaussian Processes . . . . . . 10
2.1.2
From Bayesian Regression to Gaussian Processes . . . . . . . 14
2.1.3
Covariance Functions
2.1.4
Latent Inputs . . . . . . . . . . . . . . . . . . . . . . . . . . 17
2.1.5
Uncertain Inputs . . . . . . . . . . . . . . . . . . . . . . . . 20
. . . . . . . . . . . . . . . . . . . . . 15
2.2
Sparse Gaussian Processes . . . . . . . . . . . . . . . . . . . . . . . 20
2.3
Variational Sparse Gaussian Processes - a Unified View
2.4 3
Preliminary . . . . . . . . . . . . . . . . . . . . . . . . . . . . . . .
. . . . . . . 23
2.3.1
The Preliminary Variational Bound L ≤ log p(Y|U, X) . . . 25
2.3.2
Marginalisation of the Inducing Outputs . . . . . . . . . . . . 27
2.3.3
Collapsing the Inducing Variational Distribution . . . . . . . 29
2.3.4
Comparison of the Sparse Methods . . . . . . . . . . . . . . 30
Discussion . . . . . . . . . . . . . . . . . . . . . . . . . . . . . . . . 32
Variational Marginalisation of Latent Variables in Gaussian Process Models 35 3.1
Background . . . . . . . . . . . . . . . . . . . . . . . . . . . . . . . 36
3.2
Gaussian Processes with Latent Variables as Inputs . . . . . . . . . . 41
x
Contents
3.3
3.4
3.5
3.6 4
3.2.1
Different Latent Space Priors and GP-LVM Variants . . . . . 41
3.2.2
Drawbacks of the MAP Training Procedure . . . . . . . . . . 42
Variational Gaussian Process Latent Variable Models . . . . . . . . . 44 3.3.1
Standard Variational Bayesian Inference . . . . . . . . . . . 44
3.3.2
Standard Mean Field is Challenging for GP-LVM . . . . . . 45
3.3.3
Tractable Lower Bound by Introducing Auxiliary Variables . . 47
3.3.4
Collapsing the Inducing Variational Distribution . . . . . . . 52
3.3.5
Discussion on the Different Forms of The Variational Bound . 54
3.3.6
Applying the Variational Framework to Different GP-LVM Variants . . . . . . . . . . . . . . . . . . . . . . . . . . . . . 56
3.3.7
Time Complexity and Very High Dimensional Data
Predictions with the Variational GP-LVM . . . . . . . . . . . . . . . 61 3.4.1
Predictions with the Standard Variational GP-LVM . . . . . . 61
3.4.2
Predictions in the Dynamical Model . . . . . . . . . . . . . . 64
Demonstration of the Variational Framework . . . . . . . . . . . . . 65 3.5.1
Covariance Functions . . . . . . . . . . . . . . . . . . . . . . 66
3.5.2
Visualisation Tasks . . . . . . . . . . . . . . . . . . . . . . . 66
3.5.3
Human Motion Capture Data . . . . . . . . . . . . . . . . . . 67
3.5.4
Modeling Raw High Dimensional Video Sequences . . . . . . 70
3.5.5
Class Conditional Density Estimation . . . . . . . . . . . . . 73
3.5.6
Big Data . . . . . . . . . . . . . . . . . . . . . . . . . . . . 75
Discussion . . . . . . . . . . . . . . . . . . . . . . . . . . . . . . . . 76
Uncertain Inputs in Variational Gaussian Processes
85
4.1
Background . . . . . . . . . . . . . . . . . . . . . . . . . . . . . . . 86
4.2
Uncertain Inputs Reformulation of GP Models 4.2.1
4.3
4.4 5
. . . . . 60
. . . . . . . . . . . . 88
Variational (Back)-Constraint . . . . . . . . . . . . . . . . . 89
Gaussian Process Learning with Missing Values . . . . . . . . . . . . 91 4.3.1
Semi-described Learning . . . . . . . . . . . . . . . . . . . . 92
4.3.2
Auto-regressive Gaussian Processes . . . . . . . . . . . . . . 96
4.3.3
Semi-supervised Learning . . . . . . . . . . . . . . . . . . . 99
Discussion and Future Work . . . . . . . . . . . . . . . . . . . . . . 102
Manifold Relevance Determination
103
5.1
Background . . . . . . . . . . . . . . . . . . . . . . . . . . . . . . . 104
5.2
Model . . . . . . . . . . . . . . . . . . . . . . . . . . . . . . . . . . 105 5.2.1
Manifold Relevance Determination . . . . . . . . . . . . . . 106
xi
Contents
5.3
5.4 6
Bayesian Training . . . . . . . . . . . . . . . . . . . . . . . 108
5.2.3
Generalisation to Many Views and Optimization . . . . . . . 109
5.2.4
Inference . . . . . . . . . . . . . . . . . . . . . . . . . . . . 110
Experiments . . . . . . . . . . . . . . . . . . . . . . . . . . . . . . . 111 5.3.1
Toy data . . . . . . . . . . . . . . . . . . . . . . . . . . . . . 112
5.3.2
Yale Faces . . . . . . . . . . . . . . . . . . . . . . . . . . . 112
5.3.3
Pose Estimation and Ambiguity Modelling . . . . . . . . . . 117
5.3.4
Classification . . . . . . . . . . . . . . . . . . . . . . . . . . 119
5.3.5
Multiview Models and Data Exploration . . . . . . . . . . . . 121
5.3.6
Automatic Correlation Learning of Output Dimensions . . . . 126
Conclusions . . . . . . . . . . . . . . . . . . . . . . . . . . . . . . . 128
Deep Learning with Gaussian Processes 6.1
6.2
6.3
6.4 7
5.2.2
131
Background . . . . . . . . . . . . . . . . . . . . . . . . . . . . . . . 133 6.1.1
Function Composition for Deep Learning . . . . . . . . . . . 134
6.1.2
Process Composition . . . . . . . . . . . . . . . . . . . . . . 136
6.1.3
Inference Challenges and Expressiveness . . . . . . . . . . . 137
6.1.4
Model Capacity and Regularization in Deep GPs . . . . . . . 139
6.1.5
Unsupervised Deep Learning . . . . . . . . . . . . . . . . . . 141
Deep Gaussian Processes . . . . . . . . . . . . . . . . . . . . . . . . 142 6.2.1
Probabilistic Definition . . . . . . . . . . . . . . . . . . . . . 143
6.2.2
Variational Inference in Deep GPs Within a Layer
6.2.3
Variational Inference in Deep GPs Across Layers . . . . . . . 147
6.2.4
Supervised Learning . . . . . . . . . . . . . . . . . . . . . . 150
6.2.5
Autoencoders
. . . . . . 145
. . . . . . . . . . . . . . . . . . . . . . . . . 151
Experiments . . . . . . . . . . . . . . . . . . . . . . . . . . . . . . . 152 6.3.1
Toy data . . . . . . . . . . . . . . . . . . . . . . . . . . . . . 153
6.3.2
Unsupervised Learning
6.3.3
Autoencoders . . . . . . . . . . . . . . . . . . . . . . . . . . 162
. . . . . . . . . . . . . . . . . . . . 159
Conclusion and Future Work . . . . . . . . . . . . . . . . . . . . . . 165
Conclusions and Discussion
169
7.1
Summary of Contributions . . . . . . . . . . . . . . . . . . . . . . . 169
7.2
Future Work . . . . . . . . . . . . . . . . . . . . . . . . . . . . . . . 170
References
173
xii
Contents
Appendix A Useful Identities A.1 Gaussian Identities . . . . . . . . . . . . . . . . . . . . . . . . . . . A.2 Matrix Identities . . . . . . . . . . . . . . . . . . . . . . . . . . . . . A.3 Useful Formulae for Derivative . . . . . . . . . . . . . . . . . . . . .
187 187 188 188
Appendix B Variational GP-LVM B.1 Further Details About the Variational Bound . . . . . . . . . . . . B.1.1 Calculating the Explicit Form of q(uj ) . . . . . . . . . . . . B.1.2 Detailed Derivation of Fˆj (q(X)) in Equation (3.23) . . . . B.2 Calculating the {ξ, Ψ, Φ} Quantities . . . . . . . . . . . . . . . . B.3 Derivatives of the Variational Bound for the Dynamical Variational GP-LVM . . . . . . . . . . . . . . . . . . . . . . . . . . . . . . . B.3.1 Derivatives w.r.t the Variational Parameters . . . . . . . . . B.3.2 Derivatives w.r.t θ = (θf , θx ) and β . . . . . . . . . . . . . B.4 Variational Lower Bound for Partially Observed Test Data . . . . . B.4.1 The Variational Bound in the Test Phase and Computational Issues . . . . . . . . . . . . . . . . . . . . . . . . . . . . . B.4.2 Calculation of the Posterior q(FU∗ |X∗ ) of Equation (3.4.1) .
. . . .
191 192 192 193 194
. . . .
195 196 197 198
. 198 . 200
Appendix C Deep Gaussian Processes C.1 Bound on the marginal likelihood . . . . . . . . . . . . . . . . . . . C.1.1 The preliminary bound for the deep GP . . . . . . . . . . . . C.1.2 The Final Form of the Bound . . . . . . . . . . . . . . . . . .
201 201 202 203
List of Figures 1.1
Example graph representing a probabilistic model. . . . . . . . . . .
4
2.1 2.2 2.3 2.4
GP fit example . . . . . . . . . . . . . . . . . . . . . . . . . . . . One dimensional samples drawn from different covariance functions. 2D samples drawn from a EQ plus EQ-periodic cov. function. . . . GPs and inducing variable GPs. . . . . . . . . . . . . . . . . . . .
. . . .
13 17 18 31
A Gaussian distribution propagated through a non-linear mapping. . . Manifold mapping illustration: 2D to 3D. . . . . . . . . . . . . . . . GP-LVM and variational GP-LVM graphical models. . . . . . . . . . Left: The squared inverse lengthscales found by applying the variational GP-LVM with ARD EQ kernel on the oil flow data. Right: Results obtained for the standard GP-LVM with q = 10. These results demonstrate the ability of the variational GP-LVM to perform a “soft” automatic dimensionality selection. The inverse lengthscale for each dimension is associated with the expected number of the function’s upcrossings in that particular direction (dimension); smaller values denote a more linear behaviour, whereas values close to zero denote an irrelevant dimension. For the variational GP-LVM, figure (a) suggests that the non-linearity is captured by dimension 2, as also confirmed by figure 3.5a. On the other hand, figure (b) demonstrates the overfitting problem of the GP-LVM which is trained with MAP. . . . 3.5 Var. GP-LVM, oil data experiment: latent spaces. . . . . . . . . . . . 3.6 Var. GP-LVM, mocap experiment: discovered latent spaces. . . . . . 3.7 Var. GP-LVM, mocap experiment: lengthscales . . . . . . . . . . . . 3.8 Var. GP-LVM, mocap experiment: predictions visualisation example. 3.9 Dyn. var. GP-LVM, video reconstruction example 1 (“Missa” data). . 3.10 Dyn. var. GP-LVM, video reconstruction example 2 (“Missa” data). . 3.11 Dyn. var. GP-LVM, video reconstruction example 3 (“Ocean” data). . 3.12 Dyn. var. GP-LVM, video reconstruction example 4 (“dog” data). . .
37 38 48
3.1 3.2 3.3 3.4
68 68 70 71 72 74 78 79 80
xiv
List of Figures 3.13 3.14 3.15 3.16
Dyn. var. GP-LVM, “dog data” experiment: lengthscales. . . . Dyn. var. GP-LVM, video extrapolation example (“dog” data). Stochastic var. GP-LVM: adaptive steplength (big data). . . . . Stochastic var. GP-LVM: latent space projections (big data). .
. . . .
. . . .
81 82 83 83
4.1
Graphical models for uncertain and partially observed inputs; semisupervised and variational (back)-constraint approaches. . . . . . . Semi-described GP: partially missing inputs experiment. . . . . . . Semi-described GP: partially missing inputs experiment. . . . . . . [Auto-regressive GPs: Iterative prediction for a chaotic timeseries. . Semi-supervised GP: partially missing outputs experiment. . . . . .
. . . . .
89 94 95 98 100
4.2 4.3 4.4 4.5 5.1
. . . .
. . . .
5.13 5.14 5.15 5.16
Manifold Relevance Determination graphical model, compared with older approaches. . . . . . . . . . . . . . . . . . . . . . . . . . . . . MRD applied to toy data. . . . . . . . . . . . . . . . . . . . . . . . . “Yale Faces” data generation procedure. . . . . . . . . . . . . . . . . MRD: Relevance weights for the Yale faces experiment. . . . . . . . MRD: Latent projections for the Yale faces experiment. . . . . . . . . Variational GP-LVM applied to one of the views of the Yale faces data: ARD weights and latent projections. . . . . . . . . . . . . . . . MRD, Yale Faces experiment: novel outputs obtained after structured sampling of the latent space. . . . . . . . . . . . . . . . . . . . . . . MRD, Yale Faces experiment: correspondence problem solution. . . . MRD, human pose epxeriment: ambiguity example. . . . . . . . . . . MRD, human pose experiment: predictions examples. . . . . . . . . . Accuracy obtained after using MRD as a generative classifier. . . . . . Latent space projection and weights for the MRD classification experiment. . . . . . . . . . . . . . . . . . . . . . . . . . . . . . . . . Two example frames of the AVletters dataset. . . . . . . . . . . . . . MRD, “AVletters” experiment 1 (16 views): optimised ARD weights. MRD, “AVletters” experiment 2 (3 views): optimised ARD weights. . Fully independent MRD experiment. . . . . . . . . . . . . . . . . . .
6.1 6.2 6.3 6.4 6.5 6.6
A deep Gaussian process with two hidden layers (compact depiction). Samples from a deep GP showing the generation of features. . . . . . Samples from a deep GP shown for each of the 3 stacked layers. . . . Deep GP graphical model . . . . . . . . . . . . . . . . . . . . . . . . Deep GP, step function demo: posterior visualisation. . . . . . . . . . Deep GP, step function demo: sample path visualisation. . . . . . . .
5.2 5.3 5.4 5.5 5.6 5.7 5.8 5.9 5.10 5.11 5.12
107 113 114 114 115 115 116 117 118 120 122 123 123 124 125 128 137 139 144 146 154 155
xv
List of Figures 6.7 6.8 6.9 6.10 6.11 6.12 6.13 6.14 6.15
Deep GP, step function demo: warping functions. . . . . . . . . Deep GP: toy regression demo. . . . . . . . . . . . . . . . . . . Deep GP: Toy manifold discovery problem. . . . . . . . . . . . Deep GP: Digits experiment (ARD weights). . . . . . . . . . . Deep GP: Digits experiment (manifold). . . . . . . . . . . . . . Deep GP: Digits experiment (samples). . . . . . . . . . . . . . Deep GP: motion capture experiment (model and ARD weights). Deep GP: motion capture experiment (latent space projections). Visualisation of autoencoders’ results. . . . . . . . . . . . . . .
. . . . . . . . .
. . . . . . . . .
. . . . . . . . .
156 157 158 160 161 162 163 164 167
List of Tables 3.1 3.2 3.3
Variational GP-LVM: Results for the mocap experiment. . . . . . . . 73 Dynamical var. GP-LVM: Results for the video experiment . . . . . . 73 The test error made in the whole set of 2007 test points by the variational GP-LVM, 1-vs-all Logistic Regression, SVM classification and two types of GP classification. . . . . . . . . . . . . . . . . . . . . . 75
4.1
Mean squared and mean absolute error obtained when extrapolating in the chaotic time-series data. GPuncert refers to the basic (moment matching) method of Girard et al. [2003] and the “naive” autoregressive GP approach is the one which does not propagate uncertainties. . 99
5.1 5.2 5.3 5.4
MRD, human pose experiment: MSE and comparisons. . . . . . . View/row split for the first ‘AVletters’ experiment. . . . . . . . . . View/row split for the second ‘AVletters’ experiment. . . . . . . . RMSE for test predictions on “AVletters”: MRD and comparisons.
6.1
Qualitative analysis of autoencoders. . . . . . . . . . . . . . . . . . . 165
. . . .
. . . .
121 124 125 126
Notation Indexing Vectors: A vector t ∈ ℜn is indexed as: t = [t1 , t2 , · · · , tn ]⊤ . Random Variables in Matrices Let X ∈ ℜn×q be a matrix x1,1 · · · x1,j containing random variable in . . .. . stantiations. We represent: . .. . · The ith row as a vector xi,: X = xi,1 · · · xi,j · The jth column as a vector xj . . .. .. .. . · The scalar element in ith row and jth column as xi,j xn,1 · · · xn,j
· · · x1,q .. . .. . · · · xi,q .. .. . . · · · xn,q
x⊤ i,:
xj General Matrices and Gram Matrices A1,1 . . In the case of a general matrix (or . a Gram matrix), the indexing is as A = Ai,1 above but the upper case is main . .. tained. An,1
· · · A1,j .. .. . . · · · Ai,j .. . .. . · · · An,j Aj
3D Tensors A single index specifies the order of the 2D matrix (slice) within the tensor. Subsequent indexing within a selected 2D slice is done as for general matrices.
· · · A1,q .. . .. . · · · Ai,q .. .. . . · · · An,q
A⊤ i,:
2
Notation
Random Variables in Deep Models Indexing is done exactly as in the (1,j) (1,1) cases mentioned above. Howhℓ · · · hℓ ever, all subscripts are turned .. .. .. . . . into superscripts. This conven (i,1) (i,j) tion is made so that the sub- Hℓ = · · · hℓ hℓ . .. script is now used to reference a . .. .. . specific layer of the deep model (n,1) (n,j) hℓ · · · hℓ (e.g. Hℓ is the collection of instantiations for the ℓth layer).
(1,q)
· · · hℓ .. . .. . (i,q) · · · hℓ .. .. . . (n,q) · · · hℓ
(h(i,:) )⊤ ℓ
(j)
hℓ
Graphical models Node style
Associated with a distribution
Observed instantiations exist
Xu
×
×
t
×
X Y
×
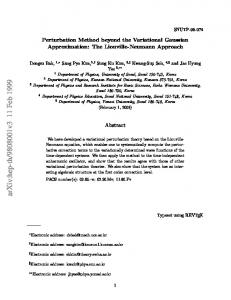
Chapter 1 Introduction For decades, significant advances in the field of computer science were associated with algorithms which memorised data and executed pre-defined commands. In contrast, the field of modern artificial intelligence seeks solutions that allow machines to “understand” and “learn”. In the field of machine learning, these challenges are often solved using probabilistic models. In a probabilistic framework, data understanding is achieved by separating signal from noise and by removing redundancies in complex and noisy data. To further achieve learning, the probabilistic model is required to generalise beyond the observations, that is, allow the machine to “reason” about novel data. The concepts of uncertainty and noise are fundamental in probabilistic modelling. Computational constraints restrict us to define probabilistic models that are only a crude simplification of the complex reality. Therefore, uncertainty is introduced by our specific modelling assumptions. For example, the graph of figure 1.1 (modified from Lawrence [2013]) represents only one of many possible ways of modelling populations’ health1 . Imperfect data collection also introduces uncertainty into the learning framework. Indeed, real-world data are noisy and potentially censored, as can be seen in the example of figure 1.1. Motivation: Uncertainty Propagation and Regularisation This thesis focuses on probabilistic approaches that solve the data understanding and generalisation challenges within the same model, so that uncertainty is handled in a coherent and principled way. The unknowns included in the probabilistic models of interest are treated in a Bayesian manner, according to which priors are employed 1
It is highlighted that this graph only constitutes a running example for motivating this section and is not associated with the applications carried out in the thesis.
4
Introduction time
(epi)genomics environment fully observed
gene expresssion
survival analysis
social network data
clinical measurements & treatments biopsy
x-ray
unobserved (latent) partially observed observed but uncertain (approximate observation)
blood test
Fig. 1.1: Example graph representing a probabilistic model. Arrows represent (potentially) causal directions (probabilistic mappings) and circles represent random variables.
to weight all possible outcomes. The resulting posterior distributions encode the uncertainty in our estimates. Gaussian processes, as distributions over functions, use this mechanism together with observed data to learn functional relationships between variables. However, in complex models two main issues hinder the application of principled uncertainty handling: firstly, propagating probabilities (rather than point estimates) through non-linear functions is intractable for the most interesting cases. For example, the uncertainty associated with our estimate of the missing values of (epi)genotype, in figure 1.1 cannot be analytically propagated towards the leaf nodes of the graph if non-linear Gaussian processes govern the intermediate layers’ mappings. Secondly, regularisation issues arise. Out of all the possible solutions to learn for the unknowns, we wish to obtain one that generalises well while being strongly supported by observations. A well regularised model avoids parameter explosion and overfitting.
1.1
Outline of the Thesis
From a modelling perspective, the main contribution of the thesis is to define probabilistic structures that allow for learning rich representations from observed data in both, supervised and unsupervised learning. The models consider random variables that can be latent or associated with (potentially partial) observations. Gaussian process (GP) mappings are employed to learn the variables’ interactions in a datadriven, non-parametric and Bayesian fashion. Specifically, Chapter 3 is concerned with single layered latent variable models for dimensionality reduction. These models are extended for dynamical systems’ modelling (Chapter 3), for semi-described and semi-supervised learning (Chapter 4) and for multi-view learning (Chapter 5).
1.1 Outline of the Thesis
5
Although these models are useful in their own right, in Chapter 6 they are further extended and combined to form a generic, nested Gaussian process model. We call the resulting model a deep Gaussian process. The previously discussed models can then be seen as special cases of a deep Gaussian process. From a technical perspective, this thesis provides the mathematical framework (based on variational inference) and algorithms that allow for efficient learning and regularisation in the considered probabilistic constructions. This is essential, because uncertainty is required to be propagated across the different nodes of the probabilistic models and across the different stages of the developed algorithms. However, straightforward uncertainty propagation in the considered models is computationally and mathematically intractable, due to the non-linear relationships between variables. In detail, the rest of the thesis is structured as follows: • Chapter 2 constitutes a brief introduction to Gaussian processes. A special focus and a unifying view is given for a set of variational approaches in the context of sparse Gaussian processes. • Chapter 3 considers the case where the inputs to a GP are latent variables, as in the GP-LVM [Lawrence, 2005]. Starting from the Bayesian GP-LVM [Titsias and Lawrence, 2010; Damianou et al., 2015], this chapter is concerned with deriving the variational inference framework that allows for approximate marginalisation of the latent variables. The resulting variational bound is examined carefully. A unified model is then presented and referred to as variational GP-LVM. This model can additionally account for correlated posteriors over the latent space. Dynamical, warped or autoencoder models can then be obtained as special cases. Automatic relevance determination techniques are shown to enable automatic capacity control in the model. In the context of the running example of figure 1.1, this mechanism corresponds to switching off nodes that are irrelevant to the next layer. • Chapter 4 has two objectives: firstly, to define a new type of learning, referred to as semi-described learning, where the inputs to a Gaussian process regression problem are partially observed. This comes in contrast to the more traditional semisupervised learning task, where the missing values occur in outputs. Secondly, this chapter aims to extend the variational framework and develop algorithms that allow for semi-described and semi-supervised learning with Gaussian processes. An auto-regressive Gaussian process is also defined as a special case. • Chapter 5 defines manifold relevance determination (MRD), a latent variable model which incorporates observations from several views. A Bayesian training frame-
6
Introduction work penalises information redundancy in the latent space, so that the latent space is automatically segmented into parts that are private to subsets, or relevant to all views. This mechanism corresponds to switching off connections in a graphical model like the one shown in figure 1.1. MRD can be used as a data exploration tool, e.g. to discover signal that is common in heterogeneous but related data, such as biopsy and x-ray. MRD can also be used as an inference tool, since information can be transferred between views through the structured latent space.
• Chapter 6 defines and examines deep Gaussian processes (deep GPs). Deep GPs consider layers of random variables, as illustrated in figure 1.1, and structurally resemble deep neural networks. However, deep GPs are formed by nested process (rather than function) composition, rendering them non-parametric. For example, in a five layer model we have f (X) = g5 (g4 (g3 (g2 (g1 (X))))), where each gi (·) is a draw from a Gaussian process. This results in a powerful class of models that is no longer equivalent to a Gaussian process. In contrast to other deep models all the uncertainty in parameters and latent variables is marginalised out. This is achieved by extending the variational methodology to allow for uncertainty propagation between layers. When combined with the structure learning methods described in previous chapters (e.g. MRD, semi-described learning, autoencoders), deep GPs have the potential to learn very complex, non-linear interactions between data in both, supervised and unsupervised learning tasks. • Chapter 7 summarizes the key contributions of the thesis and discusses ideas for future work.
1.2
Associated Publications and Software
The work presented in Chapter 3 borrows text from [Damianou et al., 2011] and [Damianou et al., 2015], both authored by A. Damianou, M. Titsias (joint first author in the latter) and N. Lawrence. The ideas presented in the latter paper constitute an evolution of the initial publication of Titsias and Lawrence [2010]. The paper of Dai et al. [2014] is co-authored by myself and related to Chapter 3, but text from it was not used in this thesis. The methodology and experiment related to big data, in Chapter 3, correspond to work carried out by J. Hensman, A. Damianou and N. Lawrence and appears in [Hensman et al., 2014a]. The work presented in Chapter 4 is based on two papers: [Damianou and Lawrence, 2015, 2014], both by A. Damianou and N. Lawrence.
1.2 Associated Publications and Software
7
The work presented in Chapter 5 is based on: a) [Damianou et al., 2012], by A. Damianou, C. H. Ek, M. Titsias and N. Lawrence b) on a paper by Damianou, Ek and Lawrence, which is in preparation at the time of writing this thesis. The work presented in Chapter 6 is based on a paper by Damianou and Lawrence [2013]. A more extended publication is in preparation at the time of writing this thesis, and constitutes a collaboration between A. Damianou, J. Hensman and N. Lawrence. Finally, two publications [Vasisht et al., 2014; Zhang et al., 2013] co-authored by myself are not discussed in this thesis since, although relevant to the general research area, they do not fit with the thesis’ theme. The software developed to accompany the methods described in chapters 3, 4 and 5 is publicly available under a unified repository at https://github.com/SheffieldML/v argplvm and it is based on N. Lawrence’s GPmat repository. The software developed for deep GPs (Chapter 6) is also publicly available at https://github.com/SheffieldML /deepGP. The above two repositories are managed primarily by myself; all authors’ contributions are shown in the corresponding copyright notes. Besides, the code for the experiment of Section 3.5.6 used GPy (https://github.com/SheffieldML/GPy). Illustrative summaries and demonstrations for part of this thesis can be found at: http://git.io/A3Uv and http://git.io/A51g.
Chapter 2 Gaussian processes A Gaussian process (GP) can be seen as a distribution over functions. Numerous problems in the domain of regression, classification, dimensionality reduction and more involve learning unknown functions, f , which are often expressed as mappings. A particular interpretation of the “no free lunch theorem” states that in most typical scenarios we can only do inference after first making some, even general, assumptions regarding the nature of the function f . These assumptions can be encoded in a GP prior which, coupled with an optimisation procedure, will result in a posterior process associated with a function that best “fits” the data. Certain tractability properties of GPs mean that the optimisation procedure can be incorporated in a Bayesian framework and, hence, enjoy automatic complexity control where unnecessarily complex solutions are penalised. In Section 2.1 we introduce Gaussian processes more formally. Due to computational reasons, in practice sparse GPs are usually used, and the associated methods are reviewed in Section 2.2. A particular subclass of sparse GP approaches revolve around variational inference. Since these approaches are key to the development of much of the methodology associated with this thesis, they are discussed separately, in Section 2.3.
2.1
Preliminary
This section will introduce Gaussian processes, firstly from the perspective of taking the limit of a multivariate Gaussian distribution to infinite dimensions (Section 2.1.1) and then from the Bayesian regression perspective (Section 2.1.2). Section 2.1.3 discusses covariance functions and Sections 2.1.4 and 2.1.5 discuss the special cases where the GP inputs are not fully observed.
10
2.1.1
Gaussian processes
From Gaussian Distributions to Gaussian Processes
Gaussian distributions constitute very popular machine learning tools. This is not only due to their natural emergence in real life statistical scenarios (e.g. central limit theorem) but also due to their intuitiveness and the fact that they are equipped with properties that render their mathematical manipulation tractable and easy. For example, consider a set of n random variables with a Gaussian joint distribution: f = {fi }i∈X ∼ N (µ, K), where X is a sorted set of indices with |X | = n and fi is the value of the variable indexed by xi . The random variable fi can represent the concentration of a particular substance measured by placing the measuring instrument at depth xi from a given location of the surface of a lake. Correlating these measurements under the Gaussian assumption means that the concentration measured at nearby depths xi−1 and xi+1 should be similar and this strong correlation should be reflected in the Ki,i+1 and Ki,i−1 entries of the covariance matrix. The marginalisation property of the normal distribution says that, for two subsets XA , XB ⊆ X , the marginals are also Gaussian: Z p(fA , fB )dfB = N (fA |µA , KAA )
p(fA ) = fB
Z p(fA , fB )dfA = N (fB |µB , KBB ) ,
p(fB ) = fA
where fA and fB are vectors and we used the decomposition "
µA µ= µB
#
"
# KAA KAB and K = . KBA KBB
Conveniently, the conditional densities are also Gaussian: � −1 fA |fB ∼ N µA + KAB K−1 BB (fB − µB ), KAA − KAB KBB KBA � −1 K . fB |fA ∼ N µB + KBA K−1 (f − µ ), K − K K A A BB BA AB AA AA
(2.1)
In the lake example given before, the second conditional density of equation (2.1) could be used so that the substance concentration is inferred in locations XB if we have only collected measurements in locations XA . The covariance function allows us to perform a “sophisticated” interpolation on the measurements, based on the closeness of the locations contained in sets XA and XB . In a real world modelling scenario, however, instead of pre-selecting a discrete set of input locations, X , we would rather prefer to take into account the whole input domain. Gaussian processes can be used for this purpose.
11
2.1 Preliminary
A Gaussian process (GP) is a generalisation of the multivariate Gaussian distribution to an infinite number of dimensions (random variables). A sample from a GP is a random function, by extension to how a sample from a n-dimensional Gaussian distribution is a n-dimensional vector. A Gaussian distribution is fully specified by its (finite dimensional) mean vector µ and covariance matrix K evaluated on inputs indexed by a finite set X ; similarly, a GP is fully specified by its mean and covariance functions, µ(x) and kf (x, x′ ) respectively, which can be evaluated at any position of an infinite input domain (e.g. X := ℜ). The expressive power of Gaussian processes as distributions over functions is conveniently coupled with tractability, as the marginalisation property of Gaussian distributions allows us to only work with the finite set of function instantiations f = f (x) = [f (x1 ), f (x2 ), · · · , f (xn )] which constitute our observed data and jointly follow a marginal Gaussian distribution. This definition directly implies that all other (possibly infinite) function values corresponding to unseen inputs are just marginalised. More formally: Definition 1. A Gaussian process is a collection of random variables, any finite number of which have a joint Gaussian distribution. We write: f ∼ GP(µ(x), kf (x, x′ )) µ(x) = E [f (x)] kf (x, x′ ) = E [(f (x) − µ(x)) (f (x′ ) − µ(x′ ))] . But what about the mean and covariance function of the above GP? In the modelling scenarios discussed throughout this thesis it is safe to select µ(x) = 0, unless otherwise stated. This is a typical choice in many stationary modelling scenarios1 that allows the process to be described solely by its second order statistics, i.e. the covariance function. The covariance function can be selected to have a parametric form which depends on a set of parameters θf . This covariance function can map arbitrary inputs from the input domain to the corresponding entry in the covariance function. More intuition and details on covariance functions is given in section 2.1.3. In a realistic modeling scenario one needs to only evaluate the covariance function on a finite set of inputs. Then, this inherently infinite model specifies a finite Gaussian distribution for the training data, immediately assuming that the rest of the 1
This is without loss of generality, since a constant GP mean can equivalently be incorporated by simply shifting the data.
12
Gaussian processes
input domain is marginalised out. The covariance matrix is built by evaluating the covariance function on the finite set of n inputs, so that we can write: −n 2
p(f |x) = N (f |0, Kf f ) = (2π)
− 12
|Kf f |
�
1 exp − f ⊤ K−1 ff f 2
� ,
(2.2)
where Kf f = kf (x, x) is found by evaluating the covariance function on the n training inputs. Notice that, for clarity, we have dropped the dependence on the kernel parameters θf from p(f |x, θf ) and this simplification will be carried on in the rest of the thesis. Using Gaussian processes to model our previously described hypothetical scenario would allow us to consider a finite set of training inputs and outputs (measurements), x and f respectively, and then use equation (2.1) to infer the concentration f∗ of the substance at any depth x∗ . In real world applications it is typical to assume that we can only observe noisy measurements y of the true value f , according to: � y = f (x) + ϵ, ϵ ∼ N 0, β −1 I .
(2.3)
This induces the likelihood: � p(y|f ) = N y|f , β −1 I
(2.4)
that turns the function values f into latent variables for which the posterior distribution can be straightforwardly computed. The above form also gives rise to the predictive distribution for a collection of n∗ test inputs x∗ : �−1 p(f∗ |y, x, x∗ ) = N (f∗ |Ly, K∗∗ − LKf ∗ ) , where: L = K∗f Kf f + β −1 I , which comes directly from the Gaussian conditional distribution of equation (2.1) with the incorporation of noise. Here, K∗∗ = kf (x∗ , x∗ ) is the covariance between the test targets (computed at test inputs), K∗f = kf (x∗ , x) is the cross-covariance between the training and test targets and Kf ∗ = K⊤ ∗f . The usefulness of Gaussian processes in practical scenarios comes from the tractability of the marginal likelihood of the observed outputs given the observed inputs: Z p(y|x) =
� p(y|f )p(f |x)df = N y|0, Kf f + β −1 I .
(2.5)
The above marginalisation results in a modelling setting where a whole family of functions are simultaneously considered. The selected covariance function kf defines
13
2.1 Preliminary
(a) Samples from the prior
(b) Samples from the posterior
(c) Same as (b) but with larger noise variance β −1
(d) Samples from the posterior when more points are observed
Fig. 2.1: A GP fitting the observed data (x’s). The GP mean is represented as a black curve and 2 standard deviations are shown as gray shading. Samples from this GP are plotted with various colors. Notice that even when the mean reverts to zero away from observations, the samples still fluctuate.
the properties (such as smoothness) and not a parametric form of f . In this setting, the Gaussian process can be used as a prior over the latent function f . Conditioning this prior on observed data results in a posterior that “fits” the data. This procedure is illustrated in figure 2.1. In a realistic modelling scenario one seeks to improve the data fit by optimising the objective function (2.5) with respect to θf and β, following the standard maximum likelihood procedure. The parameters θf of the covariance function are referred to as hyperparameters with respect to the noise model. By expanding the marginal distribution as: p(y|x) = (2π)
−n 2
� � 1 Kf f + β −1 I − 2 exp − 1 y⊤ (Kf f + β −1 I)−1 y 2
we identify the dual purpose of this objective function: the determinant penalizes complex models, hence guarding against overfitting, whereas the exponential promotes a good fit to the data.
14
2.1.2
Gaussian processes
From Bayesian Regression to Gaussian Processes
Gaussian processes can also be considered as the non-parametric variant of Bayesian parametric regression. The standard parametric model for regression specifies: y = ϕ(x)⊤ w + ϵ, where ϕ(x) is a vector of basis functions which maps the inputs nonlinearly to a fea�⊤ ture space. For example ϕ(x) = 1, x, x2 , · · · , xk maps the inputs to the curve of a k degree polynomial, while ϕ(x) = x recovers linear regression. The vector w constitutes a set of weight parameters that are sought to be adjusted to fit the data. As is standard in the Bayesian methodology, rather than finding a maximum a posteriori (MAP) solution for w, we wish to place a prior over these parameters and integrate them out, essentially weighting the contribution of every possible set of parameters according to our prior. Considering Gaussian noise ϵ with variance β −1 and a conjugate Gaussian prior for w, allows us to perform the integration analytically: Z p(y|x) =
p(y|w, ϕ(x))p(w)dw Z
=
� N y|ϕ(x)⊤ w, β −1 I N (w|0, Σw ) dw.
This is exactly analogous to the Gaussian process approach discussed earlier, for which the marginal likelihood is shown in equation (2.5). The difference is that Bayesian parametric regression considers a parametric form ϕ(x)⊤ w for the model and places a prior on the parameters. In contrast, a GP approach specifies a prior for the function directly. This results in richer and more flexible models, since the GP prior only implies constraints for the properties of the modelled functions, while their form emerges probabilistically from the data and our assumptions, which are encoded in the choice of a covariance function. Notice that if we were to describe the above Bayesian regression framework using the function space view (to explore the similarity with the GP approach), we would find that the covariance function Kf f (x, x′ ) implied is the inner product ϕ(x)⊤ Σw ϕ(x′ ). More details and intuition regarding covariance functions is provided in the next section. For a more thorough explanation of Gaussian processes, the reader is redirected to the books of Rasmussen and Williams [2006]; Bishop [2006]; MacKay [2003], which were used as main sources for the current and following chapter of this thesis.
15
2.1 Preliminary
2.1.3
Covariance Functions
As was discussed in the previous section, the covariance function (sometimes simply referred to as kernel) plays a key role in Gaussian process modelling. A covariance function k is a function that maps pairs of inputs, xi,: and xk,: , into a real value kf (xi,: , xk,: ) and it is a positive semi-definite function over the space of all possible input pairs. Here we have taken the general case where the inputs are multidimensional, i.e. xi,: , xk,: ∈ ℜq , as this will be instructive for later sections. The choice of a particular form for the covariance function encodes our prior assumptions about the function to be modelled, f . The parameters associated with it, θf , constitute a means of obtaining a good fit to the observed data, leading to better posterior and predictive distributions. Figure 2.2 illustrates these concepts graphically by showing samples from different covariance functions and with different parameterisations. The three plots on the first line correspond to samples drawn from an exponentiated quadratic (EQ) covariance function, also known as RBF or squared exponential. This covariance function is infinitely differentiable (hence, appropriate for modelling very smooth functions) and takes the following form: ! q X 1 2 (xi,j − xk,j )2 . kf (EQ) (xi,: , xk,: ) = σEQ exp − 2 2ℓ j=1
(2.6)
2 , and a characteristic lengthscale parameter, ℓ. In It has a variance parameter, σEQ particular, the lengthscale is related to the expected number of upcrossings of the function, effectively controlling how fast its value changes with respect to changes in its input. In the first line of figure 2.2, a EQ covariance function with large lengthscale results in samples which are almost linear. The EQ covariance function can be extended to have as many lengthscales as input dimensions. For convenience, we will denote wj = 1/ℓ2j and refer to this parameter either as a “weight” or as a “squared inverse lengthscale”. We can now write this covariance function as:
kf (ARD) (xi,: , xk,: ) =
2 σARD
! q 1X 2 wj (xi,j − xk,j ) . exp − 2 j=1
(2.7)
This form allows for an automatic relevance determination (ARD) procedure to take place during learning [MacKay, 1994; Neal, 1996; Rasmussen and Williams, 2006]. Informally, the directions j of the input x that are associated with very small “relevant” variance (in terms of corresponding correlation in the function values) are naturally assigned a very large lengthscale and, thus, small weight wj . This provides
16
Gaussian processes
a means of automatically assessing the “relevance” of every input feature. The linear ARD covariance function takes the form: 2 x⊤ kf (lin) (xi,: , xk,: ) = σlin i,: Cxk,: ,
(2.8)
where C is a diagonal matrix involving the ARD weights. Another covariance function that will be used is the Matérn 3/2. Compared to the EQ covariance function, the Matérn 3/2 results in “rougher” samples, due to being only once differentiable. √ 2 kf (mat) (xi,: , xk,: ) = σmat
1+
3|xi,: − xk,: | ℓ
! exp
! √ − 3|xi,: − xk,: | . ℓ
(2.9)
A valid covariance function can be obtained by manipulating existing covariance functions in various ways. In the simplest case, one can create a compound covariance function by adding two or more existing ones together. We will see such a use later. Further, we can obtain a valid covariance function by first passing its inputs through another function. MacKay [1998] considered such a construction by mapping single dimensional inputs to a circle, before passing them to a EQ covariance function. We name the resulting covariance function as “EQ-periodic” and its form is given by: kf (per) (xi , xj ) =
2 σper
� � �� 1 2 π |xi − xj | exp − 2 2 sin , ℓ T
(2.10)
where T denotes the period parameter. As can be seen in figure 2.2(e), this covariance function produces samples that are repeated exactly every period. On the other hand, one can obtain a covariance function which exhibits approximate periodicity, in the sense that a drift away from the periodic pattern can be taken into account. One way to achieve this, is to multiply the periodic covariance function described above with a EQ one. Here, we will consider a simpler case where we just add them. This allows us to control the relative effect of the EQ or the EQ-periodic covariance function by fixing the ratio of their variances to the desired value. The effect of this ratio in the above construction is graphically explained in figure 2.3. It is a typical policy to consider a white noise covariance function as part of a compound one: kf + kwhite , with: kwhite (xi,: , xk,: ) = θwhite δi,k ,
(2.11)
where δi,k is the Kronecker delta function. This guards against overfitting, by incorporating our prior assumption that, in real world data, random fluctuations can occur
17
2.1 Preliminary
(a) Exp. Quadratic, 1/l2 = 0.2
(b) Exp. Quadratic, 1/l2 = 1
(c) Exp. Quadratic, 1/l2 = 12
(d) Matérn 3/2
(e) EQ-Periodic
(f) EQ plus EQ-Periodic
Fig. 2.2: One dimensional samples drawn for different kernels with their associated covariance matrices.
even in very smooth underlying functions, especially since finite data are used for learning. Further, the incorporation of this term ensures positive definite covariance matrices in computer implementations where numerical problems arise. Similarly, one can also include a bias term θbias 1.
2.1.4
Latent Inputs
Gaussian processes have also been used in unsupervised learning and dimensionality reduction scenarios. These scenarios are typically associated with multivariate variables where the output dimensionality p can even be much larger than n. Throughout this thesis, multi-dimensional variables will be collected in matrices where rows correspond to instances and columns correspond to dimensions (or features). Therefore, Y ∈ ℜn×p , F ∈ ℜn×p and X ∈ ℜn×q denote the collection of outputs, function evaluations and inputs respectively. xi,: , xj and xi,j refer respectively to the ith row, the
18
Gaussian processes
f2 (x)
f2 (x)
f2 (x)
f1 (x)
(a) Large r
f1 (x)
(b) Intermediate r
f1 (x)
(c) Small r
Fig. 2.3: Two-dimensional samples from a EQ plus EQ-periodic covariance function. The relative “contribution” of each covariance is controlled by fixing the ratio of their variances, 2 2 r = σEQ /σEQ−per .
jth column and the (i, j)th element of Y (and analogously for the other matrices). The main challenge in the unsupervised GP problems is that the input data X are not directly observed. The Gaussian process latent variable model (GP-LVM) [Lawrence, 2005, 2004] provides an elegant solution to this problem by treating the unobserved inputs as latent variables, while employing a product of p independent GPs as prior for the latent mapping: f (X) = (f1 (X), . . . , fp (X)) so that, fj (X) ∼ GP(0, kf (X, X′ )), j = 1, . . . , p.
(2.12)
Here, the individual components of f (X) are taken to be independent draws from a Gaussian process with covariance function kf (X, X′ ). As shown in [Lawrence, 2005] the use of a linear covariance function makes GP-LVM equivalent to traditional PPCA. On the the other hand, when nonlinear covariance functions are considered the model is able to perform non-linear dimensionality reduction. The above formulations allows us to re-write the generative procedure of equation (2.3) as:
yi,j = fj (xi,: ) + ϵi,j ,
� ϵi,j ∼ N 0, β −1 .
The above independence assumptions allow us to write the likelihood of the data given the inputs as:
19
2.1 Preliminary Z p(Y|X) = =
p(Y|F)p(F|X)dF Z Y p n Y
p(yi,j |fi,j )
=
p(fj |X)dF
j=1
j=1 i=1 p Y
p Y
� N yj |0, Kf f + β −1 I ,
(2.13)
j=1
where we made use of equations (2.4) and (2.2) for the distributions appearing in the second line. The factors inside the product in the last line have similar form to that obtained in (2.5) when we assumed single-dimensional variables, but Kf f is now built by evaluating the covariance function on multivariate inputs, i.e. Kf f = kf (X, X). However, these inputs now constitute latent rather than observed random variables and they follow a prior distribution p(X) ≜ p(X|θx ) with hyperparameters θx . The structure of this prior can depend on the application at hand, such as whether the observed data are i.i.d. or have a sequential dependence. Methods for eliciting the prior from expert beliefs also exist [see e.g. Oakley, 2002]. For the moment we shall leave p(X) unspecified to keep our discussion general, while specific forms for it will be given in Section 3.2.1 . As will be discussed in detail in Section 3.3.2, the interplay of the latent variables (i.e. the latent input matrix X and the latent function instantiations F) makes inference very challenging. However, when fixing X we can treat F analytically and marginalise it out to obtain p(Y|X)p(X). This partial tractability of the model gives rise to a straightforward MAP training procedure where the latent inputs X are selected according to XMAP = arg max p(Y|X)p(X). X
This is the approach suggested by Lawrence [2005, 2006] and subsequently followed by other authors [Urtasun and Darrell, 2007; Ek et al., 2008b; Ferris et al., 2007; Wang et al., 2008; Ko and Fox, 2009; Fusi et al., 2013; Lu and Tang, 2014]. Point estimates over the hyperparameters θ = {θf , θx , β} can also be found by maximising the same objective function. However, a MAP training procedure for the latent points means that their uncertainty cannot be propagated through the GP mapping; the distribution of X is collapsed to a delta function after passing through the mapping. This severely hinders the definition of deep or, in general, complicated networks of latent variables. Section 3.2.2 gives more insight into the problems arising from this kind of MAP optimisation. This thesis focuses on techniques that allow for approximate marginalisation
20
Gaussian processes
of the latent space, thus simultaneously providing an approximation to the posterior distribution p(X|Y). A unified approximation framework of this kind is described in Chapter 3 and it is further extended in Chapters 5 and 6 for the case of more complex latent variable structures. In essence, the methodology developed in this thesis allows for treating the inputs to a Gaussian process as stochastic processes, rather than just points or distributions. This will be made clearer in Chapters 3 and 6.
2.1.5
Uncertain Inputs
In many real-world applications it is unrealistic to consider the inputs to a regression model as absolutely certain. For example, when the inputs are measurements coming from noisy sensors, or when the inputs are coming from bootstrapping or extrapolating from a trained regressor. In the general setting, we assume that the actual inputs to the regression model are not observed; instead, we only observe their noisy versions. In this case, the GP methodology cannot be trivially extended to account for the variance associated with the input space [Dellaportas and Stephens, 1995; Girard et al., 2003; Oakley and O’Hagan, 2002; Quiñonero-Candela et al., 2003; Oakley, 1999, 2004; McHutchon and Rasmussen, 2011]. This problem is also closely related to the field of heteroscedastic Gaussian process regression, where the uncertainty in the noise levels is modelled in the output space as a function of the inputs [Kersting et al., 2007; Goldberg et al., 1998; Lázaro-Gredilla and Titsias, 2011]. This thesis tackles the above problem by treating the unobserved inputs as latent variables. Further, marginalising these variables allows for specifying an (approximate) posterior over a full distribution over the inputs. Clearly this relates to the latent variable modelling with GPs discussed in the previous section. In Chapter 4 it will be shown how latent, partially missing and uncertain input modelling can all be unified under a common framework and further define semi-described (a newly introduced term), semi-supervised and auto-regressive GPs as a special case.
2.2
Sparse Gaussian Processes
The way in which Gaussian processes are formulated as non-parametric data driven approaches is responsible for their flexibility but also for their memory and computational limitations. Specifically, the need to invert a n × n covariance matrix Kf f means that a GP has a computational complexity of O(n3 ), making its application to datasets with more than a few thousand datapoints prohibitive. The main line of work in the literature attempting to overcome this limitation is related to sparse approxima-
21
2.2 Sparse Gaussian Processes
tions [Csató and Opper, 2002; Seeger et al., 2003; Snelson and Ghahramani, 2006; Quiñonero Candela and Rasmussen, 2005; Lawrence, 2007b; Titsias, 2009] that are associated with a computational cost of O(nm2 ), m ≪ n. The key idea behind such approaches is to expand the probability space with m pairs of auxiliary (or inducing) input - output pairs of variables, denoted as (xu )i,: and ui,: respectively. These variables are collected in matrices Xu ∈ ℜm×q and U ∈ ℜm×p . Then, the original covariance matrix Kf f is replaced with a low-rank approximation which only requires the inversion of a smaller, m × m covariance matrix. The goal is then to define a good low-rank approximation to the full covariance Kf f and to select a good set of inducing inputs. A common approach is to allow the inducing inputs to lie anywhere in the input domain (rather than constrain them to be a subset of the training inputs) and determine their location with some form of optimisation, as suggested by Snelson and Ghahramani [2006]. The assumed relationship between the variables Xu , U, X and F can give rise to powerful approaches specific to a particular problem at hand [see e.g. Álvarez et al., 2009]. Here, we consider the case where the inducing points Xu and U are assumed to be related in the same way and with the same GP prior as the training instances X and F. Further making use of the factorisation of the GP mapping with respect to dimensions (see equation (2.12)) allows us to write: " p(fj , uj |Xu , X) = N
fj uj
#
" | 0,
Kf f Kf u Kuf Kuu
#! ,
where Kf f is constructed by evaluating the covariance function on all available inputs X, Kuu is built by evaluating the covariance function on the inducing inputs Xu , Kf u is the cross-covariance between X and Xu , and Kuf = K⊤ f u . The above expression comes directly from the marginalisation and consistency properties stated in the GP definition 1 and allows us to further write the marginal GP prior over the inducing Q variables p(U|Xu ) = pj=1 p(uj |Xu ) and the conditional GP prior p(F|U, X, Xu ) = Qp j=1 p(fj |uj , X, Xu ) using: p(uj |Xu ) = N (uj |0, Kuu ) e p(fj |uj , X, Xu ) = N (fj |aj , K), where
(2.14) (2.15)
e = Kf f − Kf u K−1 Kuf and K uu
(2.16)
aj = Kf u K−1 uu uj .
(2.17)
Identifying the conditional independencies above lets us drop the conditioning on Xu
22
Gaussian processes
for the remainder of this section. Further, by making use of the factorisation of the likelihood with respect to dimensions (as shown in equation (2.13)), we can continue with our analysis by only considering a specific output dimension j. Notice that, since the inducing variables were introduced as auxiliary variables, one can marginalise them out and return to the original probability space. Quiñonero Candela and Rasmussen [2005] recognise that in order to obtain an approximation which induces sparsity, one can consider an approximation q(fj |uj , X) to the true conditional p(fj |uj , X). Several sparse approaches in the literature can then be unified under this interpretation, by identifying that each approach is effectively implying different assumptions for q(fj |uj , X), while maintaining the exact p(yj |fj ) and p(uj ). To make this clearer, let us consider the exact case, where q(fj |uj , X) = p(fj |uj , X). Then, by using the Gaussian identity (A.1) and equations (2.14),(2.15) we can find the marginal: Z p(fj |X) =
p(fj |uj , X)p(uj )duj
−1 −1 = N (fj |Kf u K−1 uu 0, Kf f − Kf u Kuu Kuf + Kf u Kuu Kuf ) {z } | {z } | Qf f
Qf f
= N (fj |0, Kf f ) ,
(2.18)
where Qf f denotes Nyström approximation of the true covariance Kf f . The above calculation, as expected, matches exactly equation (2.2). In the non-exact case, we will in general have an approximate posterior �
� e e = e q(fj |uj , X) = N fj |aj , Q , with Q ̸ K and aj given in equation (2.17). By using again the Gaussian identity (A.1) and equation (2.14) we can marginalise out the inducing outputs to obtain: Z q(fj |X) =
�
� e q(fj |uj , X)p(uj )duj = N fj |0, Q + Qf f .
(2.19)
Similarly, by taking into account the noise term we can obtain the approximate likelihood: Z � � e + Qf f + β −1 I . q(yj |X) = p(yj |fj )q(fj , X)dfj = N yj |0, Q (2.20)
e was so far left unspecified, equaEven though the approximate covariance term Q
2.3 Variational Sparse Gaussian Processes - a Unified View
23
tion (2.20) still refers to a Gaussian distribution with a covariance matrix of size n×n (because of the term Qf f ). Therefore, the computational cost of the above expression does not immediately seem to decrease with the inclusion of inducing points. Howe one can use the Woodbury matrix identity and ever, for specific selections of Q, the matrix determinant lemma (equations (A.3) and (A.4) respectively) and obtain expressions that depend on the inversion of a matrix of size m × m. In particular, the deterministic training conditional (DTC) approximation [Csató and Opper, e = 0, implying a deterministic approxima2002; Seeger et al., 2003] assumes that Q tion q(fj |uj , X) = N (fj |aj , 0). By marginalising out the inducing outputs and then taking into account the noise (according to equations (2.19) and (2.20)), we obtain respectively: qDTC (fj |X) = N (fj |0, Qf f ) qDTC (yj |X) = N yj |0, Qf f
(2.21) � + β −1 I .
(2.22)
By contrasting equation (2.21) with the exact expression (2.18), we see that the DTC method is equivalent to modifying the GP prior under the assumption that the covariance matrix equals its Nyström approximation Qf f . However, the Woodbury and Matrix Determinant Lemma can now be applied to obtain an expression that is cheap to evaluate. Specifically, the logarithm of the marginal likelihood can be written as: β n/2 |Kuu | /2 1 n − yj⊤ Wyj , log qDTC (yj |X) = − log(2π) + log 1/2 2 2 |Kuu + βKuf Kf u | 1
−1
where: W = βI − β 2 Kf u (Kuu + βKuf Kf u )
(2.23)
Kuf .
As can be seen, the above expression requires the inversion of a m × m matrix, considerably speeding up computations since, typically, m ≪ n. Another sparse GP approximation, dubbed the “the fully independent training conditional (FITC)” [Snelson and Ghahramani, 2006], similarly assumes that the offdiagonal elements of Kf f equal those of Qf f but additionally corrects the diagonal e = Qf f − diag(Qf f − Kf f ). to be exact, hence Q
2.3
Variational Sparse Gaussian Processes - a Unified View
As discussed in the previous section and also pointed out by Titsias [2009], the aforementioned unified sparse GP framework essentially modifies the GP prior. This im-
24
Gaussian processes
plies that the inducing points act as additional kernel hyperparameters that have to be optimised, hence increasing the danger of overfitting. Instead, in the approach suggested by Titsias [2009] the approximate marginal likelihood q(yj |X) is formulated as a variational lower bound to the exact likelihood p(yj |X). Now the inducing inputs are turned into variational parameters and maximisation of the variational lower bound with respect to them is equivalent to minimising the KL divergence KL (q(fj , uj |X) ∥ p(fj , uj |X, yj )). Specifically, we can write log p(yj |X) = R q(f |u ,X)q(u ) log p(yj |fj )p(fj |uj , X)p(uj )dfj duj from which we multiply with q(fjj |ujj ,X)q(ujj ) inside the integral and apply Jensen’s inequality to obtain: Z log p(yj |X) ≥ Fj =
q(fj |uj , X)q(uj ) log
so that: log p(Y|X) =
p X
p(yj |fj )p(fj |uj , X)p(uj ) dfj duj , q(fj |uj , X)q(uj ) (2.24)
log p(yj |X) ≥
j=1
p X
Fj .
j=1
As can be seen, this variational approach differs from the sparse approaches which directly replace the covariance matrix with a low-rank approximation through assumptions in q(fj |uj , X) and, therefore, modify the GP prior. Instead, the variational approach in general considers a free q(uj ) and the approximation is explicitly made with respect to the true posterior, according to: q(F|U, X)q(U) =
p Y j=1
q(fj |uj , X)q(uj ) ≈
p Y
p(fj |uj , X, yj )p(uj |yj ).
(2.25)
j=1
Different possible assumptions behind the forms of the variational distributions q(uj ) and q(fj |uj , X) as well as their treatment inside the variational bound can lead to different model variants. These variants constitute the basis for much of the methodology developed in this thesis and, therefore, will be explained in detail in the following sections. For a clearer explanation we begin, in Section 2.3.1, with an approximation where U appears in the conditioning set. Therefore, we are able to elaborate on the form of q(fj |uj , X) and, conveniently, leave p(uj ) and q(uj ) out of the discussion. Then, in Section 2.3.2, we discuss the results obtained by additionally integrating out the inducing outputs uj .
25
2.3 Variational Sparse Gaussian Processes - a Unified View
2.3.1
The Preliminary Variational Bound L ≤ log p(Y|U, X)
To start with, we elaborate on the form of q(fj |uj , X) in the variational sparse GP method. Titsias [2009] argues that under the assumption of uj being a sufficient statistic for fj , it holds that p(fj |uj , X) = p(fj |uj , X, yj ), since fj is just a noise-free version of yj . Thus, under the same assumption, an optimal form for q(fj |uj , X) is to set q(fj |uj , X) = p(fj |uj , X), so that the overall approximation will be p(fj |uj , X)q(uj ), matching the true posterior in the first factor (see equation (2.25)). Since the sufficient statistics assumption does not hold in practice, we will in general have q(uj ) ̸= p(uj |yj ) which, as we will see in the next section, will allow us to reach a solution where uj is as informative as possible about fj . Importantly, the above choice for q(fj |uj , X) allows us to marginalise out the GP mapping f by using Jensen’s inequality and obtain a cancellation inside the resulting lower bound as follows: q(fj |uj , X) p(yj |fj )p(fj |uj , X)dfj log p(yj |uj , X) = log q(fj |uj , X) Z p(yj |fj )p(fj |uj , X) ≥ q(fj |uj , X) log dfj q(fj |uj , X) Z �� �� p(yj |fj )� p(f�j |u j , X) = p(fj |uj , X) log dfj �� �� p(f�j |u j , X) � Z
= ⟨log p(yj |fj )⟩p(fj |uj ,X) = Lj ,
(2.26)
where ⟨g(·)⟩p(·) denotes the expectation of a function g(·) with respect to a distribution p(·). The above derivation is instructive, but the approximation made involves no variational parameters. Therefore, the same result can be obtained if we by-pass the need to explicitly define a variational distribution and apply Jensen’s inequality directly as follows: Z log p(yj |uj , X) = log p(yj |fj )p(fj |uj , X)dfj Z ≥ p(fj |uj , X) log p(yj |fj )dfj = Lj . The above expression becomes an equality if KL (p(fj |uj , X) ∥ p(fj |uj , X, yj )) is zero, i.e. when m = n and uj = fj . This relates to the previous discussion regarding seeking a solution where U constitute a sufficient statistic for F. We refer to the resulting bound Lj as a “preliminary bound” because the variables uj are still not marginalised out. This bound has an analytic form, which we compute
26
Gaussian processes
below while temporarily using the notation ⟨·⟩ = ⟨·⟩p(fj |uj ,X) : eq. (2.4)
�� = log N yj |fj , β −1 Ip ��
�
1 β n = − log(2π) − log |β −1 Ip | − tr yj yj⊤ − 2yj fj⊤ + fj fj⊤ 2 2 2 � β � eq. (2.15) ⊤ ⊤ ⊤ e = Z − tr yj yj − 2yj aj + aj aj + K , 2
⟨log p(yj |fj )⟩
e are given in equations (2.17) and where Z denotes a set of constants and (aj , K) (2.16) respectively. By completing the square in the above expression we find: � β � Lj = ⟨log p(yj |fj )⟩p(fj |uj ,X) = log N yj |aj , β −1 Ip − tr Kf f − Kf u K−1 K uf uu 2 � � � β eq. (2.16) e . (2.27) = log N yj |aj , β −1 Ip − tr K 2 By inspecting equation (2.27) more carefully, we can gain some intuition regarding the form of the variational lower bound and the requirements for it to be “tight”. Specifically, Hensman and Lawrence [2014] examine the trace term as follows; for a tight lower bound Lj , the trace term must be small. But a small trace term also implies a small log. determinant2 . If we now notice that the conditional entropy or expected e (because of equation (2.15)), information value of fj given uj is given by 12 log |K| then we conclude that a tight lower bound Lj also implies that uj is very informative for fj . Hensman and Lawrence [2014] thus refer to this idea as “variational compression”. Finally, writing the conditional entropy as −KL (p(fj |uj )p(uj ) ∥ p(uj )) reveals that for a tight variational lower bound, p(fj |uj ) is required to be narrow. Notice that the preliminary variational bound is fully decomposable, that is: log p(Y|U, X) ≥ L =
p X
Lj =
p n X X
Li,j
(2.28)
� β ˜ i,: , where: Li,j = log N yi,j |ai,j , β −1 − k 2 −1 ai,j = (Kf u )i,: Kuu uj and ˜ i,: = (Kf f )i,i − (Kf u )i,: K−1 (Kf u )⊤ . k
(2.29)
j=1
i=1 j=1
where Lj is given in equation (2.27) and
uu
i,:
In the above, (Kf u )i,: denotes the ith row of the covariance matrix Kf u and (Kf f )i,i 2
� � e e is a positive definite matrix, tr K e ≥ log |K|. This holds because, since K
2.3 Variational Sparse Gaussian Processes - a Unified View
27
e denotes the ith diagonal element of K. The above factorisation is obtained thanks to the natural decoupling of the latent variables {fi,: }ni=1 associated with the observations. This decoupling is achieved through the conditional independencies given the inducing outputs {ui,: }m i=1 . Although this decoupling was initially introduced as a means of speeding up Gaussian processes through low rank covariance approximations, it can also be exploited to induce tractability in certain model extensions as well as in on-line GPs. More details are given in the following section and in Chapter 3.
2.3.2
Marginalisation of the Inducing Outputs
The previous section discussed how a preliminary variational bound on the quantity log p(yj |uj , X) can be obtained by setting q(fj |uj , X) = p(fj |uj , X). However, to obtain an approximation to the full marginal likelihood one needs to additionally marginalise out the inducing outputs uj using a variational distribution q(uj ), as can be seen in equation (2.24). A straight-forward approach is to consider a Gaussian form for the distribution q(uj ), so that a subsequent variational treatment is feasible due to the self-conjugacy of the Gaussian distribution. Specifically, we consider: q(U) =
p Y
q(uj )
with:
q(uj ) = N (uj |(µu )j , (Σu )j ) ,
(2.30)
j=1
where (µu )j is a m−dimensional vector and (Σu )j is a m × m matrix. Then, the marginal log. likelihood is found as: Z log p(yj |X) = log
Z p(yj |uj , X)p(uj )duj = log
q(uj ) p(yj |uj , X)p(uj )duj . q(uj )
We now make use of Jensen’s inequality: Z p(yj |uj , X)p(uj ) log p(yj |X) ≥ q(uj ) log duj = q(uj ) Z = q(uj ) log p(yj |uj , X)duj − KL (q(uj ) ∥ p(uj )) = = ⟨log p(yj |uj , X)⟩q(uj ) − KL (q(uj ) ∥ p(uj )) eq. (2.26)
≥
⟨Lj ⟩q(uj ) − KL (q(uj ) ∥ p(uj ))
≜ Gj − KL (q(uj ) ∥ p(uj )) ,
(2.31)
where we made use of the preliminary variational bound in the last line. Due to
28
Gaussian processes
having selected the variational distribution q(uj ) to be in the exponential family, the above bound on the marginal likelihood can be easily computed. Specifically, the KL term is tractable (since both involved distributions are Gaussians) according to equation (A.2), and the term Gj is found by taking the expectation of equation (2.27) with respect to q(uj ). Notice that the distribution q(uj ) does not depend on the data and, therefore, by marginalising out the inducing outputs we obtain a new variational lower bound that still factorises with respect to data points and dimensions, as was pointed out by Hensman et al. [2013a]. We can then write: log p(Y|X) ≥
p n X X j=1
! Gi,j − KL (q(uj ) ∥ p(uj )) ,
(2.32)
i=1
where: 1 β 2 log(2πβ −1 ) − yi,j + βyi,j (Kf u )i,: K−1 uu (µu )j 2 2 � � −1 � β β ⊤ ⊤ ˜ i,: , k − tr K−1 uu (µu )j (µu )j + (Σu )j Kuu (Kuf )i,: (Kuf )i,: − 2 2
Gi,j = −
˜ i,: are given in equation (2.29) and (µu )j , (Σu )j are the paramewhere (Kuf )i,: and k ters of the variational distribution q(uj ), as given in equation (2.30). The variational lower bound, given in equation (2.32) can now be optimised with respect to the covariance function parameters, θf , and to the variational parameters. Specifically, the variational parameters are the inducing points Xu (which are dropped from our expressions) and the parameters of q(U), henceforth denoted by θq(U) . Hensman et al. [2013a] recognises that directly optimising θq(U) jointly with the rest of the parameters can be problematic, as they are defined in a non-Euclidean space where each point is a distribution and distances are measured using the Kullback–Leibler divergence. Proper optimisation of θq(U) is also crucial because of the large size of this parameter vector: we have to optimise the p vectors (µu )j of size m and the p covariances (Σu )j of size m×m, a total of pm(m+1) parameters. Borrowing ideas from Hoffman et al. [2012] one can specify a Stochastic Variational Inference (SVI) procedure according to which the variational parameters θq(U) are optimised in the natural gradient space. The details of this approach are given in [Hensman et al., 2013a]. Interestingly, one can show that a unit step in the natural gradient direction is equivalent to performing one update in the Variational Bayes Expectation Maximisation (VB-EM) framework [Hensman et al., 2012; Hoffman et al., 2012].
2.3 Variational Sparse Gaussian Processes - a Unified View
2.3.3
29
Collapsing the Inducing Variational Distribution
As can be seen from the derivation leading to equation (2.31), the variational lower bound outlined in the previous section is quite “loose”, since we make use of an inequality twice. However, one can obtain a tighter bound by optimally eliminating the variational distribution q(U), recovering the original approach of Titsias [2009]. In more detail, we can start from equation (2.31), replace Lj (given in equation (2.27)) inside Gj and expand the KL term. This allows us to collect all terms that contain uj together. Specifically, we have: Z log p(yj |X) ≥
q(uj ) log N yj |aj , β
−1
� β �e� I duj − tr K 2
Z
p(uj ) duj q(uj ) Z N (yj |aj , β −1 I) p(uj ) β �e� = q(uj ) log duj − tr K . q(uj ) 2
+
q(uj ) log
One can now differentiate the above functional with respect to q(uj ) so as to obtain the optimal value for this distribution and reinsert it into the variational bound. Titsias [2009] points out that we can equivalently obtain a variational lower bound that does not depend on q(uj ), by reversing Jensen’s inequality (see also [King and Lawrence, 2006] for this trick): Z log p(yj |X) ≥ log
�� q(u j) � N � �j ) q(u �
� β �e� yj |aj , β −1 I p(uj )duj − tr K . 2
By making use of equation (A.1) once again we can compute the above integral which, interestingly, turns out to exactly match the logarithm of the approximate DTC distribution log qDTC (yj |X) of equation (2.22). That is, the final form of the variational bound is: log p(Y|X) =
p X j=1
p(yj |X) ≥
p X
e Gej = G,
j=1
where � β � � −1 −1 e e Gj = log N yj |0, β I + Kf u Kuu Kuf − tr K 2 (2.33) β �e� = log qDTC (yj |X) − tr K . 2 � � e that differentiates the above variational bound with the The trace term − β2 tr K
30
Gaussian processes
sparse DTC approximation also appears in the SVI GP bound of equation (2.32) and plays an important role. This role, as well as other comparisons between the aforementioned sparse GP methods, is explained in the next section. By expanding equation (2.33) we obtain the final expression for Gej : β ⊤ β n/2 |Kuu | /2 1/2 − yj yj 2 e (2π)n/2 Kuu + β Φ 1
Gej = log
� � ˜ β2 ⊤ e + Kuu )−1 K⊤ yj − β ξ + β tr K−1 Φ e , yj Kf u (β Φ fu uu 2 2 2 e = K⊤ Kf u . To obtain the final variational bound, we where ξ˜ = tr (Kf f ) and Φ fu e compute G by summing all individual Gej terms. As pointed out by Gal et al. [2014]; Dai et al. [2014], this final bound is not factorised with respect to datapoints; however, it is still distributable, since all expensive computations can be parallelised (in the form of partial sums) and returned to a central node in each optimisation step. To demonstrate this, we additionally introduce a e and re-write the final variational bound including all possible factorisations term Ψ with respect to datapoints as: +
1 n β n/2 |Kuu | /2 βX ⊤ yi,: yi,: 1/2 − 2 i=1 e (2π)n/2 Kuu + β Φ � � ˜ β2 e ⊤ e e − βpξ + βp tr K−1 Φ e , (β Φ + Kuu )−1 Ψ + Ψ uu 2 2 2
Ge = p log
(2.34)
while noticing that: ξ˜ =
n X i=1
e = kf (xi,: , xi,: ), Ψ
n X
e (Kf u )⊤ i,: yi,: , Φ =
i=1
n X
(Kf u )⊤ i,: (Kf u )i,: .
(2.35)
i=1
Here, (Kf u )i,: is an m−dimensional vector with its ith element given by kf (xi,: , (xu )i,: ). As can be seen, the term (Kuu + βKuf Kf u )−1 (which also appears in the DTC bound of equation (2.23)) is forbidding a full factorisation of the bound.
2.3.4
Comparison of the Sparse Methods
After having described the different ways of obtaining sparse GP approximations, we now proceed by commenting and highlighting the properties and similarities of each method. To start with, we comment on the advantages of treating sparse GPs through a variational formulation. As was shown in the end of the previous section, the variational lower bound obtained differs with the deterministic sparse approximation only
31
2.3 Variational Sparse Gaussian Processes - a Unified View
xi,:
Xu Xu
X
X uj
yj j = 1...p (a) Standard Gaussian process
uj
fj
yj
j = 1...p (b) Augmented Gaussian process, with latent function shown
yi,j
j = 1...p i = 1...n (c) Variational augmented Gaussian process
Fig. 2.4: Directed graphical models corresponding to (a) a standard Gaussian Process model, after marginalising out the latent function values f . (b) A GP augmented with inducing variables Xu , U, and with the noise dependency p(Y | F) shown. (c) Illustration of the conditional dependencies in the conditional variational bound. Shaded nodes represent observed variables; smaller circles represent quantities which do not have a distribution (black color for parameters, gray for observed).
by a trace term. This trace term acts as a regulariser and guards against overfitting in two ways; firstly, as noted in [Titsias, 2009], this term corresponds to the squared error of predicting the training latent values f from the inducing variables u, and thus facilitates the discovery of a good set of inducing inputs xu . Indeed, Smola and Schölkopf [2000]; Lawrence et al. [2003] have used similar criteria for selecting the inducing points in sparse GP methods. Secondly, the trace term regularises the covariance function parameters as well as the model noise parameter β. As explained in [Titsias, 2009], by taking the variational bound and solving for the optimal value for β reveals that this value is penalised to be smaller when the selected set of inducing points cannot predict well the training latent function values f . We now discuss the differences in the treatment of q(uj ) in the variational approaches. As we saw, by not collapsing the variational distribution q(uj ) we manage to maintain a fully factorised lower bound. As noted in [Hensman et al., 2013a], this can be intuitively explained by interpreting the inducing outputs uj as global variables, through which information is passed to the rest of the graphical model’s nodes. In other words, the graphical model of this approach satisfies the necessary conditions for applying stochastic variational inference, as identified by Hoffman et al. [2012] in the case of LDA. An important advantage of the SVI GP is that it does not scale with the number of data points (in fact, it can be cast as an on-line optimisation problem) and can be massively parallelised. Hensman et al. [2013a] identifies that the optimisation of the inducing inputs can be challenging in this case, but suggests that using a large fixed set (e.g. a fine grid) can work in most scenarios, since the reduced computational complexity means that one can use more inducing points
32
Gaussian processes
compared to traditional sparse GP methods. On the other hand, the collapsed version of the variational bound re-introduces the coupling in the data points fi,: . However, as shown in equation (2.34), these bounds are still distributable. This observation was made firstly by Gal et al. [2014] and also exploited by Dai et al. [2014]; these works defined efficient distributable algorithms that allow the variational framework to be applied to many thousands of datapoints. Concerning the quality of the approximations, the SVI GP bound of equation (2.32) is less tight than the corresponding collapsed bound of equation (2.33), since the variational distribution q(uj ) is not optimally eliminated. Regarding optimisation, in SVI GP there is a need for optimising a much larger number of parameters, namely θq(U) ; optimisation in the natural gradient space can ameliorate, to some extent, this problem but introduces the burden of having to carefully adjust the steplength of the stochastic procedure.
2.4
Discussion
This chapter discussed the basics of Gaussian processes and sparse Gaussian processes. The discussion was limited to a specific family of sparse approaches which seek low rank approximations to the covariance, although recently there has been a lot of effort in providing even faster solutions by embedding sparse approaches in more sophisticated algorithms, e.g. by Meier et al. [2014]; Bui and Turner [2014]; Deisenroth and Ng [2015]. Here, special attention was given to the variational sparse GP methods, for which a unifying view was also developed. The variational interpretation of inducing points is used in the rest of this thesis for purposes that go much further than just providing low-rank approximations for the covariance. Firstly, by exploiting the fact that the data become independent given the inducing points one can obtain tractability in GP-based Bayesian latent variable models, as was firstly shown by Titsias and Lawrence [2010]. This thesis is concerned with mathematically describing the variational framework which results in tractable marginalisation of the latent or other kinds of GP inputs as well as with imposing rich structure in the latent space, such as dynamics [Damianou et al., 2011], segmentation coming from multiple observation views [Damianou et al., 2012], class information etc. Finally, the interpretation of inducing points as variational rather than model parameters facilitates the construction of deep GP structures without the danger of overfitting.
2.4 Discussion
33
Note on chapter’s contributions Since this introductory chapter mostly contained a review of previous work, I will clarify my contributions in this paragraph, and summarise the contributors of the main ideas discussed. Firstly, the review of Gaussian and sparse Gaussian processes drew inspiration mainly from Williams and Rasmussen [1996]; Bishop [2006]; Quiñonero Candela and Rasmussen [2005]; Titsias [2009]. Secondly, the pioneering variational GP approach where I placed particular emphasis was developed by Titsias [2009]. In this chapter I provided a unifying review, which highlights the connections of past sparse GP approaches, Titsias’ variational approach and recent variational GP developments. Specifically, I firstly discussed the extension of Hensman et al. [2013a] for obtaining a fully factorised bound. Secondly, I discussed a way of distributing the computations of the GP. This comes from the work of Gal et al. [2014], which was later revisited by Dai et al. [2014] (a paper where I appear as second author). Discussing all these works with a common notation and within a common framework will be useful later in the thesis, when I will describe how to further extend and combine these ideas to obtain powerful new latent variable models.
Chapter 3 Variational Marginalisation of Latent Variables in Gaussian Process Models A major problem in probabilistic generative modelling is propagating uncertainties through non-linearities. This chapter considers the case where the inputs to a GP are latent variables, as in the GP-LVM [Lawrence, 2005], and thus associated with uncertainty. Starting from the Bayesian GP-LVM [Titsias and Lawrence, 2010; Damianou et al., 2015], this chapter is concerned with deriving in detail the variational inference methodology that allows for approximate uncertainty propagation. This is then taken one step further, by defining a unifying framework allowing us to consider nonparametric priors on the latent space and, thus, to obtain structured (e.g. correlated) approximate posteriors. A detailed study is presented, for the resulting variational bound and the way in which structure learning emerges naturally through the combination of the Bayesian framework and automatic relevance determination techniques. Specifically, the roadmap of this chapter is as follows. The background section 3.1 motivates this chapter from a more general viewpoint, outlining previous approaches based on propagating distributions through non-linear functions and associated approximations to tackle the intractability. Then, Section 3.2, focuses on a particular instance of this kind of approaches where the non-linear function is non-parametrically modelled with Gaussian processes, as was briefly outlined in Sections 2.1.4 and 2.1.5. The intractability introduced by such an approach is solved via a non-standard variational approximation described in detail in Section 3.3. This approximation is inspired by the variational treatment of inducing points in sparse GPs, as was discussed in the previous chapter. Although the current chapter is concerned with propagating the uncertainty of latent inputs in GPs, a generalisation is discussed in Chapter 4. Importantly, the developed variational framework additionally allows for treating
36
Variational Marginalisation of Latent Variables in Gaussian Process Models
the inputs to a GP as stochastic processes, rather than points or distributions, significantly increasing flexibility and expressiveness. This chapter focuses on dynamical processes, but in Chapter 6 more general constructions are described.
3.1
Background
Consider a non linear function f (x). A very general class of probability densities can be recovered by mapping a simpler density through the non linear function. For example, we might decide that x should be drawn from a Gaussian density, x ∼ N (0, 1) , and we observe y, which is given by passing samples from x through a non-linear function, perhaps with some corrupting Gaussian noise, according to the generative procedure of equation (2.3): y = f (x) + ϵ,
ϵ ∼ N (µ, β −1 ) .
Whilst the resulting density can now have a very general form, inference in this kind of models presents particular problems in terms of tractability. For example, let us consider the non-linear function f to be an RBF network with 100 centers and ℓ = 0.1. The resulting likelihood function p(y|x) ≜ p(y|f, x) is plotted in figure 3.1(a). From Bayes’ rule, we can obtain the posterior as: p(x|y) =
p(y|x)p(x) . p(y)
However, this density can be complicated and difficult to normalise, as can be seen in figures 3.1(b) and 3.1(c). In other words, propagating a Gaussian density through a non-linear function is a challenging task, in terms of analytic inference. Models of this form appear in several domains. They can be used for autoregressive prediction in time series [see e.g. Girard et al., 2003] or prediction of a regression model output when the input is uncertain [see e.g. Oakley and O’Hagan, 2002]. MacKay [1995b] considered the same form for dimensionality reduction where several latent variables, x = {xj }qj=1 are used to represent a high dimensional vector y = {yj }pj=1 and we normally have p > q, y = f (x). In Section 2.1.4 it was shown that the GP-LVM is a particular instance of this approach, based on GPs. Adding a dynamical component to these non-linear dimensionality reduction approaches leads
37
3.1 Background
1
0.5
0 0
4.6 0.2
0
4.6 0.2
−0.1 0.4
−0.1 0.4 −4.8
−4.8
(a) The likelihood plotted as a function of y and x. y is obtained through a non-linear function plus noise. Red line is for fixing x to some value x ˆ.
(b) Unnormalised posterior plotted as a function of x and y. Red line is for a fixed y and blue line is p(x).
(c) Propagating the Gaussian density p(x) through a non-linear mapping.
Fig. 3.1: A Gaussian distribution propagated through a non-linear mapping. Figures (a) and (b) show the likelihood and unnormalised posterior respectively. The posterior density (plotted for given data using a red line in figure (b) and on the right in figure (c)) is multimodal and difficult to normalise.
to non-linear state space models [Särkkä, 2013], where the states often have a physical interpretation and are propagated through time in an autoregressive manner, xt = g(xt−1 ), where g(·) is a vector valued function. The outputs are then observed through a separate non-linear vector valued function, yt = f (xt ) + ϵ. In the context of GP-LVM this approach has been followed by Wang et al. [2006] and Damianou et al. [2011]. The intractabilities of mapping a distribution through a non-linear function have resulted in a range of different approaches. In density networks sampling was proposed; in particular, in [MacKay, 1995b] importance sampling was used. When ex-
38
Variational Marginalisation of Latent Variables in Gaussian Process Models
Fig. 3.2: A three dimensional manifold formed by mapping from a two dimensional space to a three dimensional space.
tending importance samplers dynamically, the degeneracy in the weights needs to be avoided, thus leading to the resampling approach suggested for the bootstrap particle filter of Gordon et al. [1993]. Other approaches in non-linear state space models include the Laplace approximation, as used in extended Kalman filters, and unscented and ensemble transforms [see Särkkä, 2013]. In dimensionality reduction the generative topographic mapping [GTM Bishop et al., 1998] reinterpreted the importance sampling approach of MacKay [1995b] as a mixture of Gaussians model, using a discrete representation of the latent space. In the current chapter of this thesis a variational approach is suggested to dealing with input uncertainty that can be applied to Gaussian process models. The initial focus will be application of Gaussian process models in the context of dimensionality reduction, where GP inputs are latent. In dimensionality reduction we assume that our high dimensional data set is really the result of some low dimensional control signals which are, perhaps, non-linearly related to our observed functions. In other words we assume that our data, Y ∈ ℜn×p , can be approximated by a lower dimensional matrix of latent variables, X ∈ ℜn×q through a vector valued function where each row, yi,: of Y represents an observed data point and is approximated through yi,: = f (xi,: ) + ϵi,: ,
(3.1)
so that the data is a lower dimensional subspace immersed in the original, high dimensional space. If the mapping is linear, e.g. f (xi,: ) = W⊤ xi,: with W ∈ ℜq×p , methods like principal component analysis, factor analysis and (for non-Gaussian p(xi,: )) independent component analysis [Hyvärinen et al., 2001] follow. For Gaussian p(xi,: ) the marginalization of the latent variable in these cases is tractable because placing a Gaussian density through an affine transformation retains the Gaussianity of the data density, p(yi,: ). However, the linear assumption is very restrictive so it is natural to look to go beyond it through a non linear mapping.
3.1 Background
39
In the context of dimensionality reduction, a range of approaches have been suggested that consider neighborhood structures or the preservation of local distances to find a low dimensional representation. In the machine learning community, spectral methods such as isomap [Tenenbaum et al., 2000], locally linear embeddings [LLE, Roweis and Saul, 2000] and Laplacian eigenmaps [Belkin and Niyogi, 2003] have attracted a lot of attention. These spectral approaches are all closely related to kernel PCA [Schölkopf et al., 1998] and classical multi-dimensional scaling (MDS) [see e.g. Mardia et al., 1979]. These methods do have a probabilistic interpretation as described by Lawrence [2012], but it does not explicitly include an assumption of underlying reduced data dimensionality. Other iterative methods such as metric and non-metric approaches to MDS [Mardia et al., 1979], Sammon mappings [Sammon, 1969] and t-SNE [van der Maaten and Hinton, 2008] also lack an underlying generative model. Probabilistic approaches, such as the generative topographic mapping [GTM, Bishop et al., 1998] and density networks [MacKay, 1995b] view the dimensionality reduction problem from a different perspective, since they seek a mapping from a low-dimensional latent space to the observed data space (as illustrated in figure 3.2), and come with certain advantages. More precisely, their generative nature and the forward mapping that they define allow them to be extended more easily in various ways (e.g. with additional dynamics modelling), to be incorporated into a Bayesian framework for parameter learning and to handle missing data more naturally. This approach to dimensionality reduction provides a useful archetype for the algorithmic solutions we are providing in this chapter, as they require approximations that allow latent variables to be propagated through a non-linear function. The framework described here takes the generative approach prescribed by density networks and then non-linear variants of Kalman filters one step further. Because, rather than considering a specific function, f (·), to map from the latent variables to the data space, we will consider an entire family of functions: one that subsumes the more restricted class of either Gauss Markov processes (such as the linear Kalman filter/smoother) and Bayesian basis function models (such as the RBF network used in the GTM, with a Gaussian prior over the basis function weights). These models can all be cast within the framework of Gaussian processes. The GP covariance specifies a distribution over functions that subsumes the special cases mentioned above alongside the more general case of probabilistic methods with more basis functions. The Gaussian process latent variable model [GP-LVM, Lawrence, 2005] is a more recent probabilistic dimensionality reduction method which has been proven to be very robust for high dimensional problems [Lawrence, 2007a; Damianou et al., 2011].
40
Variational Marginalisation of Latent Variables in Gaussian Process Models
As outlined in Section 2.1.4, the GP-LVM can be seen as a non-linear generalisation of probabilistic PCA which also has a Bayesian interpretation [Bishop, 1999]. In contrast to PPCA, the non-linear mapping of GP-LVM makes a Bayesian treatment much more challenging. Titsias and Lawrence [2010]; Damianou et al. [2015] show how such a Bayesian treatment can be obtained using approximations stemming from the variational sparse GP framework described in Section 2.2. In the current section, we formally derive this method in detail and place it in the context of a unified variational inference framework which allows us to propagate uncertainty through a Gaussian process and obtain a rigorous lower bound on the marginal likelihood of the resulting model. The resulting unified framework allows for straightforwardly considering structure in the latent space, even if this is coming from a higher level stochastic process. Therefore, multiple scenarios can be accommodated; for example, if we treat the latent points as noisy measurements of given inputs we obtain a method for Gaussian process regression with uncertain inputs [Girard et al., 2003] or, in the limit of zero noise, with partially observed inputs. This case is examined separately in the next chapter. On the other hand, considering a latent space prior that depends on a time vector, allows us to obtain a Bayesian model for dynamical systems [Damianou et al., 2011] that significantly extends classical Kalman filter models with a non-linear relationship between the state space, X, and the observed data Y, along with non-Markov assumptions in the latent space which can be based on continuous time observations. This is achieved by placing a Gaussian process prior on the latent space, X which is itself a function of time, t. For better intuition we will focus our analysis on temporal processes, but if we replace the time dependency of the prior for the latent space with a spatial dependency, or a dependency over an arbitrary number of high dimensional inputs our analysis and derivations still hold. As long as a valid covariance function1 can be derived (this is also possible for strings and graphs). This leads to a Bayesian approach for warped Gaussian process regression [Snelson et al., 2004; Lázaro-Gredilla, 2012]. The next section reviews the main prior work on dealing with latent variables in the context of Gaussian processes and describe how the model was extended with a dynamical component. The variational framework and Bayesian training procedure is then introduced in Section 3.3. Section 3.4 describes how the variational approach is applied to a range of predictive tasks and this is demonstrated with experiments conducted on simulated and real world datasets in Section 3.5. Finally, based on the theoretical and experimental results of our work, the final conclusions are presented 1
The constraints for a valid covariance function are the same as those for a Mercer kernel. It must be a positive (semi-)definite function over the space of all possible input pairs.
3.2 Gaussian Processes with Latent Variables as Inputs
41
in Section 3.6.
3.2
Gaussian Processes with Latent Variables as Inputs
We wish to model the interaction of input and output collections of points, X and Y respectively, via the generative procedure of equation (3.1) and by assuming a GP prior for f . By treating this general modelling scenario as a Gaussian process latent variable model (GP-LVM, Section 2.1.4), we can obtain all possible cases of interest. For example, we can perform standard GP regression, latent variable modelling (and dimensionality reduction) or semi-supervised modelling if we treat the inputs to the GP-LVM as fixed, free and partially fixed parameters respectively. However, in contrast to standard GP-LVM modelling, here we are also interested in modelling the uncertainty associated with the inputs. Later in this chapter an approach which makes this possible (dubbed the “variational GP-LVM”) is developed. This section provides background material on current approaches for learning using Gaussian process latent variable models (GP-LVMs). Specifically, Section 3.2.1 reviews the standard GP-LVM for i.i.d. data as well as dynamic extensions suitable for sequence data. Section 3.2.2 discusses the drawbacks of MAP estimation over the latent variables, which is currently the mainstream way to train GP-LVMs and does not allow for propagating the uncertainty of the inputs.
3.2.1
Different Latent Space Priors and GP-LVM Variants
Different GP-LVM algorithms can result by varying the structure of the prior distribution p(X) over the latent inputs. The simplest case, which is suitable for i.i.d. observations, is obtained by selecting a fully factorized (across data points and dimemsions) latent space prior: p(X) =
n Y i=1
N (xi,: |0, Iq ) =
q n Y Y
N (xi,j |0, 1) .
(3.2)
i=1 j=1
More structured latent space priors can also be used to incorporate available information about the problem at hand. For example, Urtasun and Darrell [2007] add discriminative properties to the GP-LVM by considering priors which encapsulate class-label information. Other existing approaches in the literature seek to constrain the latent space via a smooth dynamical prior p(X) so as to obtain a model for dynamical sys-
42
Variational Marginalisation of Latent Variables in Gaussian Process Models
tems. For example, Wang et al. [2006, 2008] extend GP-LVM with a temporal prior which encapsulates the Markov property, resulting in an auto-regressive model. Ko and Fox [2009, 2011] further extend these models for Bayesian filtering in a robotics setting, whereas Urtasun et al. [2006] consider this idea for tracking. In a similar direction, Lawrence and Moore [2007] consider an additional temporal model which employs a GP prior that is able to generate smooth paths in the latent space. In this chapter we shall focus on dynamical variants where the dynamics are regressive, as in [Lawrence and Moore, 2007]. In this setting, the data are assumed to be a multivariate timeseries {yi,: , ti,: }ni=1 where ti,: ∈ ℜ+ is the time at which the datapoint yi,: is observed. A GP-LVM dynamical model is obtained by defining a temporal latent function x(t) = (x1 (t), . . . , xq (t)) where the individual components are taken to be independent draws from a Gaussian process, xj (t) ∼ GP(0, kx (t, t′ )), k = 1, . . . , q, where kx (t, t′ ) is the covariance function. The datapoint yi,: is assumed to be produced via the latent vector xi,: = x(ti,: ), as shown in figure 3.3(c). All these latent vectors can be stored in the matrix X (exactly as in the i.i.d. data case) which now follows the correlated prior distribution, p(X|t) =
q Y j=1
p(xj |t) =
q Y
N (xj |0, Kx ) ,
(3.3)
j=1
where Kx = kx (t, t) is the covariance matrix obtained by evaluating the covariance function kx on the observed times t. In contrast to the fully factorized prior in (3.2), the above prior couples all elements in each row of X. The covariance function kx has parameters θx and determines the properties of each temporal function xk (t). For instance, the use of an Ornstein-Uhlbeck covariance function yields a Gauss-Markov process for xk (t), while the exponentiated quadratic covariance function gives rise to very smooth and non-Markovian process.
3.2.2
Drawbacks of the MAP Training Procedure
GP-LVM based models found in the literature typically rely on MAP training procedures for optimising the latent inputs and the hyperparameters, see Section 2.1.4. However, this approach has several drawbacks. Firstly, the fact that it does not marginalise out the latent inputs implies that it is sensitive to overfitting. Further, the MAP objective function cannot provide any insight for selecting the optimal number
3.2 Gaussian Processes with Latent Variables as Inputs
43
of latent dimensions, since it typically increases when more dimensions are added. This is why most GP-LVM algorithms found in the literature require the latent dimensionality to be either set by hand or selected with cross-validation. The latter case renders the whole training computationally slow and, in practice, only a very limited subset of models can be explored in a reasonable time. As another consequence of the above, the current GP-LVMs employ simple covariance functions (typically having a common lengthscale over the latent input dimensions as the one in equation (2.6)), while more complex covariance functions, that could help to automatically select the latent dimensionality, are not popular. For example, the exponentiated quadratic with multiple lengthscales covariance function of equation (2.7) could allow an automatic relevance determination (ARD) procedure to take place, during which unnecessary dimensions of the latent space X are assigned a weight wk with value almost zero. However, with the standard MAP training approach the benefits of Bayesian shrinkage using the ARD covariance function cannot be realised, as typically overfitting will occur; this is later demonstrated in Figure 3.4. This is the reason why standard GP-LVM approaches in the literature avoid the ARD covariance function and are sensitive to the selection of q. On the other hand, the fully Bayesian framework allows for a “soft” model selection mechanism [Tipping, 2000; Bishop, 1999], stemming from the different role played by q. Specifically, in such an approach q can be seen as an “initial conservative guess” for the effective dimensionality of the latent space; subsequent optimisation renders unnecessary dimensions almost irrelevant by driving the corresponding inverse lengthscales close to zero. Notice, however, that no threshold needs to be employed. Indeed, in the predictive equations all q latent dimensions are used, but the lengthscales automatically weight the contribution of each. In fact, typically the selection for q is not crucial, as long as it is large enough to capture the effective dimensionality of the data. That is, if r > q is used instead, then the extra r − q dimensions will only slightly affect any predictions, given that they will be assigned an almost zero weight. This was indeed observed in our initial experiments. An alternative to the ARD shrinkage principle employed in this paper is the spike and slab principle [Mitchell and Beauchamp, 1988], which provides “hard” shrinkage so that unnecessary dimensions are assigned a weight exactly equal to zero. This alternative constitutes a promising direction for future research in the context of GP-LVMs. Another major problem with MAP training procedures is that this approach severely hinders the development of more complicated models and, in particular, deep Gaussian processes. Indeed, an approach which treats all hidden layers of a deep model as “standard” parameters does not allow for learning any structure and suffers from
44
Variational Marginalisation of Latent Variables in Gaussian Process Models
severe overfitting problems. This is further discussed in Chapter 6, as the current chapter keeps the discussion more general. Given the above, it is clear that the development of more fully Bayesian approaches for training GP-LVMs could make these models more reliable and provide rigorous solutions to the limitations of MAP training. The variational method presented in the next section is such an approach that, as demonstrated in the experiments, shows great ability in avoiding overfitting and permits automatic selection of the latent dimensionality.
3.3
Variational Gaussian Process Latent Variable Models
This section describes in detail the proposed method which is based on a non-standard variational approximation that utilises auxiliary variables. The resulting class of training algorithms will be referred to as variational Gaussian process latent variable models, or simply variational GP-LVMs. We start with Section 3.3.1 which briefly describes standard variational Bayesian inference and Section 3.3.2 which explains the obstacles we need to overcome when applying variational methods to the GP-LVM and specifically why the standard mean field approach is not immediately tractable. Section 3.3.3 shows how the use of auxiliary variables together with a certain variational distribution results in a tractable approximation. Finally, Section 3.3.6 gives specific details about how to apply the developed framework to the two different GP-LVM variants that this chapter is concerned with: the standard GP-LVM and the dynamical/warped one.
3.3.1
Standard Variational Bayesian Inference
Given a set of observations Y, we assume that these data can be generated by a family of models p(Y, Θ), where Θ is a set of unknown random variables upon which the models depend. Maximum likelihood approaches seek to find the best model by maximizing the likelihood p(Y|Θ) with respect the Θ to find a single point estimate for the variables Θ. On the other hand, Bayesian methods seek to compute the logarithm of the marginal likelihood (or evidence) p(Y) according to: Z log p(Y) = log
Z p(Y, Θ)dΘ = log
p(Y|Θ)p(Θ)dΘ.
3.3 Variational Gaussian Process Latent Variable Models
45
This approach is advantageous because all possible settings for Θ are averaged out while we obtain a posterior distribution p(Θ|Y) for the unknown variables, something which leads to an automatic Occam’s razor which penalizes complex models and prevents overfitting [Jefferys and Berger, 1992; MacKay, 1995a]. However, for most interesting models the above integral is intractable, and variational methods are often employed for approximating this quantity [Bishop, 2007; Beal, 2003]. These approaches seek to lower bound the logarithm of the model evidence with a functional F (q(Θ)) which depends on a variational distribution q(Θ). Notice that, in general, there might still be model hyperparameters θ to be optimized but, as in the rest of this thesis, the conditioning on θ is dropped for clarity, i.e. we will write p(Y, Θ) instead of p(Y, Θ|θ) and F (q(Θ)) instead of F (q(Θ), θ). The lower bound F is obtained by applying Jensen’s inequality: Z
Z
p(Y, Θ) dΘ log p(Y) = log p(Y, Θ)dΘ = log q(Θ) q(Θ) Z p(Y, Θ) ≥ q(Θ) log dΘ = F (q(Θ)) . q(Θ) The bound becomes exact when q(Θ) = p(Θ|Y). However, if the true posterior is intractable or very complicated, the variational distribution q(Θ) has to be somehow constrained and, therefore, only provide an approximation to the true posterior. In the standard Bayesian variational methodology, one obtains tractability by constraining q(Θ) to either be of a specific form or to factorise with respect to groups of elements belonging to the parameter set Θ, something which is also known as the mean field approximation. In any case, the functional F(q(Θ)) is then variationally optimised with respect to q(Θ) so that the variational distribution approximates the true posterior p(Θ|Y) as the bound becomes tighter, i.e. as F (q(Θ)) → log p(Y). In the following section we attempt to apply the standard variational methodology described above for treating the GP-LVM in a Bayesian manner. We will explain why this standard approach is inadequate and will introduce further approximations which lead to an analytical lower bound on the marginal likelihood.
3.3.2
Standard Mean Field is Challenging for GP-LVM
A Bayesian treatment of the GP-LVM requires the computation of the log marginal likelihood. Both sets of unknown random variables have to be marginalised out: the mapping values F (as in the standard model) and the latent space X. Thus, the
46
Variational Marginalisation of Latent Variables in Gaussian Process Models
required integral is written as, Z
Z
log p(Y) = log
p(Y, F, X)dXdF = log p(Y|F)p(F|X)p(X)dXdF (3.4) �Z � Z = log p(Y|F) p(F|X)p(X)dX dF, (3.5)
where all probabilities appearing above are given in Chapter 2. The key difficulty with this Bayesian approach is propagating the prior density p(X) through the non-linear mapping. Indeed, the nested integral in equation (3.5) can be written as: Z p Y p(fj |X)dX p(X) j=1
where each term p(fj |X), given by equation (2.2), is proportional to: − 21
|Kf f |
� � 1 ⊤ −1 exp − fj Kf f fj . 2
Clearly, the inputs X of the kernel matrix Kf f are contained in the above term in a rather very complex non-linear manner and therefore analytical integration over X is infeasible. To make progress we can invoke the standard variational Bayesian methodology, outlined in the previous section, to approximate the marginal likelihood of equation (3.4) with a variational lower bound. Specifically, we introduce a factorised variational distribution over the unknown random variables, q(F, X) = q(F)q(X), which aims at approximating the true posterior p(F|Y, X)p(X|Y). Based on Jensen’s inequality, we can obtain the standard variational lower bound on the log marginal likelihood, Z log p(Y) ≥
q(F)q(X) log
p(Y|F)p(F|X)p(X) dFdX. q(F)q(X)
(3.6)
Nevertheless, this standard mean field approach remains problematic because the lower bound above is still intractable to compute. To isolate the intractable term,
47
3.3 Variational Gaussian Process Latent Variable Models observe that (3.6) can be written as Z log p(Y) ≥
Z q(F)q(X) log p(F|X)dFdX +
q(F)q(X) log
p(Y|F)p(X) dFdX, q(F)q(X)
where the first term of the above equation contains the expectation of log p(F|X) under the distribution q(X). This requires an integration over X which appears nonlinearly in K−1 f f and log |Kf f | and cannot be done analytically. This means that standard mean field variational methodologies do not lead to an analytically tractable variational lower bound.
3.3.3
Tractable Lower Bound by Introducing Auxiliary Variables
In contrast, the framework presented here allows us to compute a closed-form Jensen’s lower bound by applying variational inference after expanding the GP prior so as to include auxiliary inducing variables. Originally, inducing variables were introduced for computational speed ups in GP regression models. In our approach, these extra variables will be used within the variational sparse GP framework of Titsias [2009] that was outlined in Section 2.2. More specifically, we expand the joint probability model by including m extra samples (inducing points) of the GP latent mapping f (x), so that ui,: ∈ Rp is such a sample. The inducing points are collected in a matrix U ∈ Rm×p and constitute latent function evaluations at a set of pseudo-inputs Xu ∈ Rm×q . The augmented joint probability density takes the form, p(Y, F, U, X) =p(Y|F)p(F|U, X)p(U)p(X) =
p Y
! p(yj |fj )p(fj |uj , X)p(uj ) p(X).
(3.7)
j=1
The probabilities appearing above are given in Section 2.2 but rewritten here for completeness (recall that, for clarity, the Xu is dropped from the conditioning set): � � e with: p(fj |uj , X) = N fj |aj , K aj = Kf u K−1 uu uj
and
(3.8)
e = Kf f − Kf u K−1 Kuf K uu
and p(uj ) = N (uj |0, Kuu ).
(3.9)
48
Variational Marginalisation of Latent Variables in Gaussian Process Models
Recall that Kuu denotes the covariance matrix constructed by evaluating the covariance function on the inducing points, Kuf is the cross-covariance between the inducing and the latent points and Kf u = K⊤ uf . Figure 3.3b graphically illustrates the augmented probability model.
t
X
X
F
F
Y
Y
(a)
X
Xu
U
Xu
F
U
Y (b)
(c)
Fig. 3.3: The graphical model for the GP-LVM (a) is augmented with auxiliary variables to obtain the variational GP-LVM model (b) and its dynamical version (c). In general, the top level input in (c) can be arbitrary, depending on the application.
Similarly to the variational sparse GP case, to compute a variational lower bound by working in the augmented probability space, we need to introduce a variational distribution q(U) which factorises with respect to output dimensions j, as shown in equation (2.30). Since we now wish to integrate out the latent space, we additionally introduce a variational distribution q(X). This distribution can be chosen to factorise across latent dimensions or datapoints and, as will be discussed in Section 3.3.6, this choice will depend on the form of the prior distribution p(X). For the time being, however, we shall proceed by only assuming that this distribution is Gaussian: q(X) = N (X|M, S) ,
(3.10)
where calligraphic notation is used for the parameters to emphasize that possible factorisations might exist.
3.3 Variational Gaussian Process Latent Variable Models
49
The lower bound can now be found as follows: Z log p(Y) = log p(Y|U, X)p(U)p(X)dXdU Z p(Y|U, X)p(U)p(X) ≥ q(X)q(U) log dXdU q(X)q(U) Z = q(X)q(U) log p(Y|U, X) − KL (q(U) ∥ p(U)) − KL (q(X) ∥ p(X)) ≥ ⟨L⟩q(U)q(X) − KL (q(U) ∥ p(U)) − KL (q(X) ∥ p(X)) = Fˆ (q(X), q(U)) − KL (q(X) ∥ p(X)) = F (q(X), q(U))
(3.11)
where we used the preliminary bound of equation (2.28) and defined: ˆ F(q(X), q(U)) = ⟨L⟩q(U)q(X) − KL (q(U) ∥ p(U)) . Following the discussion in the variational sparse GP section, instead of using the preliminary bound we could here introduce a variational distribution which includes the exact term p(F|U, X). Overall, the form of the variational distribution is: q(F, U, X) = q(X)
p Y
p(fj |uj , X)q(uj )
(3.12)
j=1
and gives us the same bound after applying Jensen’s inequality. Specifically, we have: Z log p(Y) ≥
q(F, U, X) log
p(Y, F, U, X) dFdUdX q(F, U, X)
from where the factors p(fj |uj , X) cancel out if we expand the joint and the variational distribution. It is now clear that we explicitly assume a variational distribution which approximates the true posterior written below: p(F, U, X|Y) = p(F|U, Y, X)p(U|Y, X)p(X|Y).
(3.13)
Notice that the variational lower bound of equation (3.11) factorises with respect to dimensions j, since L and q(U) both factorise accordingly. Additionally, if we select q(X) to factorise with respect to data points, then F is a fully factorised bound. The computation of the expectation ⟨L⟩q(U)q(X) is analytically tractable (depending on the form of the covariance function – this will be explained later). First we
50
Variational Marginalisation of Latent Variables in Gaussian Process Models
will consider the expectation with respect to q(X): ⟨L⟩q(X) =
p n X X
⟨Li,j ⟩q(X) , and from equation (2.29) we have:
i=1 j=1
1 β 2 + βtr (yi,j Ψi,: K−1 ⟨Li,j ⟩q(X) = − log(2πβ −1 ) − yi,j uu uj ) 2 2 � β� � �� β � ⊤ −1 ˆ −1 ˆ ˆ − tr K−1 u u K Φ − ξ − tr Φ K , i i uu uu j j uu i 2 2
(3.14)
where, in a similar fashion to equation (2.35), we introduced the notation of {ξ, Ψ, Φ} statistics, which is explained below. We have:
ξ = ⟨tr (Kf f )⟩q(X) =
n X
ξˆi
i=1
Ψ = ⟨Kf u ⟩q(X) = {Ψi,: }ni=1 Φ = ⟨Kuf Kf u ⟩q(X) =
n X
(3.15)
ˆ i. Φ
i=1
These statistics are computed in a decomposable way, since the covariance matrices appearing in them are evaluated in pairs of inputs xi,: and (xu )i,: taken from X and Xu respectively. In particular, the statistics ξ and Φ are written as sums of independent terms where each term is associated with a data point and similarly each column of the matrix Ψ is associated with only one data point. This decomposition is useful when a new data vector is inserted into the model and can also help to speed up computations during test time as discussed in Section 3.4. It can also allow for parallelization in the computations as suggested by [Gal et al., 2014; Dai et al., 2014] and shown in equation (2.34). Therefore, the averages of the covariance matrices over q(X) in equation (3.15) of the {Φ, Ψ, ξ} statistics can be computed separately for each marginal q(xi,: ) = N (xi,: |µi,: , Si ) taken from the full q(X) of equation (3.10). P We can, thus, write that ξ = ni=1 ξˆi where ξˆi =
Z kf (xi,: , xi,: )N (xi,: |µi,: , Si ) dxi,: .
(3.16)
Further, Ψ is an n × m matrix with rows {Ψi,: }ni=1 , such that Z Ψi,k =
kf (xi,: , (xu )k,: )N (xi,: |µi,: , Si ) dxi,: .
Φ is an m × m matrix which is written as Φ =
Pn
i=1
(3.17)
ˆ i where each Φ ˆ i is itself an Φ
51
3.3 Variational Gaussian Process Latent Variable Models m × m matrix such that Z ˆ i )k,k′ = kf (xi,: , (xu )k,: )kf ((xu )k′ ,: , xi,: ) N (xi,: |µi,: , Si ) dxi,: . (Φ
(3.18)
Notice that these statistics constitute convolutions of the covariance function kf with Gaussian densities and are tractable for many standard covariance functions, such as the ARD exponentiated quadratic or the linear one. The analytic forms of the {ξ, Ψ, Φ} statistics for these covariance functions are given in Appendix B.2. Returning back to the expression for the variational bound of equation (3.14), we can get further intuition by completing the square: −1 ⟨Li,j ⟩q(X) = N (yi,j |Ψi,: K−1 uu uj , β ) � �� β � � �� β � ⊤ −1 ⊤ −1 ˆ ˆ ˆ − tr K−1 u u K Φ − Ψ Ψ − ξ − tr Φ K . i i i uu uu j j uu i,: i,: 2 2
Finally, we take a further expectation (with respect to q(U), given in equation (2.30)) of the variational lower bound of equation (3.14): D E β 2 1 + βtr (yi,j Ψi,: K−1 ⟨Li,j ⟩q(X) = − log(2πβ −1 ) − yi,j uu (µu )j ) 2 2 q(U) � −1 � β � −1 ⊤ ˆi (3.19) − tr Kuu (µu )j (µu )j + (Σu )j Kuu Φ 2 �� � β �ˆ ˆ i K−1 . ξi − tr Φ − uu 2 The final form of the variational lower bound F (q(X), q(U)) can now be obtained by summing the above expression over i, j and replacing back in equation (3.11). By choosing q(X) to be factorised w.r.t datapoints, the whole variational bound is then fully factorised. Stochastic Optimisation and Big Data Challenges Optimising the above form of the bound involves the model parameters θ and variational parameters Θ, where Θ consists of the inducing inputs Xu as well as the parameters of the distributions q(X) and q(U). The optimisation can proceed by optimising all of these parameters jointly using a gradient based method, but this can be challenging due to their inter-dependencies and large number. Specifically, the variational distribution q(U) is associated with full covariance matrices; the variational distribution q(X) is associated with diagonal covariance matrices, but in big data scenarios it can also become problematic, since every datapoint is associated with a marginal q(xi,: ).
52
Variational Marginalisation of Latent Variables in Gaussian Process Models
Optimising q(U) and q(X) using natural gradients could result in an improved stochastic optimisation procedure. The implementation developed as part of this thesis experimented with a hybrid approach where only q(U) is optimised in the natural gradient space. Essentially, this approach constitutes the unsupervised extension of the GP stochastic variational inference approach of Hensman et al. [2013a], where data minibatches are considered to update the gradient estimate in each iteration. In the GP case, each optimisation step concerns only “global” parameters, i.e. parameters that are shared between datapoints. However, in the unsupervised scenario every minibatch B of observations {yb,: }b∈B is accompanied with a different set of variational parameters, corresponding to the marginal {q(xb,: )}b∈B . Optimising these variational parameters is challenging, since the data minibatch is considered only once and then discarded. As we explain in [Hensman et al., 2014a], one solution is to define an iterative training scheme which estimates the approximate posterior of q(xb,: ) once a batch b is observed and subsequently take steps in the (natural) gradient direction of the global parameters U. Although this solution is viable, our experiments (see Section 3.5.6) showed that the corresponding optimisation procedure is very unstable because certain data batches can cause bifurcation-like effects. These effects are attributed to the complicated interplay between the parameters to be learned and they add a significant burden in calibrating the learning rates during optimisation. Another promising direction is to resort to recognition models [see e.g. Stuhlmüller et al., 2013; Rezende et al., 2014] which approximate (through a learned mapping) the posteriors q(xb,: ) directly from their corresponding yb,: .
3.3.4
Collapsing the Inducing Variational Distribution
In contrast to explicitly representing the variational distribution q(U) in the final expression for the lower bound, one can obtain a tighter bound: F (q(X)) ≥ F (q(X), q(U)) by collapsing q(U) as discussed for the sparse GP case in Section 2.3.3. In this case, we do not need to specify a specific distribution for q(uj ), but will instead leave it be a free form distribution which will be optimally set. To achieve this, we go back to equation (3.11) and, since collapsing q(U) reintroduces coupling in the data points,
3.3 Variational Gaussian Process Latent Variable Models
53
we will write the factorisation only with respect to dimensions: F (q(X), q(U)) =
p X
Fˆj (q(X), q(uj )) − KL (q(X) ∥ p(X)) .
(3.20)
j=1
In eq. (3.11) we saw how the Fˆj (q(X), q(uj )) term can be written as a function of the preliminary variational bound Lj . We therefore use equation (2.27) and collect all terms containing q(uj ), so that the Fˆj (q(X), q(uj )) term of the bound becomes: Z Z p(uj ) ˆ duj Fj (q(X), q(uj )) = q(uj ) ⟨Lj ⟩q(X) duj + q(uj ) log q(uj ) Z Z p(uj ) ⟨log N (yj |aj ,β −1 Ip )⟩q(X) = q(uj ) log e duj + q(uj ) log duj − A q(uj ) Z ⟨log N (yj |aj ,β −1 Ip )⟩q(X) e p(uj ) = q(uj ) log duj − A (3.21) q(uj ) where A =
D
β tr 2
� �E e K
= q(X)
βξ 2
+ β2 tr (K−1 uu Φ).
The expression in (3.21) is a KL-like quantity and, therefore, q(uj ) is optimally set to be proportional to the numerator inside the logarithm of the above equation, i.e. q(uj ) ∝ e
⟨log N (yj |aj ,β −1 In )⟩q(X)
p(uj ),
(3.22)
which is just a Gaussian distribution (see Appendix B.1 for an explicit form). We can now re-insert the optimal value for q(uj ) back into Fˆj (q(X), q(uj )), to obtain: Z ⟨log N (yj |aj ,β −1 In )⟩q(X) ˆ Fj (q(X)) = log e p(uj )duj − A (3.23) Z Y n ⟨log N (yi,j |ai,j ,σ2 )− 2σ12 (kf (xi,: ,xi,: )−kf (xi,: ,Xu )K−1 uu kf (Xu ,xi,: ))⟩ q(xi,: ) = log e p(u:,j )du:,j i=1
(3.24) where the second expression uses the factorisation of the Gaussian likelihood across data points and it implies that independently of how complex the overall variational distribution q(X) could be, Fˆj will depend only on the marginals q(xi,: )s over the latent variables associated with different observations. Furthermore, notice that the above trick of finding the optimal factor q(u:,j ) and placing it back into the bound (firstly proposed in [King and Lawrence, 2006]) can be informally explained as reversing Jensen’s inequality (i.e. moving the log outside of the integral) in the initial
54
Variational Marginalisation of Latent Variables in Gaussian Process Models
bound from (3.21), as pointed out by Titsias [2009]. Notice that the expectation appearing in equation (3.23) is a standard Gaussian integral and can be calculated in closed form (for specific choices of covariance function – this is discussed below). This turns out to be (see Appendix B.1.2 for details): " Fˆj (q(X)) = log
#
1
n
β 2 |Kuu | 2 n 2
(2π) |βΦ + Kuu |
1 2
− 12 yj⊤ Wyj
e
−
� βξ β + tr K−1 uu Φ 2 2
(3.25)
where W = βIn − β 2 Ψ(βΦ + Kuu )−1 Ψ⊤ . The computation of Fˆj (q(X)) only requires computation of matrix inverses and determinants which involve Kuu instead of Kf f , something which is tractable since Kuu does not depend on X. Therefore, this expression is straightforward to compute, as long as the covariance function kf is selected so that the {Φ, Ψ, ξ} quantities of equation (3.15) can be computed analytically. To summarize, the final form of the variational lower bound on the marginal likelihood p(Y) is written as F (q(X)) = Fˆ (q(X)) − KL (q(X) ∥ p(X)) =
p X
Fˆj (q(X)) − KL (q(X) ∥ p(X)) ,
(3.26)
j=1
which is exactly as equation (3.20) but the F terms do not depend on q(U). It will be instructive for later sections notice that the above framework is, in essence, computing the following approximation analytically, Fˆ (q(X)) ≤
3.3.5
Z q(X) log p(Y|X)dX.
(3.27)
Discussion on the Different Forms of The Variational Bound
We have seen two forms of a variational lower bound on the marginal log. likelihood log p(Y). The obtained variational lower bounds closely resemble the corresponding bounds obtained by applying the method of Titsias [2009] and Hensman et al. [2013a] in standard sparse GP regression, which were discussed in Section 2.3. The difference is that now X is marginalized out so that the terms containing X, i.e. the kernel quantities tr (Kf f ), Kf u and Kf u Kuf , are transformed into averages (i.e. the {Φ, Ψ, ξ} quantities in (3.15)) with respect to the variational distribution q(X). Similarly to the variational sparse GP framework, the approximations were made tractable by using a set of inducing points. The inducing inputs, Xu , are variational parameters, so
3.3 Variational Gaussian Process Latent Variable Models
55
that optimisation over them simply improves the approximation. Analogously to the sparse GP framework, the variational GP-LVM bounds presented above differentiate depending on the way that the inducing output distribution q(U) is treated. Firstly, we can obtain a variational lower bound F (q(X), q(U)), given in equation (3.11), which depends on a variational distributions q(U)q(X). This form depends on an expectation ⟨L⟩q(U)q(X) which is given in equation (3.19) and is fully factorised, as well as on two KL terms that can also be factorised. Therefore, the overall bound is fully factorised, across datapoints and across output dimensions. In the end of Section 3.3.3 we saw that the large number of parameters associated with this approach introduces new optimisation challenges. We now contrast to the second form of the variational lower bound, summarised in equation (3.26). This formulation is obtained by collapsing q(U), resulting in an expression that can be jointly optimised over the remaining variational and model parameters. The induced optimisation procedure is then similar to the optimization of the MAP objective function employed in the standard GP-LVM, the main difference being that instead of optimizing the random variables X, we now optimize a set of variational parameters which govern the approximate posterior mean and variance for X. Given the similarity of the variational GP-LVM with the variational sparse GP framework, the same comparison (see Section 2.3.4) concerning bound quality and parallelisation holds here too. In short, the collapsed bound is “tighter” and distributable, but the uncollapsed bound is fully parallelisable. In both versions of the variational lower bound we make certain assumptions about the form and factorisation of the variational distribution. To explore these assumptions, contrast the variational distribution of equation (3.12) to the true posterior of equation (3.13). Firstly, we see that the variables U and X are decoupled in a mean field manner. This might be suboptimal, and developing variational approximations which consider correlations between these variables is an interesting path for future research. Secondly, selecting a Gaussian q(X) is only an approximation, since the true posterior p(X|Y) is expected to be a more complicated and potentially multi-modal density, as illustrated in figure 3.1. Thirdly, a key ingredient of the variational distribution is that it contains the exact conditional GP prior term p(F|U, X) which appears in the joint density in equation (3.7). As was shown, this crucially leads to cancellation of difficult terms (involving inverses and determinants over kernel matrices on X) and allows us to compute a closed-form variational lower bound. Furthermore, under this choice the conditional GP prior term p(F|U, X) attempts to approximate the corresponding exact posterior term p(F|U, Y, X). This promotes the inducing variables U to become sufficient statistics so that the optimisation of
56
Variational Marginalisation of Latent Variables in Gaussian Process Models
the variational distribution over the inducing inputs Xu attempts to construct U so that F approximately becomes conditionally independent from the data Y given U. To achieve exact conditional independence we might need to use a large number of inducing variables so that p(F|U, X) becomes very sharply picked (a delta function). In practice, however, the number of inducing variables must be chosen so that to balance between computational complexity (see Section 3.3.7) and approximation accuracy where the latter deteriorates as m becomes smaller. Similarly to the standard GP-LVM, the non-convexity of the optimisation surface means that local optima can pose a problem and, therefore, sensible initialisations have to be made. In contrast to the standard GP-LVM, in the variational GP-LVM the choice of a covariance function is limited to the class of kernels that render the {Φ, Ψ, ξ} statistics tractable. Improving on these areas (non-convex optimisation and choice of covariance function) is, thus, an interesting direction for future research. Finally, notice that the application of the variational method developed in this chapter is not restricted to the set of latent points. As in [Titsias and Lázaro-Gredilla, 2013], a fully Bayesian approach can be obtained by additionally placing priors on the kernel parameters and, subsequently, integrating them out variationally with the methodology that we described in this section.
3.3.6
Applying the Variational Framework to Different GP-LVM Variants
Unless otherwise specified, from now on we adopt the collapsed variational formulation for the models presented in this chapter, as well as for the relevant extensions described in the rest of this thesis. Under this formulation, different variational GPLVM algorithms can be obtained by varying the form of the latent space prior p(X) which so far has been left unspecified. One useful property of the variational lower bound (equation (3.26)) is that p(X) appears only in the separate KL divergence term, which can be tractably computed when p(X) is Gaussian. This allows our framework to easily accommodate different Gaussian forms for p(X) which give rise to different GP-LVM variants. In particular, incorporating a specific prior mainly requires to specify a suitable factorisation for q(X) and to compute the corresponding KL term. In contrast, the general structure of the more complicated Fˆ (q(X)) term remains unaffected. Next we demonstrate these ideas by giving further details about how to apply the variational method to the two GP-LVM variants discussed in Section 3.2.1. For both cases we follow the recipe that the factorisation of the variational distribution q(X) resembles the factorisation of the prior p(X).
3.3 Variational Gaussian Process Latent Variable Models
57
The Standard Variational GP-LVM for i.i.d. Data
In the simplest case, the latent space prior is just a standard normal density, fully factorised across datapoints and latent dimensions, as shown in (3.2). This is the typical assumption in latent variable models, such as factor analysis and PPCA [Bartholomew, 1987; Basilevsky, 1994; Tipping and Bishop, 1999]. We choose a variational distribution q(X) that follows the factorisation of the prior, q(X) =
n Y
N (xi,: |µi,: , Si ) ,
(3.28)
i=1
where each covariance matrix Si is diagonal. Notice that this variational distribution depends on 2nq free parameters. The corresponding KL quantity appearing in (3.26) takes the explicit form n
� nq 1X tr µi,: µ⊤ , KL (q(X) ∥ p(X)) = i,: + Si − log Si − 2 i=1 2 where log Si denotes the diagonal matrix resulting from Si by taking the logarithm of its diagonal elements. To train the model we simply need to substitute the above term in the final form of the variational lower bound in (3.26) and follow the gradient-based optimisation procedure. The resulting variational GP-LVM can be seen as a non-linear version of Bayesian probabilistic PCA [Bishop, 1999; Minka, 2001]. In the experiments, we consider this model for non-linear dimensionality reduction and demonstrate its ability to automatically select the latent dimensionality.
The Dynamical Variational GP-LVM for Sequence Data
We now turn into the second model discussed in Section 3.2.1, which is suitable for sequence data. Again we define a variational distribution q(X) so that it matches the factorisation of the prior, i.e. q(X) =
q Y j=1
N (xj |µj , Sj ) ,
58
Variational Marginalisation of Latent Variables in Gaussian Process Models
where Sj is a n × n full covariance matrix. By recalling the form of p(X|t) from equation (3.3), we find the following form for the corresponding KL term: KL (q(X) ∥ p(X|t)) q � � nq 1 X� −1 ⊤ tr K−1 . (3.29) = x Sj + Kx µj µj + log |Kx | − log |Sj | − 2 j=1 2
This term can be substituted into the final form of the variational lower bound in equation (3.26) and allow training using a gradient-based optimisation procedure. If implemented naively, such a procedure, will require too many parameters to tune q free parameters. However, since the variational distribution depends on nq + n(n+1) 2 by applying the reparametrisation trick suggested by Opper and Archambeau [2009] we can reduce the number of parameters in the variational distribution to just 2nq. Specifically, the stationary conditions obtained by setting to zero the first derivatives of the variational bound w.r.t. Sj and µj take the form, Sj = K−1 x + λj where Λj = −2
�−1
¯j, and µj = Kx µ
∂ Fˆ (q(X)) ∂ Fˆ (q(X)) ¯ :,j = and µ . ∂Sj ∂µ:,j
(3.30)
(3.31)
¯ :,j is a n−dimensional Here, Λj is a n × n diagonal positive definite matrix and µ vector. Notice that the fact that the gradients of Fˆ (q(X)) with respect to a full (coupled across data points) matrix Sj reduce to a diagonal matrix is because only the diagonal elements of Sj appear in Fˆ (q(X)). This fact is a consequence of the factorisation of the likelihood across data points, which results the term Fˆ (q(X)) to depend only on marginals of the full variational distribution, as it was pointed by the general expression in equation (3.24). The above stationary conditions tell us that, since Sj depends on a diagonal matrix Λj , we can reparametrise it using only the diagonal elements of that matrix, denoted by the n−dimensional vector λj . Notice that with this reparameterisation, and if we ¯ :,j ) as the set of free parameters, the bound property is retained consider the pair (λj , µ because any such pair defines a valid Gaussian distribution q(X) based on which the corresponding (always valid) lower bound is computed. Then, we can optimise the ¯ j ); after finding some values for those, we then obtain the 2qn parameters (λj , µ original parameters using the transformation in (3.30). There are two optimisation strategies, depending on the way we choose to treat
3.3 Variational Gaussian Process Latent Variable Models
59
¯ j . Firstly, inspired by Opper and Archamthe newly introduced parameters λj and µ beau [2009] we can construct an iterative optimisation scheme. More precisely, the variational bound F in equation (3.26) depends on the actual variational parameters µj and Sj of q(X), which through equation (3.30) depend on the newly introduced ¯ j and λj which, in turn, are associated with F through equation (3.31). quantities µ These observations can lead to an EM-style algorithm which alternates between estimating one of the parameter sets {θ, Xu } and {M, S} by keeping the other set fixed. An alternative approach, which is the one we use in our implementation, is to treat ¯ j as completely free ones so that equation (3.31) is never the new parameters λj and µ used. In this case, the variational parameters are optimised directly with a gradient based optimiser, jointly with the model hyperparameters and the inducing inputs. Overall, the above reparameterisation is appealing not only because of computational complexity, but also because of optimisation robustness. Indeed, equation (3.30) confirms that the original variational parameters are coupled via Kx , which is a full-rank covariance matrix. By reparametrising according to equation (3.30) and treating the new parameters as free ones, we manage to approximately break this coupling and apply our optimisation algorithm on a set of less correlated parameters. Furthermore, the methodology described above can be readily applied to model dependencies of a different nature (e.g. spatial rather than temporal), as any kind of high dimensional input variable can replace the temporal inputs of the graphical model in fig. 3.3(c). Therefore, by simply replacing the input t with any other kind of observed input Z we trivially obtain a Bayesian framework for warped GP regression [Snelson et al., 2004; Lázaro-Gredilla, 2012] for which we can predict the latent function values in new inputs Z∗ through a non-linear, latent warping layer, using exactly the same architecture and equations described in this section and in Section 3.4.2. Similarly, if the observed inputs of the top layer are taken to be the outputs themselves, then we obtain a probabilistic variational auto-encoder [e.g. Kingma and Welling, 2013] which is non-parametric and based on Gaussian processes. Finally, the dynamical variational GP-LVM can be easily extended to deal with datasets consisting of multiple independent sequences (perhaps of different length) such as those arising in human motion capture applications. Let, for example, the � dataset be a group of S independent sequences Y(1) , ..., Y(S) . We would like the dynamical version of our model to capture the underlying commonality of these data. We handle this by allowing a different temporal latent function for each of the independent sequences, so that X(i) is the set of latent variables corresponding to sequence i. These sets are a priori assumed to be independent since they correspond to separate � Q sequences, i.e. p X(1) , X(2) , ..., X(S) = Si=1 p(X(i) ). This factorisation leads to a
60
Variational Marginalisation of Latent Variables in Gaussian Process Models
block-diagonal structure for the time covariance matrix Kx , where each block corresponds to one sequence. In this setting, each block of observations Y(i) is generated from its corresponding X(i) according to Y(i) = F(i) + ϵ, where the latent function which governs this mapping is shared across all sequences and ϵ is Gaussian noise.
3.3.7
Time Complexity and Very High Dimensional Data
The developed variational framework makes use of inducing point representations which provide low-rank approximations to the covariance Kff . For the standard variational GP-LVM, this allows us to avoid the typical cubic complexity of Gaussian processes, reducing the computational cost to O(nm2 ) for the variational approximation using the collapsed bound. Since we typically select a small set of inducing points, m ≪ n, the variational GP-LVM can handle relatively large training sets (thousands of points, n). However, even if m is user defined, for good results in very large datasets we need to select m to be relatively large. Therefore, application of the collapsed variational framework to big data is difficult. On the other hand, the uncollapsed version of the framework allows considering batches of datapoints, thereby enabling its application to big data. The computation of a local q(X) has to be computed for every batch, but this can be further parallelised since q(X) factorises across data points. The dynamical variational GP-LVM, however, still requires the inversion of the covariance matrix Kx of size n × n, as can be seen in equation (3.30), thereby inducing a computational cost of O(n3 ). This prohibits its application to big data. The next chapter introduces a variational constraint framework which relaxes the full coupling of the data in the input layer. Further, the models scale only linearly with the number of dimensions p. Specifically, the number of dimensions only matters when performing calculations involving the data matrix Y. In the final form of the lower bound (and consequently in all of the derived quantities, such as gradients) this matrix only appears in the form YY⊤ which can be precomputed. This means that, when n ≪ p, we can calculate YY⊤ only once and then substitute Y with the SVD (or Cholesky decomposition) of YY⊤ . In this way, we can work with an n × n instead of an n × p matrix. Practically speaking, this allows us to work with data sets involving millions of features. In our experiments we model directly the pixels of HD quality video, exploiting this trick.
3.4 Predictions with the Variational GP-LVM
3.4
61
Predictions with the Variational GP-LVM
This section explains how the proposed Bayesian models can accomplish various kinds of prediction tasks. We will use a star (∗) to denote test quantities, e.g. a test data matrix will be denoted by Y∗ ∈ ℜn∗ ×p while test row and column vectors of such a matrix will be denoted by yi,∗ and y∗,j . The first type of inference we are interested in is the calculation of the probability density p(Y∗ |Y). The computation of this quantity can allow us to use the model as a density estimator which, for instance, can represent the class conditional distribution in a generative based classification system. We will exploit such a use in Section 3.5.5. Secondly, we discuss how from a test data matrix Y∗ = (Y∗U , Y∗O ), we can probabilistically reconstruct the unobserved part Y∗U based on the observed part Y∗O and where U and O denote non-overlapping sets of indices such that their union is {1, . . . , p}. For this second problem the missing dimensions are reconstructed by approximating the mean and the covariance of the Bayesian predictive density p(Y∗U |Y∗O , Y). Section 3.4.1 discusses how to solve the above tasks in the standard variational GP-LVM case while Section 3.4.2 discusses the dynamical case. Furthermore, for the dynamical case the test points Y∗ are accompanied by their corresponding timestamps t∗ based on which we can perform an additional forecasting prediction task, where we are given only a test time vector t∗ and we wish to predict the corresponding outputs.
3.4.1
Predictions with the Standard Variational GP-LVM
We first discuss how to approximate the density p(Y∗ |Y). By introducing the latent variables X (corresponding to the training outputs Y) and the new test latent variables X∗ ∈ ℜn∗ ×q , we can write the density of interest as the ratio of two marginal likelihoods, R p(Y∗ , Y|X, X∗ )p(X, X∗ )dXdX∗ p(Y∗ , Y) R = . (3.32) p(Y∗ |Y) = p(Y) p(Y|X)p(X)dX In the denominator we have the marginal likelihood of the GP-LVM for which we have already computed a variational lower bound. The numerator is another marginal likelihood that is obtained by augmenting the training data Y with the test points Y∗ and integrating out both X and the newly inserted latent variable X∗ . In the following, we explain in more detail how to approximate the density p(Y∗ |Y) of equation (3.32) through constructing a ratio of lower bounds. R The quantity p(Y|X)p(X)dX appearing in the denominator of equation (3.32) is approximated by the lower bound eF (q(X)) where F(q(X)) is the variational lower
62
Variational Marginalisation of Latent Variables in Gaussian Process Models
bound as computed in Section 3.3.3 and is given in equation (3.26). The maximization of this lower bound specifies the variational distribution q(X) over the latent variables in the training data. Then, this distribution remains fixed during test R time. The quantity p(Y∗ , Y|X, X∗ )p(X, X∗ )dXdX∗ appearing in the numerator of equation (3.32) is approximated by the lower bound eF (q(X,X∗ )) which has exactly analogous form to (3.26). This optimisation is fast, because the factorisation imposed for the variational distribution in equation (3.28) means that q(X, X∗ ) is also a fully factorised distribution so that we can write q(X, X∗ ) = q(X)q(X∗ ). Then, q(X) is held fixed during test time and we only need to optimise with respect to the Q ∗ 2n∗ q parameters of the variational Gaussian distribution q(X∗ ) = ni=1 q(xi,∗ ) = Qn ∗ i=1 N (µi,∗ , Si,∗ ) (where Si,∗ is a diagonal matrix). Further, since the {ξ, Ψ, Φ} statistics decompose across data, during test time we can re-use the already estimated statistics corresponding to the averages over q(X) and only need to compute the extra average terms associated with q(X∗ ). Note that optimization of the parameters (µi,∗ , Si,∗ ) of q(xi,∗ ) are subject to local minima. However, sensible initializations of µ∗ can be employed based on the mean of the variational distributions associated with the nearest neighbours of each test point yi,∗ in the training data Y. Given the above, the approximation of p(Y∗ |Y) is given by rewriting equation (3.32) as, p(Y∗ |Y) ≈ eF (q(X,X∗ ))−F (q(X)) .
(3.33)
Notice that the above quantity does not constitute a bound, but only an approximation to the predictive density. We now discuss the second prediction problem where a set of partially observed test points Y∗ = (Y∗U , Y∗O ) are given and we wish to reconstruct the missing part Y∗U . The predictive density is, thus, p(Y∗U |Y∗O , Y). Notice that Y∗U is totally unobserved and, therefore, we cannot apply the methodology described previously. Instead, our objective now is to just approximate the moments of the predictive density. To achieve this, we will first need to introduce the underlying latent function values FU∗ (the noisy-free version of Y∗U ) and the latent variables X∗ so that we can decompose the exact predictive density as follows, U
O
p(Y∗ |Y∗ , Y) =
Z
p(Y∗U |FU∗ )p(FU∗ |X∗ , Y∗O , Y)p(X∗ |Y∗O , Y)dFU∗ dX∗ .
Then, we can introduce the approximation coming from the variational distribution
63
3.4 Predictions with the Variational GP-LVM so that U
O
U
Z
O
p(Y∗ |Y∗ , Y) ≈ q(Y∗ |Y∗ , Y) =
p(Y∗U |FU∗ )q(FU∗ |X∗ )q(X∗ )dFU∗ dX∗ (3.34) ,
based on which we wish to predict Y∗U by estimating its mean E(Y∗U ) and covariance Cov(Y∗U ). This problem takes the form of GP prediction with uncertain inputs similar to [Girard et al., 2003; Oakley and O’Hagan, 2002], where the distribution q(X∗ ) expresses the uncertainty over these inputs. The first term of the above integral comes from the Gaussian likelihood, so Y∗U is just a noisy version of FU∗ , as shown in equation (2.4). The remaining two terms together q(FU∗ |X∗ )q(X∗ ) are obtained by applying the variational methodology to optimise a variational lower bound on the following log marginal likelihood: Z
O
log p(Y∗ , Y) = log Z = log
p(Y∗O , Y|X∗ , X)p(X∗ , X)dX∗ dX p(YU |X)p(Y∗O , YO |X∗ , X)p(X∗ , X)dX∗ dX, (3.35)
which is associated with the total set of observations (Y∗O , Y). By following exactly Section 3.3, we can construct and optimise a lower bound F(q(X, X∗ )) on the above quantity, which along the way allows us to compute a Gaussian variational distribution q(F, FU∗ , X, X∗ ) from which q(FU∗ |X∗ )q(X∗ ) is just a marginal. Further details about the form of the variational lower bound and how q(FU∗ |X∗ ) is computed are given in the Appendix B.4. In fact, the explicit form of q(FU∗ |X∗ ) is a factorised Gaussian: U
q(F∗ |X∗ ) =
p Y
U p(f∗,j |uj , X∗ )
j=1
where each factor takes the form of the projected process predictive distribution from sparse GPs [Csató and Opper, 2002; Seeger et al., 2003; Rasmussen and Williams, 2006]: −1 Ku∗ q(f∗,j |X∗ ) = N f∗,j |K∗u B, K∗∗ − K∗u K−1 uu + (Kuu + βΦ)
��
with B = β(Kuu + βΦ)−1 Ψ⊤ yj , K∗∗ = kf (X∗ , X∗ ) and K∗u = kf (X∗ , Xu ). However, by marginalising the latent variables, as required by equation 3.34, the dimensions of each point becomes coupled, producing a non-Gaussian, multivariate density. However, based on the results of Girard et al. [2003], we can still compute
64
Variational Marginalisation of Latent Variables in Gaussian Process Models
the moments of this density analytically, if the covariance function is selected so that the {ξ, Ψ, Φ} quantities are tractable. Therefore, the predictive density of equation 3.34 corresponds to a set of marginals, each referring to a test instance and having the following moments: U E(fi,∗ ) = B⊤ ψ ∗
� U Cov(fi,∗ ) = B⊤ Φ∗ − ψ∗ ψ∗⊤ B + ξ∗ I − tr
� −1 � Φ∗ I, K−1 uu − (Kuu + βΦ)
� where ξ∗ = ⟨kf (x∗ , x∗ )⟩, ψ∗ = ⟨Ku∗ ⟩ and Φ∗ = Ku∗ K⊤ u∗ . All expectations are taken w.r.t. q(x∗ ) and can be calculated analytically for several kernel functions as explained in Section 3.3.3 and Appendix B.2. Using the above expressions and the Gaussian noise model of equation (2.4), we have: � U � � U� E yi,∗ = E fi,∗
3.4.2
and
U U Cov(yi,∗ ) = Cov(fi,∗ ) + β −1 I.
(3.36)
Predictions in the Dynamical Model
The two prediction tasks described in the previous section for the standard variational GP-LVM can also be solved for the dynamical variant in a very similar fashion. Specifically, the two predictive approximate densities take exactly the same form as those in equations (3.33) and (3.34) while again the whole approximation relies on the maximisation of a variational lower bound F(q(X, X∗ )). However, in the dynamical case where the inputs (X, X∗ ) are a priori correlated, the variational distribution q(X, X∗ ) does not factorise across X and X∗ . This makes the optimisation of this distribution computationally more challenging, as it has to be optimised with respect to its all 2(n + n∗ )q parameters. This issue is further explained in Appendix B.4.1. Finally, we shall discuss how to solve the forecasting problem with our dynamical model. This problem is similar to the second predictive task described in Section 3.4.1, but now the observed set is empty. We can therefore write the predictive density similarly to equation (3.34) as follows, Z p(Y∗ |Y) ≈
p(Y∗ |F∗ )q(F∗ |X∗ )q(X∗ )dX∗ dF∗ .
The inference procedure then follows exactly as before, using equations (3.34) and (3.36). The only difference is that the computation of q(X∗ ) (associated with a fully unobserved Y∗ ) is obtained from standard GP prediction and does not require opti-
65
3.5 Demonstration of the Variational Framework misation, i.e., Z q(X∗ ) =
p(X∗ |X)q(X)dX =
q Z Y
p(x∗,j |xj )q(xj )dxj ,
j=1
where p(x∗,j |xj ) is a Gaussian found from the conditional GP prior (see Rasmussen and Williams [2006]). Since q(X) is Gaussian, the above is also a Gaussian with mean and variance given by, µx∗,j = K∗f µ ¯j −1 var(x∗,j ) = K∗∗ − K∗f (Kx + λ−1 j ) Kf ∗ ,
where K∗f = kx (t∗ , t), K∗f = K⊤ ∗f and K∗∗ = kx (t∗ , t∗ ). Notice that these equations have exactly the same form as found in standard GP regression problems.
3.5
Demonstration of the Variational Framework
This section investigates the performance of the variational GP-LVM and its dynamical extension. The variational GP-LVM allows us to handle very high dimensional data and, using ARD, to determine the underlying low dimensional subspace size automatically. The generative construction allows us to impute missing values when presented with only a partial observation. The models’ performance is evaluated in a variety of tasks, namely visualisation, prediction, reconstruction, generation of data or timeseries and class-conditional density estimation. Matlab source code for repeating the following experiments is available on-line from: https://github.com/SheffieldML/vargplvm and supplementary videos from: http://git.io/A3t5. The experiments section is structured as follows; Section 3.5.1 outlines the covariance functions used for the experiments. Section 3.5.2 demonstrates the developed method in a standard visualisation benchmark. Section 3.5.3 is concerned with testing both the standard and dynamical variant of the method in a real-world motion capture dataset. Section 3.5.4 illustrates how the developed model is able to handle a very large number of dimensions by working directly with the raw pixel values of high resolution videos. Additionally, it is shown how the dynamical model can interpolate and also extrapolate in certain scenarios. Section 3.5.5 considers a classification task on a standard benchmark, exploiting the fact that our framework gives access to the model evidence, thus enabling Bayesian classification.
66
Variational Marginalisation of Latent Variables in Gaussian Process Models
3.5.1
Covariance Functions
Before proceeding to the actual evaluation of our method, we first review and give the forms of the covariance functions that will be used for our experiments. The mapping between the input and output spaces X and Y is non-linear and, thus, we use the ARD covariance function of equation (2.7) which also allows simultaneous model selection within our framework. In experiments where we use our method to also model dynamics, apart from the infinitely differentiable exponentiated quadratic covariance function defined in equation (2.6), we will also consider for the dynamical component the Matérn 3/2 covariance function which is only once differentiable, and a periodic one [Rasmussen and Williams, 2006; MacKay, 1998] which can be used when data exhibit strong periodicity. These covariance functions are given in equations (2.9) and (2.10) respectively. Introducing a separate GP model for the dynamics is a very convenient way of incorporating any prior information we may have about the nature of the data in a nonparametric and flexible manner. In particular, more sophisticated covariance functions can be constructed by combining or modifying existing ones. For example, in our experiments we consider a compound covariance function, kx(per) + kx(rbf) which is suitable for dynamical systems that are known to be only approximately periodic. The first term captures the periodicity of the dynamics whereas the second one corrects for the divergence from the periodic pattern by enforcing the datapoints to form 2 2 smooth trajectories in time. By fixing the two variances, σper and σrbf to particular ratios, we are able to control the relative effect of each kernel. Example sample paths drawn from this compound covariance function are shown in figure 2.3. For our experiments we additionally include a noise (equation (2.11)) and a bias covariance function θbias 1.
3.5.2
Visualisation Tasks
Given a dataset with known structure, we can apply our algorithm and evaluate its performance in a simple and intuitive way, by checking if the form of the discovered low dimensional manifold agrees with our prior knowledge. The method is illustrated in the oil flow data [Bishop and James, 1993] that consists of n = 1, 000, p = 12 dimensional observations to be stored in a matrix Y and belonging to three known classes corresponding to different phases of oil flow. Figure 3.5 shows the results for these data obtained by applying the variational GPLVM with 10 latent dimensions using the exponentiated quadratic ARD kernel. The
3.5 Demonstration of the Variational Framework
67
means of the variational distribution were initialized using PCA, while the variances in the variational distribution were initialized to neutral values around 0.5. As shown in figure 3.4, the algorithm switches off 8 out of q = 10 latent dimensions by making their inverse lengthscales almost zero. Therefore, the two-dimensional nature of this dataset is automatically revealed. Figure 3.5a shows the visualization obtained for the latent space X by keeping only the dominant latent directions which are the dimensions 2 and 3. Notice that the algorithm does not know the datapoint labels, but we will use them to assess the clustering emerging after performing unsupervised learning. The results of figure 3.5a constitute a remarkably high quality two dimensional visualization of this data. For comparison, Figure 3.5b shows the visualization provided by the standard sparse GP-LVM that runs by a priori assuming only 2 latent dimensions. Both models use 50 inducing variables, while the latent variables X optimized in the standard GP-LVM are initialized based on PCA. Note that if we were to run the standard GP-LVM with 10 latent dimensions, the model would overfit the data, it would not reduce the dimensionality in the manner achieved by the variational GP-LVM. The quality of the class separation in the two-dimensional space can also be quantified in terms of the nearest neighbour error; the total error equals the number of training points whose closest neighbour in the latent space corresponds to a data point of a different class (phase of oil flow). The number of nearest neighbour errors made when finding the latent embedding with the standard sparse GP-LVM was 26 out of 1000 points, whereas the variational GP-LVM resulted in only one error.
3.5.3
Human Motion Capture Data
In this section we consider a data set associated with temporal information, as the primary focus of this experiment is on evaluating the dynamical version of the variational GP-LVM. We followed Taylor et al. [2007]; Lawrence [2007a] in considering motion capture data of walks and runs taken from subject 35 in the CMU motion capture database. We used the dynamical version of our model and treated each motion as an independent sequence. The data set was constructed and preprocessed as described in [Lawrence, 2007a]. This results in 2613 separate 59-dimensional frames split into 31 training sequences with an average length of 84 frames each. All these frames are stored by rows in the n × p matrix Y. Our model does not require explicit timestamp information, since we know a priori that there is a constant time delay between poses and the model can construct equivalent covariance matrices given any vector of equidistant time points, e.g. for every sequence s containing n(s) frames, we use some scaled version of t = (1, 2, ..., n(s) )⊤ .
68
Variational Marginalisation of Latent Variables in Gaussian Process Models
0.035
wj
wj
0.03
0.025
0.02
0.015
0.01
0.005
j
j 0 1
2
(a) Variational GP-LVM
3
4
5
6
7
8
9
10
(b) GP-LVM
Fig. 3.4: Left: The squared inverse lengthscales found by applying the variational GP-LVM with ARD EQ kernel on the oil flow data. Right: Results obtained for the standard GP-LVM with q = 10. These results demonstrate the ability of the variational GP-LVM to perform a “soft” automatic dimensionality selection. The inverse lengthscale for each dimension is associated with the expected number of the function’s upcrossings in that particular direction (dimension); smaller values denote a more linear behaviour, whereas values close to zero denote an irrelevant dimension. For the variational GP-LVM, figure (a) suggests that the nonlinearity is captured by dimension 2, as also confirmed by figure 3.5a. On the other hand, figure (b) demonstrates the overfitting problem of the GP-LVM which is trained with MAP.
x2
x2 1.5
1.5
1 1
0.5
0.5
0
0
−0.5
−0.5
−1
−1
−1.5
−1.5
−2
−2 −3
−2
−1
0
(a)
1
2
x3
−2
−1
0
(b)
1
2
x3
Fig. 3.5: Panel 3.5a shows the means of the variational posterior q(X) for the variational GPLVM, projected on the two dominant latent dimensions. Here the dominant latent dimensions are 2 and 3. Dimension 2 is plotted on the y-axis and 3 and on the x-axis. The plotted projection of a latent point xi,: is assigned a colour according to the label of the corresponding output vector xi,: . The greyscale intensities of the background are proportional to the predicted variance of the GP mapping, if the corresponding locations were given as inputs. Plot 3.5b shows the visualisation found by standard sparse GP-LVM initialised with a two dimensional latent space. The nearest neighbour error count for the variational GP-LVM is one. For the standard sparse GP-LVM it is 26, for the full GP-LVM with ARD kernel the error is 8 and for the full GP-LVM with EQ kernel the error is 2. Note that selecting q = 2 for the standard GP-LVM models is equivalent to a priori revealing the true dimensionality of the data .
3.5 Demonstration of the Variational Framework
69
The model is jointly trained, as explained in the last paragraph of Section 3.3.6, on both walks and runs, i.e. the algorithm learns a common latent space for these motions. At test time we investigate the ability of the model to reconstruct test data from a previously unseen sequence given partial information for the test targets. This is tested once by providing only the dimensions which correspond to the body of the subject and once by providing those that correspond to the legs. We compare with results in [Lawrence, 2007a], which used MAP approximations for the dynamical models, and against nearest neighbour. We can also indirectly compare with the binary latent variable model (BLV) of Taylor et al. [2007] which used a slightly different data preprocessing. Furthermore, we additionally tested the non-dynamical version of our model, to explore the structure of the distribution found for the latent space. In this case, the notion of sequences or sub-motions is not modelled explicitly, as the non-dynamical approach does not model correlations between datapoints. However, as will be shown below, the model manages to discover the dynamical nature of the data and this is reflected in both the structure of the latent space and the results obtained on test data. The performance of each method is assessed by using the cumulative error per joint in the scaled space defined in [Taylor et al., 2007] and by the root mean square error in the angle space suggested by Lawrence [2007a]. Our models were initialized with nine latent dimensions. For the dynamical version, we performed two runs, once using the Matérn covariance function for the dynamical prior and once using the exponentiated quadratic. The appropriate latent space dimensionality for the data was automatically inferred by our models. The non-dynamical model selected a 5-dimensional latent space. The model which employed the Matérn covariance to govern the dynamics retained four dimensions, whereas the model that used the exponentiated quadratic kept only three. The other latent dimensions were completely switched off by the ARD parameters. From Table 3.1 we see that the dynamical variational GP-LVM considerably outperforms the other approaches. The best performance for the legs and the body reconstruction was achieved by our dynamical model that used the Matérn and the exponentiated quadratic covariance function respectively. This is perhaps an intuitive result, since the smoother body movements might be expected to be better modelled using the infinitely differentiable exponentiated quadratic covariance function, whereas the Matérn one could provide a better fit to the rougher leg motion. However, although it is important to take into account any available information about the nature of the data, the fact that both models outperform significantly other approaches shows that
70
Variational Marginalisation of Latent Variables in Gaussian Process Models
the Bayesian training manages successfully to fit the covariance function parameters to the data in any case. Furthermore, the non-dynamical variational GP-LVM, not only manages to discover a latent space with a dynamical structure, as can be seen in figure 3.6a, but is also proven to be very robust when making predictions. Indeed, Table 3.1 shows that the non-dynamical variational GP-LVM typically outperforms nearest neighbor and its performance is comparable to the GP-LVM which explicitly models dynamics using MAP approximations. Finally, it is worth highlighting the intuition gained by investigating Figure 3.6. As can be seen, all models split the encoding for the “walk” and “run” regimes into two subspaces. Further, we notice that the smoother the latent space is constrained to be, the less “circular” is the shape of the “run” regime latent space encoding. This can be explained by noticing the “outliers” in the top left and bottom positions of plot (a). These latent points correspond to training positions that are very dissimilar to the rest of the training set but, nevertheless, a temporally constrained model is forced to accommodate them in a smooth path. The above intuitions can be confirmed by interacting with the model in real time graphically, as is presented in the supplementary video (http://youtu.be/fHDWloJtgk8).
(a)
(b)
(c)
Fig. 3.6: The latent space discovered by our models, projected into its three principle dimensions. The latent space found by the non-dynamical variational GP-LVM is shown in (a), by the dynamical model which uses the Matérn in (b) and by the dynamical model which uses the exponentiated quadratic in (c).
3.5.4
Modeling Raw High Dimensional Video Sequences
For this set of experiments we considered video sequences (see supplementary videos at http://git.io/A3t5). Such sequences are typically preprocessed before modeling to extract informative features and reduce the dimensionality of the problem. Here we work directly with the raw pixel values to demonstrate the ability of the dynamical variational GP-LVM to model data with a vast number of features. This also allows us to directly sample video from the learned model. Notice that the images presented
71
3.5 Demonstration of the Variational Framework
wj
wj
j (a)
j (b)
Fig. 3.7: The values of the scales of the ARD kernel after training on the motion capture dataset using the exponentiated quadratic (fig: (a)) and the Matérn (fig: (b)) kernel to model the dynamics for dynamical variational GP-LVM. The scales that have zero value “switch off” the corresponding dimension of the latent space. The latent space is, therefore, 3-D for (a) and 4-D for (b). Note that the scales were initialized with very similar values.
in this section are scaled to fit the page; the original images (frames) with which our model worked had a much higher dimensionality (number of pixels). Firstly, we used the model to reconstruct partially observed frames from test video sequences 2 . For the first video discussed here we gave as partial information approximately 50% of the pixels while for the other two we gave approximately 40% of the pixels on each frame. The mean squared error per pixel was measured to compare with the k−nearest neighbour (NN) method, for k ∈ (1, .., 5) (we only present the error achieved for the best choice of k in each case). The datasets considered are the following: firstly, the ‘Missa’ dataset, a standard benchmark used in image processing. This is a 103,680-dimensional video, showing a woman talking for 150 frames. The data is challenging as there are translations in the pixel space. We also considered an HD video of dimensionality 9 × 10⁵ that shows an artificially created scene of ocean waves as well as a 230, 400−dimensional video showing a dog running for 60 frames. The later is approximately periodic in nature, containing several paces from the dog. For the first two videos we used the Matérn and exponentiated quadratic covariance functions respectively to model the dynamics and interpolated to reconstruct blocks of frames chosen from the whole sequence. For the ‘dog’ dataset we constructed a compound kernel kx = kx(rbf) + kx(per) presented in section 3.5.1, where the exponentiated quadratic (RBF) term is employed to capture any divergence 2
‘Missa’ dataset: cipr.rpi.edu. ‘Ocean’: cogfilms.com (thanks to Colin Litster). ‘Dog’: fitfurlife.com (thanks to “Fit Fur Life”). See details in supplementary (http://git.io/A3t5). The logo appearing in the ‘dog’ images in the experiments that follow, has been added with post-processing of the video (after the experiments) to acknowledge the source.
72
Variational Marginalisation of Latent Variables in Gaussian Process Models
(a)
(b)
Fig. 3.8: The prediction for two of the test angles for the body (fig: 3.8a) and for the legs part (fig: 3.8a). Continuous line is the original test data, dotted line is nearest neighbour in scaled space, dashed line is dynamical variational GP-LVM (using the exponentiated quadratic kernel for the body reconstruction and the Matérn for the legs).
from the approximately periodic pattern. We then used our model to reconstruct the last 7 frames extrapolating beyond the original video. As can be seen in Table 3.2, our method outperformed NN in all cases. The results are also demonstrated visually in Figures 3.9, 3.10, 3.11 and 3.12 and the reconstructed videos are available in the supplementary material. As can be seen in figures 3.9, 3.10 and 3.11, the dynamical variational GP-LVM predicts pixels which are smoothly connected with the observed part of the image, whereas the NN method cannot fit the predicted pixels in the overall context. Figure 3.9(c) focuses on this specific problem with NN, but it can be seen more evidently in the corresponding video files. As a second task, we used our generative model to create new samples and generate a new video sequence. This is most effective for the ‘dog’ video as the training examples were approximately periodic in nature. The model was trained on 60 frames (time-stamps [t1 , t60 ]) and we generated new frames which correspond to the next 40 time points in the future. The only input given for this generation of future frames was the time-stamp vector, [t61 , t100 ]. The results show a smooth transition from training to test and amongst the test video frames. The resulting video of the dog continuing to run is sharp and high quality. This experiment demonstrates the ability of the model to reconstruct massively high dimensional images without blurring. Frames from the result are shown in Figure 3.14. The full video is available on-line (http://youtu.be/mUY1XHPnoCU).
73
3.5 Demonstration of the Variational Framework
Table 3.1: Errors obtained for the motion capture dataset considering nearest neighbour in the angle space (NN) and in the scaled space (NN sc.), GP-LVM, BLV, variational GP-LVM (VGP-LVM) and dynamical VGP-LVM (Dyn. VGP-LVM). CL / CB are the leg and body data sets as preprocessed in [Taylor et al., 2007], L and B the corresponding datasets from Lawrence [2007a]. SC corresponds to the error in the scaled space, as in Taylor et al. while RA is the error in the angle space. The best error per column is in bold.
Data Error Type BLV NN sc. GPLVM (Q = 3) GPLVM (Q = 4) GPLVM (Q = 5) NN sc. NN VGP-LVM Dyn. VGP-LVM (Exp. Quadr.) Dyn. VGP-LVM (Matérn 3/2)
CL SC 11.7 22.2 -
CB SC 8.8 20.5 -
L SC 11.4 9.7 13.4 13.5 14.0 14.22 7.76 6.84
L RA 3.40 3.38 4.25 4.44 4.11 5.09 3.28 2.94
B SC 16.9 20.7 23.4 20.8 30.9 18.79 11.95 13.93
B RA 2.49 2.72 2.78 2.62 3.20 2.79 1.90 2.24
Table 3.2: The mean squared error per pixel for the dynamical variational GP-LVM and nearest neighbor for the three datasets (measured only in the missing inputs). The number of latent dimensions automatically selected by our model is in parenthesis.
Dyn. VGP-LVM NN
3.5.5
Missa 2.52 (Q = 12) 2.63
Ocean 9.36 (Q = 9) 9.53
Dog 4.01 (Q = 6) 4.15
Class Conditional Density Estimation
Here we demonstrate the utility of the variational GP-LVM as a generative classifier. We considered the task of handwritten digit recognition through the well known USPS digits dataset [Hull, 1994]. This dataset consists of 16 × 16 images for all 10 digits and it is divided into 7, 291 training and 2, 007 test instances. 10 variational GP-LVMs were run in total, one for each digit. That is, for each class c, we constructed a training matrix Y(c) containing only the digit instances belonging to class c and trained with this matrix a separate model which we refer to as M(c) . 10 latent dimensions and 50 inducing variables were used for each model. This allowed us to build a probabilistic generative model for each digit so that we can compute Bayesian
74
Variational Marginalisation of Latent Variables in Gaussian Process Models
(a) Reconstruction by Dyn. var. GP-LVM.
(b) Ground truth.
(c) Reconstruction by nearest neighbour.
Fig. 3.9: (a) and (c) show the reconstruction achieved by the dyn. var. GP-LVM and nearest neighbour (NN) respectively for one of the most challenging frames (b) of the ‘missa’ video, i.e. when translation occurs. In contrast to NN, which works in the whole high dimensional pixel space, our method reconstructed the images using a 12-dimensional compression.
class conditional densities in the test data having the form p(Y∗ |Y(c) , M(c) ). These class conditional densities are approximated through the ratio of lower bounds in eq. (3.33) as described in Section 3.4. The whole approach allows us to classify new digits by determining the class labels for test data based on the highest class conditional density value and using a uniform prior over class labels. The following comparisons were used: firstly, a logistic classification approach. Secondly, a vanilla SVM from scikit-learn [Pedregosa et al., 2011], for which the error parameter C was selected with 5−fold cross validation. Thirdly, a GP classification approach with EP approximation from GPy [authors, 2014]. Lastly, the recent variational inference based GP classification approach of Hensman et al. [2014b], referred to as “GP classification with VI” and taken from the GPy [authors, 2014] implementation. All of these methods operated in a 1-vs-all setting. The results of our experiments are shown in Table 3.3. In addition to the standard baselines reported here, more sophisticated schemes
75
3.5 Demonstration of the Variational Framework
(many of which result in better performance) have been tried in this dataset by other researchers; a summary of previously published results can be found in [Keysers et al., 2002]. Table 3.3: The test error made in the whole set of 2007 test points by the variational GP-LVM, 1-vs-all Logistic Regression, SVM classification and two types of GP classification.
variational GP-LVM (m = 50) 1-vs-all Logistic Regression 1-vs-all GP classification with VI (m = 50) 1-vs-all GP classification with VI (m = 150) 1-vs-all GP classification with VI (m = 250) 1-vs-all GP classification with EP (m = 50) 1-vs-all GP classification with EP (m = 150) 1-vs-all GP classification with EP (m = 250) 1-vs-all SVM
3.5.6
# misclassified 95 283 100 100 99 139 128 126 119
error (%) 4.73 % 14.10 % 4.98 % 4.98 % 4.93 % 6.93 % 6.38 % 6.28 % 5.92 %
Big Data
In this preliminary experiment we considered 20, 000 motion capture examples taken from the CMU motion capture database. The examples correspond to 12 different subjects and 95 different motions (representing actions like walking, dancing, etc). The aim of this experiment was to learn the concept of “human motion”, given the very diverse set of instances. We applied the stochastic optimisation procedure described in the end of Section 3.3.3, with m = 100, q = 20, batchsize equal to 100 and exponentiated quadratic ARD covariance function. We found that the optimisation was very sensitive to the policy for adapting the learning rate. Therefore, we used the improved policy of Hensman et al. [2014a]. The trace of the learning rate is plotted in figure 3.15. Further, figure 3.16 illustrates the learned latent spaces, i.e. the variational means for every marginal q(xi,: ) are projected (in pairs) on the three most dominant dimensions (according to the ARD prior). As can be seen, the first pair of latent dimensions (figure 3.16a) seems to encode global motion characteristics; notice the ‘ξ’ shaped path representing the continuity and periodicity of the motions (i.e. it is a feature shared across all motions). In contrast, the second pair of latent dimensions (figure 3.16b) seems to encode more “local” characteristics, since they are grouped in various clusters (i.e. features that are private to subsets of motions).
76
Variational Marginalisation of Latent Variables in Gaussian Process Models
We quantitatively evaluated the method by measuring the error in reconstructing the upper body given information corresponding to the lower body and taken from novel motions. This was achieved by using the output reconstruction framework described in Section 3.4.1. For comparison, we trained a regular, collapsed variational GP-LVM in subsets of the data and averaged the error. Further, we trained a sparse GP on the full dataset, formulated so that lower body features of the examples constituted inputs and the upper body constituted outputs. The stochastic method outperformed the collapsed variational GP-LVM, signifying that the method is able to successfully learn from all available information. However, the sparse GP outperformed both of the GP-LVM based approaches. This perhaps signifies that compressing a massive dataset in a small latent space is suboptimal and, potentially, points towards the direction of scalable deep Gaussian processes.
3.6
Discussion
This chapter introduced an approximation to the marginal likelihood of the Gaussian process latent variable model in the form of a variational lower bound. This provides a Bayesian training procedure which is robust to overfitting and allows for the appropriate dimensionality of the latent space to be automatically determined. The framework was extended for the case where the observed data constitute multivariate timeseries and, therefore, this gave rise to a very generic method for dynamical systems modelling able to capture complex, non-linear correlations. This chapter also demonstrated the advantages of the rigorous lower bound defined in our framework on a range of disparate real world data sets. This also emphasized the ability of the model to handle vast dimensionalities. The above approach can be easily extended to be applied to training Gaussian processes with uncertain or partially observed inputs where these inputs have Gaussian prior densities. This is examined in the next chapter, where it is also shown how an auto-regressive and a semi-supervised GP variant of our model emerge. Promising future research includes several other extensions that become computationally feasible using the same set of methodologies discussed in this chapter. In particular, propagation of uncertain inputs through the Gaussian process allows Bayes filtering [Ko and Fox, 2009; Deisenroth et al., 2012; Frigola et al., 2014] applications to be carried out through variational bounds. Bayes filters are non-linear dynamical systems where time is discrete and the observed data yt at time point t, is non-linearly
77
3.6 Discussion related to some unobserved latent state, xt , yt = f (xt ) which itself has a non-linear autoregressive relationship with past latent states: xt = g(xt−1 )
where both g(·) and f (·) are assumed to be Gaussian processes. Propagation of the uncertainty through both processes can be achieved through our variational lower bound allowing fast efficient approximations to Gaussian process dynamical models. The variational methodology also constitutes a key ingredient of the deep Gaussian process framework that will be presented in Chapter 6. In a deep Gaussian process the idea of placing a temporal prior over the inputs to a GP is further extended by hierarchical application. Note on chapter’s contributions Since this chapter did not solely include developments associated with new contributions of this thesis, I will clarify my contributions in this paragraph. To start with, the idea and extension of the variational GP approach [Titsias, 2009] to the GP-LVM was originally proposed by Titsias and Lawrence [2010] (a paper where I do not appear as an author). The journal version of that paper is [Damianou et al., 2015], where myself and Titsias appear as joint first authors. That version lent text to this chapter, and adds many more details about the properties of the method and the inference method followed during test time, detailed equations for the derivations and gradients (often rewritten for improved numerical stability), extension to vast dimensionalities and extra experiments. More importantly, it also contains the extension of the framework to the case of coupled latent inputs, with the corresponding conference publication [Damianou et al., 2011] containing myself as first author. Finally, in this chapter I demonstrated how recent developments in the variational GP approximation ([Hensman et al., 2013a; Gal et al., 2014; Dai et al., 2014]) can be incorporated in the overall framework. In particular, the stochastic variational inference extension has been published in [Hensman et al., 2014a] where I appear as a second author and the distributed computations framework has been published in [Dai et al., 2014], where I also appear as a second author.
78
Variational Marginalisation of Latent Variables in Gaussian Process Models
(a) Given test image with partially observed pixels.
(b) Reconstructed test image.
Fig. 3.10: Another example of the reconstruction achieved by the dynamical variational GPLVM given the partially observed image.
3.6 Discussion
79
(a) Dyn. VGP-LVM reconstruction.
(b) Nearest neighbour reconstruction.
(c) Close-up of the problematic discontinuity occuring in the nearest neighbour reconstruction.
Fig. 3.11: (a) (Dyn. VGP-LVM) and (b) (NN) depict the reconstruction achieved for a frame of the ‘ocean’ dataset (60% missing pixels). Notice that in both of the datasets, our method recovers a smooth image, in contrast to the simple NN (a close up of this problem with NN for the ‘ocean’ video is shown in figure (c)). VGP-LVM reconstructed the ocean images using a 9-dimensional compression for the video.
80
Variational Marginalisation of Latent Variables in Gaussian Process Models
(a) Test image (with 60% missing pixels) presented to the model.
(b) Reconstruction achieved by the dynamical variational GP-LVM.
Fig. 3.12: An example for the reconstruction achieved for the ‘dog’ dataset, where 60% of the test image’s pixels were missing. Reconstruction was achieved based on temporal as well as present pixel information.
81
3.6 Discussion
wj
wj
j (a)
j (b)
Fig. 3.13: Here, we also demonstrate the ability of the model to automatically select the latent dimensionality by showing the initial lengthscales (fig: (a)) of the ARD covariance function and the values obtained after training (fig: (b)) on the ‘dog’ data set.
82
Variational Marginalisation of Latent Variables in Gaussian Process Models
(a) Last frame of the training video.
(b) First frame of the generated video.
(c) A subsequent generated frame.
Fig. 3.14: The last frame of the training video (a) is smoothly followed by the first frame (b) of the generated video. A subsequent generated frame can be seen in (c).
83
3.6 Discussion
0.008
0.006
0.004
0.002
0
500
1500
2500
3500
Fig. 3.15: Stochastic optimisation for the uncollapsed variational GP-LVM: adaptive steplength trace for the big data, motion capture experiment.
(a) Latent dimensions 1 vs 2.
(b) Latent dimensions 3 vs 6.
Fig. 3.16: Latent space projections for the uncollapsed variational GP-LVM which was stochastically optimised on 20K motion capture instances.
Chapter 4 Uncertain Inputs in Variational Gaussian Processes In the previous chapter we considered the typical dimensionality reduction scenario where, given high-dimensional outputs, we seek to find a low-dimensional latent representation in an unsupervised manner. For the dynamical variational GP-LVM we have additional temporal information, but the input space X from where we propagate the uncertainty is still treated as fully unobserved. However, our framework for propagating input uncertainty through GP mappings is applicable to the full spectrum of cases, ranging from fully unobserved (i.e. latent) to fully observed inputs with known or unknown amount of uncertainty per input. This observation gives rise to a more general variational framework for GP training and prediction with uncertain inputs. This section analyses this framework and, further, discusses three special cases: firstly, an auto-regressive GP algorithm for iterative future state simulation (Section 4.3.2). Secondly, a semi-supervised GP algorithm (Section 4.3.3) for classification when the class labels (outputs) are only partially observed. We show how a particular interpretation of this case as a data imputation problem allows us to solve it by using intermediate latent variable representations. Thirdly, we introduce and propose a GP approach for a type of learning that we “christen” semi-described learning (Section 4.3.1). We define semi-described learning to be the scenario where missing values occur in the inputs, rather than in the outputs. This scenario has not been much studied in the context of GPs due to challenges arising from handling input uncertainty. Previous approaches to uncertain input GPs cannot be straightforwardly applied to semi-described learning, since they only consider input uncertainty at test time. In all three scenarios listed above, our solutions rely on combining our uncertain inputs GP framework with algorithms that probabilistically impute missing values
86
Uncertain Inputs in Variational Gaussian Processes
while propagating the uncertainty in the next step of the learning procedure.
4.1
Background
Gaussian processes have been used extensively and with great success in a variety of regression tasks. In the most common setting we are given a dataset of observed input-output pairs, collected in matrices1 Z and Y respectively, and we wish to infer the unknown outputs Y∗ corresponding to some novel given inputs Z∗ . In many real-world applications the outputs can contain missing values, something which is known as semi-supervised learning. For example, consider the task of learning to classify images where the labelled set is much smaller than the total set. Similarly to Kingma et al. [2014] we recognise the semi-supervised problem as a data imputation problem where unlabelled data are not ignored but, rather, exploited through an intermediate latent representation. This latent representation is compact, less noisy and semantically richer (since it encapsulates information also from unlabelled data). Associating uncertainty with this representation is crucial, as this would allow us to sample from it and populate the training set in a principled manner. However, another often encountered problem in regression has to do with missing values in the input features (e.g. missing pixels in input images). This situation can arise during data collection, for example when measurements come from noisy sensors, e.g. microarray analysis [Liu et al., 2006]. In contrast to semi-supervised learning, this case has not been studied in the context of Gaussian processes, due to the challenge of handling the input uncertainty. In this chapter we introduce the notion of semi-described learning to refer to this scenario. Our aim is then to develop a general framework that solves the semi-supervised and semi-described learning. We also consider the related forecasting regression problem, which is seen as a pipeline where predictions are obtained iteratively in an auto-regressive manner, while propagating the uncertainty across the predictive sequence, as in [Girard et al., 2003; QuiñoneroCandela et al., 2003]. Here, we cast the auto-regressive GP learning as a particular type of semi-described learning where future input instances are wholly missing. To achieve our goals we need two methodological tools. Firstly, we need a framework allowing us to consider and communicate uncertainty between the inputs and the outputs of a generative model. For this, we build on the variational approach of Titsias and Lawrence [2010]; Damianou et al. [2015] which was presented as part of the pre1
In this chapter we consider both, observed and latent inputs. Therefore, we reserve X to denote the latent (or partially observed) inputs and Z to denote the fully observed ones.
4.1 Background
87
vious chapter. The resulting representation is particularly advantageous, because the whole input domain is now coherently associated with posterior distributions. We can then sample from the input space in a principled manner so as to populate small initial labelled sets in semi-supervised learning scenarios. In that way, we avoid heuristic self-training methods [Rosenberg et al., 2005] that rely on boot-strapping and present problems due to over-confidence. Previously suggested approaches for modelling input uncertainty in GPs also lack the feature of considering an explicit input distribution for both training and test instances. Specifically, [Girard et al., 2003; QuiñoneroCandela et al., 2003] consider the case of input uncertainty only at test time. Propagating the test input uncertainty through a non-linear GP results in a non-Gaussian predictive density, but Girard et al. [2003]; Quiñonero-Candela et al. [2003] rely on moment matching to obtain the predictive mean and covariance. On the other hand, [Oakley and O’Hagan, 2002] do not derive analytic expressions but, rather, develop a scheme based on simulations. And, finally, McHutchon and Rasmussen [2011] rely on local approximations inside the latent mapping function, rather than modelling the approximate posterior densities directly. Another advantage of our framework is that it allows us to consider different levels of input uncertainty per point and per dimension without, in principle, increasing the danger of under/overfitting, since input uncertainty is modelled through a set of variational rather than model parameters. This is in contrast to approaches suggested in the related field of heteroscedastic GP regression [Goldberg et al., 1998; Kersting et al., 2007; Lázaro-Gredilla and Titsias, 2011]. In this domain, any input noise is referred to the output, and the output noise is then modelled as a random variable or a stochastic process. The second methodological tool needed to achieve our goals, has to do with the need to incorporate partial or uncertain observations into the variational framework. For this, we develop a variational constraint mechanism which constrains the distribution of the input space given the observed noisy values. This approach is fast, and the whole framework can be incorporated into a parallel inference algorithm [Gal et al., 2014; Dai et al., 2014]. In contrast, Damianou et al. [2011, 2015] consider a separate process for modelling the input variance. However, that approach cannot easily be extended for the data imputation purposes that concern us, since we cannot consider different uncertainty levels per input and per dimension and, additionally, computation scales cubicly with the number of datapoints, even within sparse GP frameworks. The constraints framework that we propose is interesting not only as an inference tool but also as a modelling approach: if the inputs are constrained with the outputs, then we obtain the Bayesian version of the back-constraints framework of Lawrence and Quiñonero Candela [2006]; Ek et al. [2008a]. However, in contrast to
88
Uncertain Inputs in Variational Gaussian Processes
these approaches, the constraint defined here is a variational one, and operates upon a distribution, rather than single points. Our contributions in this chapter are the following; firstly, by building on the variational GP-LVM and developing a simple variational constraint mechanism we demonstrate how uncertain GP inputs can be explicitly represented as distributions during both training and test time. Secondly, our framework is automatically turned into a non-parametric variational autoencoder [Kingma and Welling, 2013] when the constraint becomes a back-constraint [Lawrence and Quiñonero Candela, 2006], although we study this case separately in Section 6.2.5 in the context of deep models. Our third contribution has to do with coupling our variational methodology with algorithms that allow us to solve problems associated with partial or uncertain observations: semi-supervised learning, auto-regressive iterative forecasting and, finally, a newly studied type of learning which we call semi-described learning. We show how these applications can be cast as learning pipelines which rely on correct propagation of uncertainty between each stage.
4.2
Uncertain Inputs Reformulation of GP Models
To account for input uncertainty, we start with the usual generative GP model, shown in equation (2.3), and additionally incorporate input noise: yi,j = fj (xi,: ) + (ϵf )i,j ,
(ϵf )i,j ∼ N 0, β −1
�
(ϵx )i,: ∼ N (0, Σx ) ,
xi,: = zi,: + (ϵx )i,: ,
where the vectors {zi,: }ni=1 denote the observed (noise corrupted) inputs and are collected in a matrix Z ∈ ℜn×q whereas {xi,: }ni=1 denote latent variables. There are two ways in which uncertain inputs can be taken into account within the variational GPLVM framework. Firstly, we may directly assume a prior distribution for the latent inputs that depend on noisy observations: p(X|Z) =
n Y
N (xi,: |zi,: , Σx ) .
i=1
This prior can be incorporated in the variational GP-LVM by replacing the spherical prior appearing in the KL term of equation (3.26). The variational bound now becomes F ≤ log p(Y|Z), with: F = ⟨log p(Y|X)⟩q(X) − KL (q(X) ∥ p(X|Z)) ,
(4.1)
89
4.2 Uncertain Inputs Reformulation of GP Models
X
f Z
Y (a)
X
X
f Z
Y (b)
X
f Z
Y (c)
Fig. 4.1: Incorporating observed noisy inputs Z in GPs through an intermediate uncertain input space X by considering: (a) an additional GP prior on X, centered on Z and (b) a (back)-constraint (dashed line) on the approximation to p(X|Y, Z). For our semi-described learning algorithm (Section 4.3.1) we used the second approach. Figure (c) represents the two-stage approach to semi-supervised learning for classification (Section 4.3.3), where the dotted line represents a discriminative mapping. Further, in figure (c), Y,X and Z are all associated with distributions and shaded nodes represent variables for which we also have observed instantiations.
where the new KL term is again tractable. This formulation corresponds to the graphical model of Figure 4.1(a). However, with the above approach one needs to additionally estimate the noise parameters Σx , something which poses two optimisation-related problems; firstly, this introduces several additional parameters, especially if Σx is a non-diagonal covariance matrix. Secondly, there is an interplay between the noise parameters Σx of the prior and the variational noise parameters {Si }ni=1 of the approximate posterior q(X). Therefore, in our implementation we considered an alternative solution which, in initial ad-hoc experiments, resulted in a better performance. This is explained in the next section.
4.2.1
Variational (Back)-Constraint
In contrast to incorporating uncertain inputs through latent space priors, we followed an alternative approach. Specifically, we introduce a variational constraint to encode the input uncertainty directly in the approximate posterior, which is now written as q(X|Z) to highlight its dependence on Z. Similarly to [Lawrence and Quiñonero Candela, 2006; Ek et al., 2008a], this constraint does not constitute a probabilistic mapping and might not be optimal in terms of the resulting approximation to the posterior. However, it allows us to encode the input noise directly in the approximate posterior without having to specify additional noise parameters or sacrifice scalability. In the typical scenario of GP regression with uncertain inputs, the variational conQ straint approach results in the approximation q(X|Z) = ni=1 N (xi,: |zi,: , Si ) for the
90
Uncertain Inputs in Variational Gaussian Processes
posterior. The parameters of the diagonal covariance matrices Si can then be optimised, unless the input noise level is known. In the general case, namely having inputs that are only partially observed, we can define a similar constraint which specifies a variational distribution as a mix of Gaussian and Dirac delta distributions. Notationally we consider data to be split into fully and partially observed subsets, e.g. Z = (ZO , ZU ), where O and U denote fully and partially observed sets respectively. The features missing in ZU can appear in different dimension(s) for each individual point zUi,: , but for notational clarity U will index rows containing at least one missing dimension. In this case, the variational distribution is constrained to have the form q(X|Z, {O, U }) = q(XO |ZO ) q(XU |ZU ) Y Y = δ(zi,: − xi,: ) N (xi,: |µi,: , Si ) , i∈O
(4.2)
i∈U
where δ(·) denotes the Dirac delta function. The delta functions are a means of removing variational parameters for the parts where we are certain about, since these parameters do not provide any information about the noise in the mapping from Z. Given the above, as well as a spherical Gaussian prior for p(X), the required intractable density log p(Y|Z) is approximated with a variational lower bound: F = ⟨log p(Y|X)⟩q(X|Z) − KL (q(X|Z) ∥ p(X)) , where for clarity we dropped the dependency on {O, U } from our expressions. The δ functions appearing inside the variational distribution of equation (4.2) can be approx� imated with sharply peaked Gaussians of the form N xOi,: |zOi,: , εI , with ε → 0. With this selection for q(X|Z), the variational bound of equation (4.1) can be computed in exactly the same manner as the variational GP-LVM bound of equation (3.26). Notice that a vector zUi,: can also be only partially unobserved. In this case, the U elements µi,j (of eq. (4.2)) corresponding to observed dimensions zi,j are no longer free parameters but, instead, are set to match the corresponding observed elements U zi,j . Similarly, the corresponding diagonal elements (Si )j,j are set to ε → 0. The rest of the parameters of q(XU |ZU ) are subject to optimisation. For the rest of this chapter, the variational constraint is only used in the form q(X|Z), that is, for constraining the variational distribution with the inputs Z. However, the formulation is generic and allows for constraining the input distribution with any available observation from (Z, Y). Therefore, if instead, we constrain the variational distribution with the outputs Y by defining q(X|Y), then we obtain a form of variational auto-encoder [Kingma and Welling, 2013] or, equivalently, a
4.3 Gaussian Process Learning with Missing Values
91
Bayesian version of the back-constrained framework of Lawrence and Quiñonero Candela [2006]; Ek et al. [2008a]. We explore this idea in Section 6.2.5 in the context of deep Gaussian processes. Therefore, for the moment we don’t consider it further.
4.3
Gaussian Process Learning with Missing Values
In semi-supervised learning we are provided with a portion of the data that is labelled and a (normally much larger) portion that is unlabelled. The aim is to incorporate the unlabelled data in making predictions. In this section we generalise the idea of learning with missing values to consider the case where the inputs may also be only partially observed. We refer to this type of learning as semi-described learning. We formulate both, the semi-described and semi-supervised learning as particular instances of learning a mapping function where the inputs are associated with uncertainty. Our approach for semi-described and semi-supervised learning is depicted in figures 4.1b and 4.1c respectively, which make clear that in both cases a GP with uncertain inputs is employed. Specifically, in the first case, input uncertainty is naturally occurring due to the missing input values that have to be imputed probabilistically. In the second case, input uncertainty is occurring due to viewing the semi-supervised problem as a particular data imputation problem which is solved in two steps using an intermediate latent space. This space is assumed to be the generating manifold for the labelled and unlabelled data, and is associated with uncertainty. Concerning algorithms, in both semi-described and semi-supervised learning, we devise a two-step strategy, based on our uncertain input GP framework, which allows to efficiently take into account the partial information in the given datasets to improve the predictive performance. Regarding notation and conventions in semi-described learning, we assume a set of observed outputs Y that correspond to fully observed inputs ZO and partially observed inputs ZU , so that Z = (ZO , ZU ). To make the correspondence clearer, we also split the observed outputs according to the sets {O, U }, so that Y = (YO , YU ), but notice that both sets of outputs are fully observed. We are then interested in learning a regression function from Z to Y by using all available information. Regarding notation and conventions in semi-supervised learning, we assume a fully observed set of inputs, Z, and a partially observed set of outputs. This scenario is typically encountered in classification settings, which is also the task of interest in this section. Therefore, the outputs constitute the set of labels corresponding to the inputs. Since we are interested in multi-label problems, each output row is encoded in 1-of-K encoding, so that yi,: is a p−dimensional vector. In contrast to the semi-
92
Uncertain Inputs in Variational Gaussian Processes
described learning case, here we assume that a row of Y is either fully observed or fully unobserved. This assumption is made only for simplicity, and our model can also handle the general case. Therefore, we introduce two sets that index the labelled and missing (unlabelled) rows of Y, denoted by L and M respectively. Accordingly, the dataset is split so that Z = (ZL , ZM ) and Y = (YL , YM ). The task is then to devise a method that improves classification performance by using both labelled and unlabelled data. In the rest of this section we describe in more detail our approach for semidescribed learning with GPs in Section 4.3.1, we show how auto-regressive GPs are cast as a particular semi-described learning problem in Section 4.3.2 and, finally, discuss our approach to solve the more “traditional” semi-supervised learning problem in Section 4.3.3.
4.3.1
Semi-described Learning
A standard GP regression model cannot deal with partially observed inputs. In contrast, in the (back)-constrained formulation presented in Section 4.2 we model the joint distribution between Z and Y, obviating this issue. Specifically, since in our formulation the inputs are replaced by distributions q(XO |ZO ) and q(XU |ZU ), the uncertainty over ZU can be taken into account naturally through this variational distribution. In this context, we formulate a data imputation-based approach which is inspired by self-training methods; nevertheless, it is more principled in the handling of uncertainty. Specifically, the algorithm has two stages: Step 1 - Train on the fully observed data (ZO , YO ) and then impute (initial) values for the missing elements of ZU : We use the fully observed data subset (ZO , YO ) to train an initial variational GP-LVM model which encapsulates the sharply peaked variational distribution q(XO |ZO ) given in equation (4.2). Given this model, we can then use YU to estimate the predictive posterior q(XU |ZU ) in the missing locations of ZU (for the observed locations we match the mean with the observations in a sharply peaked marginal, as for ZO ). Essentially, we replace the missing locations of the variational means µUi,: and variances SUi of q(XU |ZU ) with the predictive mean and variance obtained through the self-training step. This selection for {µUi,: , SUi } can be seen as an initialisation step. In the next step, these parameters are further optimised together with the fully observed data. Step 2 - Train on the full set ((ZO , ZU ), (YO , YU )) by propagating the un-
4.3 Gaussian Process Learning with Missing Values
93
Algorithm 1 Semi-described learning with uncertain input GPs. 1: Given: Fully observed inputs ZO and partially observed inputs ZU , corresponding respectively to fully observed outputs YO and YU . � Qn O 2: Construct q(XO |ZO ) = i=1 N xO i,: |zi,: , εI , where: ε → 0 3:
Fix q(XO |ZO ) in the optimiser
4:
Train a variational GP-LVM model MO with inputs q(XO |ZO ) and outputs YO
5:
for i = 1, · · · , |YU | do � � ˆ U ≈ p(xU |yU , MO ) from the approxiˆ Ui,: , S Predict the distribution N xUi,: |µ i i,: i,: mate posterior of model MO (see Section 3.4.1) � Initialise parameters {µUi,: , SUi } of q(xUi,: |zUi,: ) = N xUi,: |µUi,: , SUi as follows: for j = 1, · · · , q do U if zi,j is observed then U U and (SUi )j,j = ε, where: ε → 0 µi,j = zi,j U Fix µi,j , (SUi )j,j in the optimiser # (i.e. they don’t constitute parameters) else ˆ U )j,j ˆUi,j and (SUi )j,j = (S µUi,j = µ i
6:
7: 8: 9: 10: 11: 12: 13:
# (i.e. q(XO |ZO ) has no free parameters)
14:
Train a variational GP-LVM model MO,U with inputs q(X{O,U } |Z{O,U } ) and outputs (YO , YU ). The input distribution q(X{O,U } |Z{O,U } ) = q(XO |ZO )q(XU |ZU ) is constructed in steps 2, 5-13 and further optimised in the non-fixed locations.
15:
Model MO,U now constitutes the semi-described GP and can be used for all required prediction tasks. certainty of the imputed elements of ZU (from step 1) as input uncertainty: After initializing q(X|Z) = q(XO , XU |Z) as explained in step 1, we proceed to train a variational GP-LVM model on the full (extended) training set ((ZO , ZU ) , (YO , YU )), which contains fully and partially observed inputs.
Algorithm 1 outlines the approach in more detail. This formulation defines a semidescribed GP model which naturally incorporates fully and partially observed examples by communicating the uncertainty throughout the relevant parts of the model in a principled way. Indeed, the predictive uncertainty obtained when imputing missing values in the first step of the pipeline, is incorporated as input uncertainty in the second step of the pipeline. In extreme cases resulting in very non-confident predictions, for example presence of outliers, the corresponding locations will simply be ignored automatically due to the large uncertainty. This mechanism, together with the subsequent optimisation of the parameters of q(XU |ZU ) in stage 2, guards against reinforcing bad predictions when imputing missing values based on a smaller training set. The model includes GP regression and the GP-LVM as special cases. In particular, in the limit of having no observed values our semi-described GP is equivalent to
94
Uncertain Inputs in Variational Gaussian Processes 0.5
Toy data
0.3
Motion capture data
0.45
0.25
MSE
MSE
0.4 0.2 0.15
0.3
0.1 0.05 0
0.35
0.25 % missing features 20
40
60
0.2 0
80 SD−GP
GP
NN
% missing features 20
40
60
80
GPLVM
Fig. 4.2: MSE for predictions obtained by different methods on semi-described learning. GP cannot handle partial observations, thus the uncertainty (2σ) is constant; for clarity, the errorbar is plotted separately on the right of the dashed vertical line (for nonsensical x values). The results for simulated data are obtained from 4 trials. For clarity, the limits on the y−axis are fixed, so when the errors become too big for certain methods they get off the chart. The errorbars for the GPLVM-based approach are also too large and not plotted. The full picture is given in figure 4.3.
the GP-LVM and when there are no missing values it is equivalent to GP regression. There are some similarities to traditional self-training [Rosenberg et al., 2005], but as there are no straightforward mechanisms to propagate uncertainty in that domain, they typically rely on boot-strapping followed by thresholding “bad” samples, to prevent model over-confidence. In our framework, the predictions made by the initial model only constitute initialisations which are later optimised along with model parameters and, hence, we refer to this step as partial self-training. Further, the predictive uncertainty is not used as a hard measure of discarding unconfident predictions; instead, we allow all values to contribute according to an optimised uncertainty measure, that is, the input variances Si . Therefore, the way in which uncertainty is handled makes the self-training part of our algorithm principled compared to many bootstrap-based approaches.
Demonstration We considered simulated and real-world data to demonstrate our semi-described GP algorithm. The simulated data were created by sampling inputs Z from a GP (which was unknown to the competing models) and then giving these samples as input to another unknown GP, to obtain corresponding outputs Y. For the real-world data demonstration we considered a motion capture dataset taken from subject 35 in the CMU motion capture database. We selected a subset of walk and run motions of a
95
4.3 Gaussian Process Learning with Missing Values Motion capture data
1
MSE
1.2
MSE
Toy data
1 0.8 0.8 0.6 0.6
0.4
0.4
0.2
0 0
20
40 60 % missing features SD−GP
0.2 0
80 GP
MLR
20 NN
GPLVM
40 60 % missing features
80
Mean
Fig. 4.3: MSE for predictions obtained by different methods on semi-described learning (full version of figure 4.2). Comparing our method (SD-GP), the standard GP method, multiple linear regression (MLR), nearest neighbour regression on the input space (NN), the dataimputation method based on GP-LVM and the mean predictor (mean). The results for simulated data are obtained from 4 trials. The GP method cannot handle partial observations, thus the uncertainty (2σ) is constant; for clarity, the errorbar is plotted separately on the right of the dashed vertical line (for nonsensical x values). The GP-LVM method produced huge errorbars (about 3.5 times larger than thos of MLR), thus we don’t plot them here, for clarity.
human body represented as a set of 59 joint locations. We formulated a regression problem where the first 20 dimensions of the original data are used as targets and the remaining 39 as inputs. That is, given a partial joint representation of the human body, the task is to infer the rest of the representation. For both datasets, simulated and motion capture, we selected a portion of the training inputs, denoted as ZU , to have randomly missing features. The extended dataset ((ZO , ZU ) , (YO , YU )) was used to train: a) our method, referred to as semi-described GP (SD-GP) b) multiple linear regression (MLR) c) regression by performing nearest neighbour (NN) search between the test and training instances, in the observed input locations d) performing data imputation using the standard GP-LVM. Not taking into account the predictive uncertainty during imputation was found to have catastrophic results in the simulated data, as the training set was not robust against bad predictions. Therefore, the “GPLVM” variant was not considered in the real data experiment. We also considered: e) a standard GP which cannot handle missing inputs straightforwardly and so was trained only on the observed data (ZO , YO ). The goal was to reconstruct test outputs Y∗ given fully observed test inputs Z∗ . For the simulated data we used the following sizes: |ZO | = 40, |ZU | = 60 and |Z∗ | = 100. The dimensionality of the inputs is q = 15 and of the outputs is p = 5. For the motion capture data we used |ZO | = 50,
96
Uncertain Inputs in Variational Gaussian Processes
|ZU | = 80 and |Z∗ | = 200. In fig. 4.2 we plot the MSE obtained by the competing methods for a varying percentage of missing features in ZU . For the simulated data experiment, each of the points in the plot is an average of 4 runs which considered different random seeds. For clarity, the y−axis limit is fixed in figure 4.2, because some methods produced huge errors. The full picture is in figure 4.3. As can be seen in the figures, the semi-described GP is able to handle the extra data and make much better predictions, even if a very large portion is missing. Indeed, its performance starts to converge to that of a standard GP when there are 90% missing values in ZU and performs identically to the standard GP when 100% of the values are missing. Therefore, the semi-described GP is very efficient in taking into account the extra, partially observed input set ZU . On the other hand, nearest neighbour runs into difficulties when real data are considered and, even worse, produces huge errors when more than 60% of the features are missing in ZU . Finally, the baseline which uses the standard GP-LVM as a means of imputing missing values produces bad results, in fact worse compared to if the extra set ZU is just ignored (i.e. the GP baseline). This is because the baseline using GP-LVM treats the input space as single point estimates; by not incorporating (and optimising jointly) the uncertainty for each input location, the model has no way of ignoring “bad” imputed values.
4.3.2
Auto-regressive Gaussian Processes
Gaussian processes have been studied as expressive priors for state-space models [Turner, 2010; Turner and Sahani, 2011; Deisenroth et al., 2012]. Having a method which implicitly models the uncertainty in the inputs of a GP also enables performing predictions in an autoregressive manner [Oakley and O’Hagan, 2002] while propagating the uncertainty through the predictive sequence [Girard et al., 2003; QuiñoneroCandela et al., 2003]. Specifically, assuming that the given data Y constitute a multivariate timeseries where the observed time vector t is equally spaced, we can reformat ˆ and Y. ˆ For example, if we have an the data Y into input-output collections of pairs Z auto-regressive time window of length τ , then to modify the model for autoregressive use the first input to the model, zˆ1,: , will be given by the stacked vector [y1,: , ..., yτ,: ] ˆ ˆ 1,: , will be given by yτ +1,: and similarly for the other data in Z and the first output, y
4.3 Gaussian Process Learning with Missing Values
97
ˆ so that: and Y, � [ˆz1,: , zˆ2,: , ..., zˆn−τ,: ] = [y1,: , y2,: , ..., yτ,: ] , [y2,: , y3,: , ..., yτ +1,: ] , � ..., [yn−τ,: , yn−τ +1,: , ..., yn−1,: ] , ˆ 2,: , ..., y ˆ n−τ,: ] = [yτ +1,: , yτ +2,: , ..., yn,: ]. [ˆ y1,: , y ˆ Y). ˆ To perform extrapolation we first train the model on the modified dataset (Z, By referring to the semi-described formulation described in the beginning of Section 4.3, we assign all training inputs to the observed set O. After training, we can perform ˆ ∗ := [yn+1,: , yn+2,: , ...] iterative k-step ahead prediction to find a future sequence Z where, similarly to the approach taken by Girard et al. [2003], the predictive variance in each step is accounted for and propagated in the subsequent predictions. For example, if k = 1 the algorithm will make iterative 1-step predictions in the future; initially, the output zˆ1,∗ := yn+1,: will be predicted (given the training set) with predictive variˆ ∗;1 . In the next step, the input set will be augmented to include our distribution ance S � � ˆ ∗;1 , and so of predictions over yn+1,: , by defining q(xn+1,: |ˆz1,∗ ) = N xn+1,: |ˆz∗,1 , S on. This simulation process can be seen as constructing a predictive sequence step by step, i.e. the newly inserted input points constitute parts of the (test) predictive sequence and not training points. Therefore, this procedure can be seen as an iterative version of semi-described learning. Note that it is straightforward to extend this model by applying this auto-regressive mechanism in a latent space of a stacked model constructed as shown in Section 3.2.1 or, more generally, as a deep GP (which will be discussed in Chapter 6). By additionally introducing functions that map from this latent space nonlinearly to an observation space, we obtain a fully nonlinear state space model in the manner of Deisenroth et al. [2012]. For our model, uncertainty is encoded in both the states and the nonlinear transition functions. Correct propagation of uncertainty is vital in well calibrated models of future system behavior and automatic determination of the structure of the model (for example the size of the window) can be informative in describing the order of the underlying dynamical system.
Demonstration: Iterative k−step Ahead Forecasting Here we demonstrate our framework in the simulation of a state space model. We consider the Mackey-Glass chaotic time series, a standard benchmark which was also considered by Girard et al. [2003]. The data is one-dimensional so that the timeseries
98
Uncertain Inputs in Variational Gaussian Processes
1 0 −1 −2 1 0 −1 −2 1 0 −1 −2 0.1 0.05 0
100
200
300
400
500
600
700
800
900
1000
1100
Fig. 4.4: Chaotic timeseries: forecasting 1110 steps ahead by iterative prediction. The top 3 plots show the values obtained in each predictive step for each of the compared methods; the plot on the bottom shows the corresponding predictive uncertainties (2σ). GPuncert refers to the basic (moment matching) method of Girard et al. [2003] and the GP is the “naive” autoregressive GP which does not propagate uncertainties.
can be represented as pairs of values {y, t}, t = 1, 2, · · · , n and simulates the process: dζ(t) ζ(t−T ) , (α, b, T ) = (0.2, 0.1, 17). = −bζ(t) + α 1+ζ(t−T )10 dt Obviously the generating process is very non-linear, rendering this dataset challenging. We trained the autoregressive model on data from this series, where the ˆ } was created with τ = 18 and we used the first 4τ = 72 points modified dataset {ˆz, y to train the model and predicted the subsequent 1110 points through iterative free simulation. We compared our method with a “naive autoregressive” GP model where the ˆ }. input-output pairs were given by the autoregressive modification of the dataset {ˆz, y
99
4.3 Gaussian Process Learning with Missing Values
For that model, the predictions are made iteratively and the predicted values after each predictive step are added to the “observation” set. However, this standard GP model has no straight forward way of incorporating/propagating the uncertainty and, therefore, the input uncertainty is zero for every step of the iterative predictions. We also compared against the method of Girard et al. [2003]2 , denoted in the plots as “GPuncert ”. Figure 4.4 shows the results of the full free simulation (1110−step ahead forecasting). As can be seen in the variances plot, both our method and GPuncert are more robust in handling the uncertainty throughout the predictions; the “naive” GP method underestimates the uncertainty. Consequently, as can be seen in figure 4.4, in the first few predictions all methods give the same answer. However, once the predictions of the “naive” method diverge a little by the true values, the error is carried on and amplified due to underestimating the uncertainty. On the other hand, GPuncert perhaps overestimates the uncertainty and, therefore, is more conservative in its predictions, resulting in higher errors. Quantification of the error is shown in Table 4.1. Table 4.1: Mean squared and mean absolute error obtained when extrapolating in the chaotic time-series data. GPuncert refers to the basic (moment matching) method of Girard et al. [2003] and the “naive” autoregressive GP approach is the one which does not propagate uncertainties.
Method ours GPuncert “naive” GP approach
4.3.3
MAE 0.529 0.700 0.799
MSE 0.550 0.914 1.157
Semi-supervised Learning
In this section we consider the semi-supervised learning setting where a set of fully observed inputs Z = (ZL , ZM ) corresponds to a set of fully observed and a set of fully unobserved labels, YL and YM respectively. Previous work in this area involved the cluster assumption [Lawrence and Jordan, 2005] for semi-supervised GP classification. Our approach makes use of the manifold assumption [Chapelle et al., 2006] which assumes that the high dimensional data are really generated by a lower dimensional latent space. Inspired by Kingma et al. [2014] we define a semi-supervised GP framework where features are extracted from all available information and, sub2
We implemented the basic moment matching approach, although in the original paper the authors use additional approximations, namely Taylor expansion around the predictive moments.
100
Uncertain Inputs in Variational Gaussian Processes
Digits data
Oil data 120
100
Semi−supervised (using sampling)
Semi−supervised (using sampling)
Bayesian GP−LVM 90
PCA 100
PCA
80
# Errors
# Errors
80
70 60 50
60
40
40 20
30 100
200
300
400
# Observed
500
600
20
40
60
80
100
120
140
160
# Observed
Fig. 4.5: Plots of the number of incorrectly classified test points as a function of |ZL |. Multiple trials were performed, but the resulting errorbars are shown at one standard deviation. In small training sets large errorbars are expected because, occasionally, very challenging instances/outliers can be included and result in high error rates (for all methods) that affect the overall standard deviation. The Bayesian GP-LVM baseline struggled with small training sets and performed very badly in the oil dataset; thus, it is not plotted for clarity.
sequently, are given as inputs to a discriminative classifier. Specifically, using the whole input space Z, we learn a low-dimensional latent space X through an approximate posterior q(X) ≈ p(X|Z). Obviously, this specific case where the input space is uncertain but totally unobserved (i.e. a latent space) just reduces to the variational GP-LVM model. Notice that the posterior q(X) is no longer constrained with Z but, rather, directly approximates p(X|Z), since we now have a forward probabilistic mapping from X to Z and Z is treated as a random variable with p(Z|X) being a Gaussian distribution, i.e. exactly the same setting used in the GP-LVM. This procedure corresponds to the left part of the graphical model depicted in Figure 4.1c. Since there is one-to-one correspondence between X, Z and Y, we can notationally write X = (XL , XM ). Further, since we assume that q(X) is factorised across datapoints, we can write q(X) = q(XL )q(XM ). In the second step of our semi-supervised algorithm, we train a discriminative classifier from q(XL ) to the observed labelled space, YL . The main idea is that, by including the inputs ZM in the first learning step, we manage to define a better latent embedding from which we can extract a more useful set of features for the discriminative classifier. Notice that what we would ideally use as input to the discriminative
4.3 Gaussian Process Learning with Missing Values
101
classifier is a whole distribution, rather than single point estimates. Therefore, we wish to take advantage of the associated uncertainty; in specific, we can populate the labelled set by sampling from the distribution q(XL ). For example, if a latent point L ), then a sample from q(xLi,: ) will be xLi,: corresponds to the input-output pair (zLi,: , yi,: L . assigned the label yi,: The two inference steps described above are graphically depicted in Figure 4.1c. This is exactly the same setting suggested by Kingma et al. [2014], but here we wish to investigate its applicability in a non-parametric, Gaussian process based framework. The very encouraging results reported below point towards the future direction of applying this technique in the framework of deep Gaussian processes and deep Gaussian process autoencoders, so as to be able to compare to [Kingma et al., 2014] who considered deep, generative (but nevertheless parametric) models.
Demonstration To evaluate our method we considered two datasets: firstly, we considered 2,000 examples from the USPS handwritten digit database [Hull, 1994]. These examples contained the digits {0, 2, 4, 6} and were split so that 800 instances were used as a test set. From the remaining 1,200 instances, we selected various portions to be labelled and the rest to be unlabelled. The experiment was repeated 8 times (each time involving different subsets due to different random seeds), so that we can include errorbars in our plots. Secondly, we considered the oil flow data [Bishop and James, 1993] that consist of 1,000, 12 dimensional observations belonging to three known classes corresponding to different phases of oil flow. In each of the 10 performed trials, 700 instances were used as a test set whereas the rest were split to different proportions of labelled/unlabelled sets. Our method learned a low-dimensional embedding q(X) from all available inputs, and a logistic regression classifier was then trained from the relevant parts of the embedding to the corresponding class space. We experimented with taking different numbers of samples from q(XL ) to use for the classifier; the difference after increasing over 6 samples was minimal. Also, when using only the mean of q(XL ) (as opposed to using multiple samples) we obtained worse results (especially in the digits data), but this method still outperformed the baselines. We compared with training the classifier on features learned by (a) a standard variational GP-LVM and (b) PCA, both applied in ZL . Both of the baselines do not take ZM into account, nor do they populate small training sets using sampling. Figure 4.5 presents results suggesting that our approach manages to effectively take into account unlabelled data. The gain
102
Uncertain Inputs in Variational Gaussian Processes
in performance is significant, and our method copes very well even when labelled data is extremely scarce. Notice that all methods would perform better if a more robust classifier was used, but logistic regression was a convenient choice for performing multiple trials fast. Therefore, our conclusions can be safely drawn from the obtained relative errors, since all methods were compared on equal footing.
4.4
Discussion and Future Work
This chapter defined semi-described learning as the scenario where missing values occur in the inputs. The approach taken is to consider semi-described problems to be part of a general class of missing value problems that also includes semi-supervised learning and auto-regressive future state simulation. A principled method for including input uncertainty in Gaussian process models was also introduced in this chapter. This uncertainty is explicitly representedas approximate posterior distributions which are variationally constrained. This allowed us to further define algorithms for casting the missing value problems as particular instances of learning pipelines which use our uncertain input formulation as building block. Our algorithms resulted in significant performance improvement in forecasting, regression and classification. We believe that our contribution paves the way for considering the application of our uncertainty propagation algorithms in deep models (discussed in Chapter 6) which use relevance determination techniques (discussed in Chapter 5) to automatically consolidate features (e.g. raw pixels and SIFT) in a hierarchical manner. We plan to investigate the application of these models in settings where control [Deisenroth et al., 2014] or robotic systems learn by simulating future states in an auto-regressive manner and by using incomplete data with minimal human intervention. Finally, we see promise in using the back-constrained model resulting from our framework (see end of Section 4.2.1) as a non-parametric variational auto-encoder [Kingma and Welling, 2013]; this is further investigated in Section 6.2.5.
Chapter 5 Manifold Relevance Determination Until now we have assumed that observed data come in a single view, also referred to as “modality” or “information source”. It is often the case, however, that data contain observations from several different and possibly diverse modalities: for example depth cameras provide colour and depth images from the same scene, or a meeting might be represented by both an audio and a video feed. Extracting knowledge from many different sources constitutes the focus of the multi-view learning domain. Xu et al. [2013] identifies three main lines of work within multi-view learning: cotraining, multiple kernel learning and subspace learning. In this thesis we are concerned with multi-view subspace learning which assumes that a possibly segmented latent space is responsible for generating the views. In particular, the presence of multiple modalities motivates latent variable models which align the different views by assuming that a portion of the data variance is shared between the modalities, whilst explaining the remaining variance with latent spaces that are private to each modality. This model structure allows inference when only a subset of the modalities is available and, because the observation spaces have been aligned, it is possible to transfer information between modalities by conditioning the model through the underlying concept. This chapter presents such an approach; in specific, a single latent space is “softly” segmented (i.e. separated or clustered) to represent shared and private information from multiple views of the data. By incorporating this approach in the variational Bayesian framework described in the previous chapter, we allow for the dimensionality and segmentation of the latent space to be found automatically from the data using automatic relevance determination covariance functions.
104
5.1
Manifold Relevance Determination
Background
One line of work related to multi-view learning aims to find a low-dimensional representation of the observations by seeking a transformation of each view. Different approaches exploit different characteristics of the data such as, correlation [Kuss and Graepel, 2003; Ham et al., 2005], or mutual information [Memisevic et al., 2011]. However, these methods only aim to encode the shared variance and do not provide a probabilistic model. To address these shortcomings different generative models have been suggested. In particular, approaches formulated as Gaussian Processes Latent Variable Models (GP-LVMs) have been especially successful [Shon et al., 2006; Ek et al., 2008b]. However, these models assume that a single latent variable is capable of representing each modality, implying that the modalities can be fully aligned. To overcome this, the idea of a segmented latent space was presented in [Ek et al., 2008a] where each view is associated with an additional private space, representing the variance which cannot be aligned, in addition to the shared space [Ek, 2009], an idea independently suggested by Klami and Kaski [2006]. The main challenge for the applicability of the proposed models is that the segmentation of the latent variable is a structural and essentially discrete property of the model, making it very challenging to learn. Salzmann et al. [2010] introduced a set of regularisers allowing the dimensionality of the segmentation to be learned. However, the regularisers were motivated out of necessity rather than principle and introduced several additional parameters to the model. This chapter presents a new principled approach to learning a segmented (clustered) latent variable representation of multiple observation spaces. We introduce a relaxation of the structural segmentation of the model from the original hard discrete representation, where each latent variable is either associated with a private space or a shared space, to a smooth continuous representation, where a latent variable may be more important to the shared space than the private space. In contrast to previous approaches the model is fully Bayesian, allowing estimation of both the dimensionality and the structure of the latent representation to be done automatically. This Bayesian framework is enabled by exploiting the variational approximations developed in the previous chapter. By learning data set commonalities in a principled way, the resulting approach can be used as a powerful predictive model for regression and classification (where one of the views is the class labels). Our approach can also be seen as a data exploration / feature representation method, with application to dimensionality reduction, feature consolidation and ambiguity modelling. This is illustrated with experiments in simulated and real-world data.
105
5.2 Model
5.2
Model
We wish to relate multiple views of a dataset within the same model. For simplicity and without loss of generality we make the analysis by considering only two views, YA ∈ ℜn×pA and YB ∈ ℜn×pB . We assume the existence of a single laA : X 7→ YA and tent variable X ∈ ℜn×q which, through the mappings {fjA }pj=1 B {fjB }pj=1 : X 7→ YB (q < pA , pB ), gives a low dimensional representation of the data. Our assumption is that the data is generated from a low dimensional manifold and cor� � rupted by additive Gaussian noise ϵA ∼ N 0, (βϵA )−1 I) and ϵB ∼ N 0, (βϵB )−1 I) , yi,j = fdA (xi,: ) + ϵA i,j zi,j = fdB (xi,: ) + ϵB i,j . This leads to the likelihood under the model, p(YA , YB |X, θ), where θ = {θ A , θ B } collectively denotes the parameters of the mapping functions and the noise variances (βϵA )−1 , (βϵB )−1 . In a GP-LVM approach, each generative mapping would be modelled as a product of independent GPs parametrized by a (typically shared) covariance function k AB . However, this approach assumes similar statistical properties in YA and YB , which is rarely the case. Therefore, we opt for separate covariance functions per view, k A and k B . By evaluating them on the latent variable X we obtain the corresponding covariance matrices KA and KB , involved in an expression: A
A
p(F |X, θ ) =
pA Y
N (fjA |0, KA ),
j=1 A A where FA = {fjA }pj=1 with fi,j = fjA (xi,: ), and similarly for FB . Similarly to the single-view GP-LVM version, one can analytically integrate out the mappings to obtain the likelihood: Y Z A B p(Y , Y |X, θ) = p(YV |FV )p(FV |X, θ V )dFV . (5.1) V ={A,B}
A fully Bayesian treatment requires integration over the latent variable X in equation (5.1) which is intractable, as X appears non-linearly in the inverse of the covariance matrices KA and KB of the GP priors for f A and f B . In practice, a maximum a posteriori solution [Shon et al., 2006; Ek et al., 2007; Salzmann et al., 2010] was often used. Instead, here we approximate the Bayesian solution by building on the variational framework described in the previous chapter. The Bayesian framework allows us to tackle the multi-view learning problem through the use of automatic
106
Manifold Relevance Determination
relevance determination (ARD) priors so that each view of the data is allowed to estimate a separate vector of ARD parameters. This allows the views to determine which of the emerging private and shared latent spaces are relevant to them. We refer to this idea as manifold relevance determination (MRD). In MRD, we also get for free the “usual” advantages that accompany Bayesian methods: robustness to overfitting, automatic dimensionality detection for the latent space(s) and estimation of the posterior distribution.
5.2.1
Manifold Relevance Determination
We wish to recover a segmented latent representation such that the variance shared between different observation spaces can be aligned and separated from variance that is specific (private) to the separate views. In manifold relevance determination (MRD) the notion of a hard separation between private and shared spaces is relaxed to a continuous setting. The model is allowed to (and indeed often does) completely allocate a latent dimension to private or shared spaces, but may also choose to endow a shared latent dimension with more or less relevance for a particular data-view. Importantly, this segmentation is learned from data by maximizing a variational lower bound on the model evidence, rather than through construction of bespoke regularisers to achieve the same effect. The model we propose can be seen as a generalisation of the traditional approach to manifold learning; we still assume the existence of a low-dimensional representation encoding the underlying phenomenon, but the variance contained in an observation space is not necessarily governed by the full manifold, as traditionally assumed, nor by a subspace geometrically orthogonal to that, as assumed in [Salzmann et al., 2010]. The expressive power of our model comes from the ability to consider non-linear mappings within a Bayesian framework. Specifically, our pA latent functions fjA are selected to be independent draws of a zero-mean GP with an ARD covariance function. This function was introduced in equation (2.7), and is rewritten here with the view-dependent parameters made explicit: 1
A 2 −2 k A (xi , xj ) = (σard )e
PQ
q=1
wqA (xi,q −xj,q )2
,
and similarly for f B . Accordingly, we can learn a common latent space1 but we allow the two sets of ARD weights wA = {wjA }qj=1 and wB = {wjB }qj=1 to automatically infer the responsibility of each latent dimension for generating points in the YA and 1
More correctly stated, we learn a common distribution of latent points.
107
5.2 Model
X
X
XA
X
XAB
XB
YAB
YA
YB
YA
YB
YA
YB
θ
θA
θB
θA
θB
θA
θB
(a)
(b)
(c)
(d)
Fig. 5.1: Evolution of the structure of GP-LVM model variants. (a) standard GP-LVM, where a single latent variable X is used to represent the observed data Y. Evolved shared models then assume firstly, that all of the variance in the observations was shared [Shon et al., 2006] (Fig. (b)). Secondly, Ek et al. [2008a] introduced private latent spaces to explain variance specific to one of the views through back-constraints (represented as a dashed line) (Fig. (c)). MAP estimates used in this model meant the structure of the latent space could not be automatically determined. Figure (d) shows the model we propose in this chapter. In this model, the kernel parameters θ include the ARD weights w which, thanks to the Bayesian framework, define an automatic factorisation for the latent space (shown as patterned plates).
YB spaces respectively. We can then automatically recover a segmentation of the � latent space X = XA , XAB , XB , where XAB ∈ Rn×qAB is the shared subspace, defined by the set of dimensions j ∈ [1, ..., q] for which wjA , wjB > δ, with δ being a number close to zero and qAB ≤ q. This equips the model with further flexibility, because it allows for a “softly” shared latent space, if the two sets of weights are both greater than δ but dissimilar, in general. As for the two private spaces, XA and XB , they are also being inferred automatically along with their dimensionalities 2 qA and qB . More precisely: A XA = {xj }qj=1 : xj ∈ X, wjA > δ, wjB < δ
and analogously for XB . As in previous chapters, xj denotes columns of X, while we assume that data are stored by rows. All of the above are summarised in the graphical model of figure 5.1.
2
In general, there will also be dimensions of the initial latent space which are considered unnecessary by both sets of weights.
108
5.2.2
Manifold Relevance Determination
Bayesian Training
We assume a general prior p(X) for the latent space. Then, the fully Bayesian training procedure requires maximisation of the logarithm of the joint marginal likelihood R p(YA , YB ) = p(YA , YB |X)p(X)dX. Here, as for the remainder of this chapter, we omit the conditioning on model (hyper)parameters for clarity of notation. This setting is exactly the same as the one described in the previous chapter, but instead of a single observation view we now have many. Therefore, we can easily extend the variational GP-LVM framework for the multi-view case. Indeed, we firstly introduce a variational distribution q(X) which can factorise across data points or across dimensions, exactly as explained in the previous section. Then, we factorise the model likelihood across views to make clear the use of different GP mappings f A and f B : p(YA , YB |X) = p(YA |X)p(YB |X). We then apply Jensen’s inequality on the marginal log likelihood to obtain a variational lower bound: Z p(YA |X)p(YB |X)p(X) A B dX logp(Y , Y ) ≥ q(X) log q(X) Z Z A = q(X) log p(Y |X)dX + q(X) log p(YB |X)dX − KL (q(X) ∥ p(X)) .
In the previous chapter it was explained how the KL term can be computed for different choices of latent space priors, including the nested GP case where the latent space is a set of temporal latent functions. Moreover, it was shown how each of the data-involving terms can be approximated through equation (3.27). Specifically: Z A ˆ F (q(X)) ≤ q(X) log p(YA |X)dX Z B Fˆ (q(X)) ≤ q(X) log p(YB |X)dX.
(5.2)
To obtain the above approximations, we need to augment the probability space with auxiliary variables following the variational GP-LVM framework. Specifically, we introduce m extra samples UA and UB of the latent functions f A and f B evaluated B A at a set of inducing points XA ∈ RmA ×pA , UB ∈ u and Xu respectively. Here, U mA ×q mB ×q RmB ×pB , XA , XB and m = mA + mB . For each view YV , the u ∈ R u ∈ R
109
5.2 Model auxiliary variables are incorporated in the likelihood term V
Z
p(Y |X) =
p(YV |FV )p(FV |UV , X)p(UV )dFV dUV
where the dependency on the inducing inputs was dropped from the expressions. Further, the auxiliary variables augment the variational distribution, which now becomes: Y
q(X, {UV }V ∈{A,B} ) = q(X)
q(ΘV ) = q(X)
V ∈{A,B}
Y
q(UV )p(FV |UV , X).
V ∈{A,B}
We can now obtain the approximations of equation (5.2) by firstly computing a variational lower bound in the augmented space to obtain: � Fˆ V q(X), q(UV ) ≤
Z
q(X)q(ΘV ) log
p(YV |X) dXdUV . V q(Θ )
from where we can then collapse q(UV ) to obtain an analytic expression for equation (5.2). These expressions have exactly the same form as in equation (3.25) where YA is now replaced with the view index YV .
5.2.3
Generalisation to Many Views and Optimization
After laying the foundation for specifying and performing tractable inference in MRD, we now generalise the notation to incorporate multiple views. We denote the total set of view indexes by V, and notationally denote all instantiations belonging to the |V| different views as YV ≜ {YV }V ∈V . Then, the joint distribution factorises as: p(YV , X) = p(X)
Y
p(YV |X)
V ∈V
and the variational lower bound becomes: p(YV ) ≥
X
Fˆ V (q(X)) − KL (q(X) ∥ p(X)) .
(5.3)
V ∈V
This function is jointly maximised with respect to the model parameters, including the weights {wV }V ∈V , as well as the variational parameters {µi,: , Si,: }ni=1 and {XVu }V ∈V , where we assumed the simplest case where q(X) is a standard normal distribution. As can be seen, MRD scales computationally similarly to the variational GP-LVM presented in the previous chapter, with an extra linear factor depending on the number of views. The Bayesian optimisation gives, as a by-product, an approxi-
110
Manifold Relevance Determination
mation of p(X|YV ) by q(X), i.e. we obtain a distribution over the latent space. Notice that before optimization, the model requires the variational distribution q(X) to be initialised from the observations V. A simple way of initialising the means of q(X), is to concatenate all views into a matrix and then projected it to q dimensions through PCA. The variational covariances can all be initialised around 0.5. Alternatively, one can project each view through PCA onto low dimensional spaces, and then concatenate these projections to obtain the initial variational means. The second approach is a more reasonable one if the different views have very different dimensionalities. In the presence of many views, private and shared spaces can emerge in any possible combination of subsets. For example, a part of the latent space might be relevant for more than one view, but irrelevant to another subset of the views. Despite this segmentation, there might still exist a common underlying process responsible for generating the latent space, e.g. a temporal process. This prior belief can be accommodated by a Gaussian process prior on X, exactly as for the case of the dynamical variational GP-LVM.
5.2.4
Inference
Assume a model which is trained to jointly represent multiple output spaces V with a common but segmented input space X. Assume also that the total set of views is split as V = {A, B} where we use calligraphic notation to denote sets of views. Finally, assume that our task at test time is to generate a new (or infer a training) set of outputs Y∗B given a set of (potentially partially) observed test points Y∗A . The inference proceeds by predicting (the distribution over) the set of latent points X∗ ∈ Rn∗ ×q which is most likely to have generated Y∗A . For this, we use the approximate posterior q(X, X∗ ) ≈ p(X, X∗ |YA , Y∗A ), which has analogous form and is found in analogous way as for the variational GP-LVM model. That is, to find q(X, X∗ ) we optimise a variational lower bound on the marginal likelihood p(YA , Y∗A ) which has analogous form with the training objective function. Specifically, the training objective function is given in equation (5.3) and, in turn, depends on equation (5.2). To find q(X, X∗ ) we use these equations but now the data is (YA , Y∗A ) and the latent space is (X, X∗ ). After finding q(X, X∗ ), we can then find a distribution of the outputs Y∗B by taking the expectation of the likelihood p(YB |X) under the marginal q(X∗ ), using equation (3.36). Notice that the above described way of finding the posterior q(X∗ ) based on a subset of views Y∗A means that the latent dimensions that are private for Y∗B are taken directly from the prior, since the views in YA can tell us nothing about the private
5.3 Experiments
111
Algorithm 2 Inference heuristic in MRD, assuming two views YA and YB 1:
Given: MRD model trained on data (YA , YB ) to obtain X = (XA , XAB , XB ).
2:
Given: A test point y∗A .
3:
Optimise q(X, x∗ ) ≈ p(X, x∗ |YA , y∗A ).
4:
AB B Get the marginal q(x∗ ) with mean x∗ = (xA ∗ , x∗ , x∗ ).
˜ (k) from a K−nearest neigbour search between xAB Find K points x and XAB . ∗ for k = 1, · · · , K do AB ˜ (k) and x∗ appropriately. ˜B ˜ (k),∗ = (xA Generate x ∗ , x∗ , x (k) ) by combining x B B 8: Generate y(k),∗ from the likelihood p(y |˜ x(k),∗ ).
5: 6: 7:
9:
Most likely predictions are obtained for k = 1. We only use k > 1 if we are interested in finding correspondences in the training set (see Section 5.3.2).
10:
In the dynamical MRD version, all test points Y∗A are considered together, so that the variational distribution q(X, X∗ ) of state 3 will form a timeseries.
information in YB . This is not necessarily problematic, but in certain cases we might want to “force” the private latent space XB to take values that are closer to those found in the training set; for example when we want to generate sharp images. For this scenario, a simple heuristic is suggested. Specifically, after optimising q(X∗ ) based on Y∗A as was described above, we perform a nearest neighbour search to find ˜ which are closest to the mean of q(X∗ ) in the projection the training latent points X to the dimensions that are shared between the views in YA and in YB . We then create ˜ ∗ which matches the mean of q(X∗ ) in the shared and in the a test latent vector X ˜ in the B-specific dimensions. YB can then be A-specific dimensions and matches X ∗ ˜ ∗ ). This heuristic, summarised in Algorithm predicted through the likelihood p(YB |X ˜ is in essence used as a means 2, is used for our experiments. If Y∗A = YA , then X of finding correspondences between two sets of views through a simpler latent space. This case is demonstrated in Section 5.3.2.
5.3
Experiments
The manifold relevance determination (MRD) model is evaluated and demonstrated in this section. To demonstrate the flexibility of the model, we apply it to several different types of data sets, with different number of views and associated with a wide range of different tasks. In particular, we consider the following tasks: view consolidation, information transferring between views, classification, data exploration / generation / visualisation and, finally, inference of correlations in output dimensions.
112
Manifold Relevance Determination
Supplementary videos for these experiments can be found at: http://git.io/A3qo.
5.3.1
Toy data
As a first experiment we will use an intuitive toy example similar to the one that was proposed in [Salzmann et al., 2010]. We generate three separate signals, a cosine and a sine which will be our private signal generators and a squared cosine as shared signal. We then independently draw three separate random matrices which map the two private signals to 10 dimensions and the shared to 5. The two sets of observations YA and YB consist of the concatenation of one of the private and the shared data with added isotropic Gaussian noise. Using a GP prior with a linear covariance function the model should be able to learn a latent representation of the two datasets by recovering the three generating signals, a sine and a cosine as private and the squared cosine as shared. In figure 5.2 the results of the experiment is shown. The model learns the correct dimensionality of the data and is able to recover the factorization used for generating the data. We also experimented with adding a temporal prior on the latent space. In this case, the recovered signals are forced to be smooth, and almost exactly match the true ones (and therefore these results are not plotted in figure 5.2 ). We will therefore now proceed to apply the model to more challenging data where the generating parameters and their segmented structure are truly unobserved.
5.3.2
Yale Faces
The Yale face database B [Georghiades et al., 2001] is a collection of images depicting different individuals in different poses under controlled lighting conditions. The dataset contains 10 individuals in 9 different poses each lighted from 64 different directions. The different lighting directions are positions on a half sphere as can be seen in figure 5.3. The images for a specific pose is captured in rapid procession such that the variations in the image for a specific person and pose should mainly be generated by the light direction. This makes the data interesting from a dimensionality reduction point of view, as the representation is very high-dimensional, 192 × 168 = 32256 pixels, while the generating parameters, i.e. the lighting directions and pose parameters, are very low dimensional. There are several different ways of using this data in the MRD framework, depending on which correspondence aspect of the data is used to align the different views. We chose to use all illuminations for a single pose. We generate two separate datasets YA and YB by splitting the images into two sets such that the two views contain three different subjects each. The order of the data was
113
5.3 Experiments
1
1
0.9
0.9
0.8
0.8
0.7
0.7 0.6
0.6
0.5
0.5
0.4
0.4
0.3
0.3
0.2
0.2
0.1
0.1
0
3
1
9
7
5
11
13
15
0
1
(a) Eigenspectrum of observed data 1
1
1
0.8
0.8
0.6
0.6
0.6
0.4
0.4
0.4
0.2
0.2
0.2
0
0
0
−0.2
−0.2
−0.2
−0.4
−0.4
−0.4
−0.6
−0.6
−0.6
−0.8
−0.8
−0.8
−1
−1 10
20
30
40
50
60
70
(c) Shared signal
80
90
100
5
7
6
8
(b) Learned ARD scales
0.8
0
4
3
2
−1 0
10
20
30
40
50
60
70
80
90
100
(d) Private signal for view YA
0
10
20
30
40
50
60
70
80
90
100
(e) Private signal for view YB
Fig. 5.2: MRD on a toy data set. Initialized with 8 latent dimensions the model switched off all dimensions except for three: one private for each observation space and one shared, which corresponds well to the eigenspectrum of the data that clearly shows three variables. The numbers on the y−axis are normalised so that the maximum is 1. The second row depicts the recovered latent signals in red and the generating signals in blue. For easier interpretation, they have been post-processed to remove the scale degree of freedom such that the learned latent space matches the generating signals. Note that no temporal information was given (i.e. all points were treated as independent). When the temporal information was given through a prior p(X|t), the recovered signals were smooth and matched almost exactly the true ones. B such that the lighting direction of each yi,: matched that of yi,: while the subject identity was random, such that no correspondence was induced between different faces. As such, the model should learn a latent structure segmented into lighting parameters (a point on a half-sphere) and subject parameters where the first are shared and the latter private to each observation space.
The optimized relevance weights {wA , wB } are visualized as bar graphs in figure 5.4. The latent space is clearly segmented into a shared part, consisting of dimensions indexed3 as 1,2 and 3, two private and an irrelevant part (dimension 9). The two data views correspond to approximately equal weights for the shared latent dimensions. Projections onto these dimensions are visualised in figures 5.5(a) and 5.5(b). Even though not immediately obvious from these two-dimensional projections, inter3
Dimension 6 also encodes shared information, but of almost negligible amount (w6A , w6B ≈ 0).
114
Manifold Relevance Determination
Fig. 5.3: The mechanism used to generate the Yale Faces dataset [Georghiades et al., 2001]. wjA
wjB
(a) The scale vector wA
j
(b) The scale vector wB
j
Fig. 5.4: The relevance weights for the faces data. Despite allowing for soft sharing, the first 3 dimensions are switched on with approximately the same weight for both views of the data. Most of the remaining dimensions are used to explain private variance.
action with the shared latent space reveals that it actually has the structure of a half sphere, recovering the shape of the space defined by the fixed locations of the light source shown in figure 5.3. By projecting the latent space onto the dimensions corresponding to the private spaces, we essentially factor out the variations generated by the light direction. As can be seen in figure 5.5(c), the model then separately represents the face characteristics of each of the subjects. This indicates that the shared space successfully encodes the information about the position of the light source and not the face characteristics. This indication is enhanced by the results found when we performed dimensionality reduction with the variational GP-LVM for pictures corresponding to all illumination conditions of a single face (i.e. a dataset with one modality). Specifically, the latent space discovered by the variational GP-LVM and the shared subspace discovered by MRD have the same dimensionality and similar structure, as can be seen in figure 5.6. As for the private manifolds discovered by MRD, these correspond to subspaces for
115
5.3 Experiments
x1
x1
x2
(a)
x5
(b)
x3
(c)
x14
Fig. 5.5: Projection of the shared latent space into dimensions {1, 2} and {1, 3} (figures (a) and (b)) and projection of the YA −private dimensions {5, 14} (figure (c)). Red x’s represent (projected) locations of latent points that correspond to the training data. The greyscale intensities of the background are proportional to the predicted variance of the GP mapping, if the corresponding locations were given as inputs. The MRD segmented the latent space so that the latent points in figure (c) form three clusters, each responsible for modelling one of the three faces in YA .
wj
x2
(a)
j
x2
(b)
x1
(c)
x3
Fig. 5.6: Latent space learned by the standard variational GP-LVM for a single face view. The weight set w associated with the learned latent space is shown in (a). In figures (b) and (c) we plotted pairs of the 3 dominant latent dimensions against each other. Dimensions 4, 5 and 6 have a very small but not negligible weight and represent other minor differences between pictures of the same face, as the subjects often blink, smile etc.
disambiguating between faces of the same view. Indeed, plotting the largest two dimensions of the first latent private subspace against each other reveals three clusters, corresponding to the three different faces within the dataset. Similarly to the standard variational GP-LVM applied to a single face, here the private dimensions with very small weight model slight changes across faces of the same subject (blinking etc). We can also confirm visually the subspaces’ properties by sampling a set of novel inputs Xsamp from each subspace and then mapping back to the observed data space using the likelihoods p(YA |Xsamp ) or p(YB |Xsamp ), thus obtaining novel outputs (images). To better understand what kind of information is encoded in each of the dimensions of the shared or private spaces, we sampled new latent points by varying only one dimension at a time, while keeping the rest fixed. The first two rows of figure 5.7
116
Manifold Relevance Determination
Fig. 5.7: Sampling inputs to produce novel outputs. First row shows interpolation between positions of the light source in the x coordinate and second row in the y coordinate (elevation). Last row shows interpolation between face characteristics to produce a morphing effect. Note that these images are presented scaled here, the original size is 192 × 198 pixels.
show some of the outputs obtained after sampling across each of the shared dimensions 1 and 3 respectively, which clearly encode the coordinates of the light source, whereas dimension 2 was found to model the overall brightness. The sampling procedure can intuitively be thought as a walk in the space shown in figure 5.5(b) from left to right and from the bottom to the top. Although the set of learned latent inputs is discrete, the corresponding latent subspace is continuous, and we can interpolate images in new illumination conditions by sampling from areas where there are no training inputs (i.e. in between the red crosses shown in figure 5.5). Similarly, we can sample from the private subspaces and obtain novel outputs which interpolate the non-shared characteristics of the involved data. This results in a morphing effect across different faces, which is shown in the last row of figure 5.7. The two interpolation effects can be combined. Specifically, we can interactively obtain a set of shared dimensions corresponding to a specific lighting direction, and by fixing these dimensions we can then sample in the private dimensions, effectively obtaining interpolations between faces under the desired lighting condition. This demonstration, and the rest of the results, are illustrated in the online videos (http://git.io/A3qo). As a final test, we confirm the efficient segmentation of the latent space into private and shared parts by automatically recovering all the illumination similarities A found in the training set. More specifically, given a datapoint yi,: from the first view, we search the whole space of training inputs X to find the 6 nearest neigbours to the A latent representation xi,: of yi,: , based only on the shared dimensions. From these latent points, we can then obtain points in the output space of the second view, by
5.3 Experiments
117
Fig. 5.8: Given the images of the first column, the model searches only in the shared latent space to find the pictures of the opposite view which have the same illumination condition. The images found, are sorted in columns 2 - 7 by relevance.
using the likelihood p(YB |X). This procedure is a special case of Algorithm 2 where the test point given is already in the training set. As can be seen in figure 5.8, the model returns images with matching illumination condition. Moreover, the fact that, typically, the first neighbours of each given point correspond to outputs belonging to different faces, indicates that the shared latent space is “pure”, and is not polluted by information that encodes the face appearance.
5.3.3
Pose Estimation and Ambiguity Modelling
For our next experiment, we consider a set of 3D human poses and associated silhouettes, coming from the dataset of Agarwal and Triggs [2006]. We used a subset of 5 sequences, totaling 649 frames, corresponding to walking motions in various directions and patterns. A separate walking sequence of 158 frames was used as a test set. Each pose is represented by a 63−dimensional vector of joint locations and each silhouette is represented by a 100−dimensional vector of HoG (histogram of oriented A n∗ gradients) features. Given the test silhouette features {yi,∗ }i=1 , we used our model
118
Manifold Relevance Determination
B n∗ to generate the corresponding poses {yi,∗ }i=1 . This is challenging, as the data are multi-modal and ambiguous, i.e. a silhouette representation may be generated from more than one pose (e.g. figure 5.9).
Fig. 5.9: Although the two poses in the second column are very dissimilar, they correspond to resembling silhouettes that have similar feature vectors. This happens because the 3D information is lost in the silhouette space, as can also be seen in the third column, depicting the same poses from the silhouettes’ viewpoint.
The inference procedure proceeds as described in Algorithm 2. Specifically, given A a test point yi,∗ we firstly estimate the corresponding latent point xi,∗ . Since this point contains no information about the YB modality, to fill in the B-specific dimensions we find a series of K candidate initial training inputs {˜ x(k) }K k=1 , sorted according to their similarity to the estimated xi,∗ . This nearest neighbour search only takes into AB account the shared latent dimensions, i.e. xAB . Before proceeding to prei,∗ and X ˜ (k) are dicting in the output space, it is interesting to investigate which latent points x returned by the nearest neighbour search, as this will reveal properties of the shared latent space. While exploring this aspect, we found that the training points suggested as most similar in the shared space typically correspond to silhouettes (outputs) simA ilar to the given test one, yi,∗ . This confirms that the segmentation of the latent space is efficient in representing the correct kind of information in each subspace. However, when ambiguities arise, as the example shown in figure 5.9, the non-dynamical version of our model has no way of selecting the correct input, since all points of the test sequence are treated independently. Intuitively, this means that two very similar A A ˜ (i+1),∗ ) from test givens (yi,∗ , yi+1,∗ ) can be mapped to generated latent vectors (˜ xi,∗ , x B B which predictions (yi,∗ , yi+1,∗ ) in the other modality can be drastically different. But when the dynamical version is employed, the model forces the whole set of training
5.3 Experiments
119
and test inputs (and, therefore, also the test outputs) to form smooth paths. In other words, the dynamics disambiguate the model. A Therefore, given a test silhouette yi,∗ , the temporal posterior q(xi,∗ ) will be centered on an input xi,∗ which is temporally correlated with the other points. This also ˜ i,: returned by the nearest neigbour search results in a temporally correlated point x performed to fill in the B-specific dimensions (in state 5 of Algorithm 2). This temporal disambiguation effect is demonstrated in figure 5.10. As can be seen, our method ˜ i,: which does not necessarily correspond to the is forced to select a training input x training silhouette that is most similar to the test one (i.e. the silhouette that we obtain A and YA ). Instead, it takes into if we perform nearest neighbour search between yi,∗ account the temporal correlation of the whole generated sequence. What is more, if B we assume that the test pose yi,∗ is known and look for its nearest training neighbour in the pose space, we find that the corresponding silhouette is very similar to the one found by our model, which is only given information in the silhouette space. This ˜ i,: used to impute the information for the pose proves that the discovered latent point x modality is selected correctly, thanks to taking temporal information into account.
After the above analysis regarding the properties of the latent space, we now proceed to evaluate the next step, that is, the generation of test poses y∗B . Figure 5.10 shows one encouraging example of this result. To more reliably quantify the results, we compare our method with linear and Gaussian process regression and with nearest neighbour in the silhouette space. We also compared against the shared GP-LVM [Ek, 2009] which optimises the latent points using MAP and, thus, requires an initial segmentation of the inputs to be given a priori. Finally, we compared to a dynamical version of nearest neighbour where we kept multiple nearest neighbours and selected the coherent ones over a sequence. The errors shown in table 5.1 as well as the on-line videos show that MRD performs better than the other methods in this task.
5.3.4
Classification
We will now look at a classification task. The training dataset was created such that a matrix YA contained the actual observations and a matrix YB the corresponding class labels in 1-of-K encoding. This experimental setting is quite different from the ones considered so far, since the two views contain very diverse types of data; in particular, the class-label view contains discrete, low dimensional features. Further, these features are noise-free and very informative for the task at hand and, therefore, applying MRD in this dataset can be seen as a form of supervised dimensionality reduction. The challenge for the model is to successfully cope with the different levels
120
Manifold Relevance Determination
Given
MRD
NN NN (sil. space) (pose space)
A for the test silhouette in column one, we predict the Fig. 5.10: Given the HoG features yi,∗ B using the dynamical version of MRD and nearest neighbour (NN) in corresponding pose yi,∗ the silhouette space obtaining the results in the first row, columns 2 and 3 respectively. The last row is the same as the first one, but the poses are rotated to highlight the ambiguities. Notice that the silhouette shown in the second row for MRD does not correspond exactly to the pose of the first row, as the model generates a novel pose given a test silhouette. Instead, ˜ i,: . it is the training silhouette found by performing NN in the shared latent space to obtain x A given As some form of “ground truth”, in column 4 we plot the NN of the training pose yi,: B (which is normally unknown during the test phase). the test pose yi,∗
of noise in the views, while managing to recover a shared latent space from two very diverse information sources. In particular, we would ideally expect to obtain a shared latent space which encodes class information and a nonexistent private space for the class-label modality. To test our hypotheses, we used the ‘oil’ database which was introduces in Section 3.5.2 and contains 1000 12−dimensional examples split in 3 classes. We selected 10 random subsets of the data with increasing number of training examples and compared to the nearest neighbor (NN) method in the data space. The label B B B B ⊤ A yi,: = [yi,1 , yi,2 , yi,3 ] corresponding to the training instance yi,: was encoded so that B A B yi,j = −1 if yi,: does not belong to class j, and yi,j = 1 otherwise. Given a test inA B stance yi,∗ , we predict the corresponding label vector yi,∗ as before. Since this vector B contains continuous values, we use 0 as a threshold to obtain values yi,j ∈ {−1, 1}. With this technique, we can perform multiclass and multilabel classification, where an
121
5.3 Experiments
Mean Training Pose Linear Regression GP Regression Nearest Neighbour (sil. space) Nearest Neighbour with sequences (sil. space) Nearest Neighbour (pose space) Shared GP-LVM MRD without Dynamics MRD with Dynamics
Error 6.16 5.86 4.27 4.88 4.04 2.08 5.13 4.67 2.94
Table 5.1: The mean of the Euclidean distances of the joint locations between the predicted and the true poses. The Nearest Neighbour in the pose space is not a fair comparison, but is reported here as it provides some insight about the lower bound on the error that can be achieved for this task.
instance can belong to more than one classes. The specific dataset considered in this section, however, is not multilabel. To evaluate this technique, we computed the classification accuracy as a proportion of correctly classified instances. As can be seen in Figure 5.11, MRD successfully determines the shared information between the data and the label space and outperforms NN. This result suggests that MRD manages to factor out the non class-specific information found in YA and perform classification based on more informative features (i.e. the shared latent space). It is worth mentioning that, as expected, the models trained in each experimental trial defined a latent space segmentation where there is no private space for the label view, whereas the shared space is one or two dimensional and is composed of three clusters (corresponding to the three distinct labels). Therefore, by segmenting out signal in YA that is irrelevant to the classification task, we manage to obtain a better classification accuracy. The above are confirmed in figure 5.12, where we plot the shared latent space and the relevance weights for the model trained on the full dataset.
5.3.5
Multiview Models and Data Exploration
We have so far demonstrated MRD in datasets with two modalities. However, there is no theoretical constraint on the number of modalities that can be handled by MRD. In this section we will use the AVletters database [Matthews et al., 2002] to generate multiple views of data. This audio-visual dataset was generated by recording the audio and visual signals of 10 speakers that uttered the letters A to Z three times each (i.e. three trials). The audio signal was processed to obtain a 299− dimensional vector per utterance. The video signal per utterance is a sequence of 24 frames, each
122
Manifold Relevance Determination
Fig. 5.11: Accuracy obtained after testing MRD and NN on the full test set of the ‘oil’ dataset.
being represented by the raw values of the 60 × 80 pixels around the lips, as can be seen in figure 5.13. Thus, a single instance of the video modality of this dataset is a 115200− dimensional vector.
Data Exploration Depending on the desired predictive or exploratory task, different subsets of the data can be split across different views. To explore the connections and commonalities in the information encoded in different subjects, letters and type of signal (video or audio), we first performed data exploration by considering the following generic setting: we created a dataset where the modalities were split across all subjects and across type of signal. We only considered 8 of the subjects. Thus, we ended up with 16 different modalities, where modalities i, i + 1 contained the video and audio signal respectively for the i−th subject. The alignment was therefore made with respect to the different letters. We used all three available trials but letters “B”, “M” and “T” were left out of the training set completely. For each modality, we thus had 69 rows (23 letters × 3 trials). The split across instances and modalities is summarised in Table 5.2. In the test set, each modality had only 9 rows (3 letters × 3 trials). Notice that this is a rather extreme scenario: the number of training instances is only 4.3 times larger than the number of modalities. We applied MRD to reveal the strength of commonality between signal corresponding to different subjects and to different recording type (video/audio). The visualisation of the ARD weights can be seen in figure 5.14. This figure shows that similar weights are typically found for modalities 1, 3, 5, ..., i.e. for the ones that correspond to the video signal. This means that if, for example, one would like to predict the lip movements in a test scenario, the other pieces of
123
5.3 Experiments
Data view Labels view
1
2
3
4
5
(a) Relevance weights
6
7
(b) Shared latent space.
Fig. 5.12: Results from testing the MRD as a classifier on the full “oil flow” dataset, where one of the views was the data and one the class labels. Three important observations can be made: firstly, both views “agree” on using dimensions 6 and 7 (and the data view even switches off one other dimension). Secondly, the labels’ view has no private space. Thirdly, the shared latent space projection clearly clusters the data according to their class label.
Fig. 5.13: Two example frames of the AVletters dataset.
information that can help the most in predicting is the lip movements of the rest of the subjects. We can also draw other sorts of conclusions from this kind of data exploration. For example, we can see that the subject number 3 is the one that has the best variance alignment (according to the trained model) between the video and audio signal. This can be understood by observing that the 5th and 6th row of the matrix in figure 5.14 share some weights (highlighted with a green box), i.e. modality 5 and 6 share a latent subspace.
Generation Task Given the above analysis, we attempted to recover the lip movements of subject 3 for uttering the three test letters “B”, “M”, “T”. The given information was the audio signal of this subject as well as the video signal of all the rest (corresponding to the same letters). The RMSE error for MRD was 0.3 while for NN it was 0.35.
124
Manifold Relevance Determination view 1 (subj.1, video) 1 2 3 .. .
n = 69
···
view 2 (subj.1, audio)
view 15 (subj.8, video)
view 16 (subj.8, audio)
‘A’ trial 1 ‘A’ trial 2 ‘A’ trial 3 ··· ‘Z’ trial 3
Table 5.2: View/row split for the first ‘AVletters’ experiment. 2 4
views
6 8 10 12 14 16 5
10
15
20
25
30
35
40
latent dimensions
Fig. 5.14: The optimised weights for the first version of the AVletters experiment represented as a heat-map. “Warm” (red) colors on column i, j indicate a large weight for latent dimension j and modality i. Notice that for visualisation of these weights we normalized them to be between 0 and 1 and used a threshold so that wi,j < ε (with ε → 0) was set to zero. The green box highlights a shared latent space (dimension 26) for views 5 and 6 (subject 3).
Incorporating Labels We subsequently considered a different scenario for modelling the AVletters data base in which we also wanted to include some sort of label information. Specifically, we selected the utterances of the first three subjects for the first two trials and for letters A to Q and constructed three views as follows; view 1 contained the audio signal by stacking the relevant information for all considered subjects, trials and letters. Similarly, view 2 contained the video signal. Each row in views 1 and 2 corresponds to one of three subjects, and to encode this information we use a third view. Thus, view 3 contains the discrete labels C ∈ {000, 010, 100} which specify the subject identity. This construction resulted in a training set of 102 datapoints per view (3 subjects × 17 letters × 2 trials) and is summarised in Table 5.3. Therefore, the subject identity is directly encoded by a single view containing discrete labels corresponding to each row of all the other views. This comes in contrast to the representation described in the previous paragraph, where the subject identity was implicitly encoded by having
125
5.3 Experiments
a separate views per subject. The ordering of the rows in the three views does not matter, as long as the same permutation is applied to all three views. With the above 1 2 .. . 34 35 .. . n = 102
subj 1, ‘A’, trial 1 subj 1, ‘A’, trial 2
View 1 audio audio
View 2 video video
View 3 001 001
··· subj 1, ‘Q’, trial 2 subj 2, ‘A’, trial 1
··· audio audio
··· video video
··· 001 010
··· subj 3, ‘Q’, trial 2
··· audio
··· video
··· 100
Table 5.3: View/row split for the second ‘AVletters’ experiment.
setting we are, thus, interested in modelling the commonality between the two types of signal for each person with regards to global characteristics, like accent, voice, lip movement and shape. This is because the data were aligned across modalities so that audio and video utterances were matched irrespective of the pronounced letter. The segmentation learned by MRD is shown by the optimised weights in figure 5.15.
Fig. 5.15: The optimised weights for the second version of the AVletters experiment represented as a heat-map which has the same format as for figure 5.14
As can be seen, in this scenario the video and audio signals only share one latent dimension (4) while the subject identifier modality shares weights with both of the other two signals. This means that, given this small training set, MRD manages to reveal the commonality between the audio and video signals and, at the same time, learn to differentiate between subjects in both the video and the audio domain. To further confirm this hypothesis, we attempted to transfer information between views. To do that, we created a test set in a similar way as for the training one but for the third trial of the recordings. From this test dataset we attempted to predict the video signal in two ways: firstly by giving only the corresponding audio signal and, secondly, by giving both the audio and subject identity information. For comparison, we used nearest neighbour and standard Gaussian process regression, as can be seen in Table 5.4 which presents the corresponding RMSE. Notice that the model could also end up with a completely separate space for the third modality (labels); the fact that it didn’t means that the way in which video and
126
Manifold Relevance Determination
Table 5.4: RMSE of predicting the video information of test data, given only the audio or the audio and subject id information.
Given audio audio, labels
Predicted video video
MRD 0.498 0.434
NN 0.485 0.485
GP 0.494 0.472
audio are associated in this dataset is also dependent on the subject, something which is expected, especially since two of the subjects are females and one is male. One can see from Table 5.4 that when MRD is given the label information, it can disambiguate better in the prediction phase and produce smaller error. Finally, we tested the model in the opposite direction: specifically, we presented the video and audio signal of the test (third) trial of the recordings to the model and tried to recover the identity of the subject. To make this more challenging, we randomly erased 50% of the information from each of the given views. The vast dimensionality of the given space did not allow us to compare against a standard GP regression model, so we only compared against nearest neighbour. The result was an F-measure4 of 0.92 for MRD compared to 0.76 for NN.
5.3.6
Automatic Correlation Learning of Output Dimensions
The GP-LVM makes the assumption that all dimensions of the latent space, {xj }qj=1 , affect all output dimensions, {yj }pj=1 , since a single GP mapping is used5 . In MRD we make conditional independence assumptions for subspaces of X, so that different views are generated by different GP mappings. In this section, we consider the extreme case where we want to learn automatically all conditional independencies of a multivariate dataset’s dimensions. In some sense, this is a means of simultaneously performing graphical model learning (learn conditional independencies) and manifold learning (learn manifolds). To achieve this goal, we reformulate the observed dataset Y ∈ ℜn×p so that each dimension yj ∈ ℜn constitutes a separate view of the data. Then, following the MRD formulation, we consider a single latent space X which encapsulates output correlations through the p sets of ARD weights. These weights constitute the hyperparameters of p separate, independent Gaussian processes. The above formulation, from now on referred to as fully independent MRD (FIMRD), allows us to discover correlations of the output dimensions via the latent space. precision·recall true positives The F-measure is given by F1 = 2 · precision+recall = 2 · true positives 2+·false negatives + false positives . 5 More precisely, multiple GP mappings with shared parameters are used.
4
5.3 Experiments
127
We have already seen examples of this task in figure 5.7, where we sampled from specific latent dimensions and observed the obtained variance in the outputs. A similar task could be achieved with the motion capture dataset of figure 5.9. For example, we might observe that a specific latent dimension is responsible for encoding the variance in both legs’ movements. In this section we are interested in discovering this kind of effect automatically (without the need to sample) and also by considering all possible subsets of latent dimensions at the same time. This task reminds the objectives of multi-output Gaussian process inference [see e.g. Álvarez et al., 2010], according to which the GP output function correlations are sought to be modelled explicitly by defining special covariance funtions. However, in our framework the inputs to the covariance functions are latent, and the output correlations are rather captured by defining a special noise model. To test this model, we considered again the motion capture dataset introduced in Section 5.3.3 (without the silhouette views). We used a smaller subset of 120 frames that represent 4 distinct walking motions (two facing to the North, one facing to the South, and a semi-circular motion). In this motion capture dataset, the human subjects are represented in the 3D coordinate space. That is, each of the 21 body joints is represented as a 3 dimensional vector, corresponding to the degrees of freedom along the (x, y, z) axes. Therefore, we have p = 63 columns in the original dataset which we use to form 63 single-dimensional views. The motion is centered with respect to the root node, so that the subject moves in place. Each view has its own set of ARD weights, but since every 3 views (and thus every 3 sets of weights) correspond to the same joint (for different degrees of freedom), we can group these 63 weight (j) (j) (j) (j) sets as wxyz = [wx wy wz ], j = 1, · · · , 21. Notice, however, that each of the 63 sets of weights is a priori independent and learned separately, we just group them by 3 according to their corresponding joints after optimisation, just for performing our data analysis more easily. For the data analysis, we perform k-means clustering on (j) the 21 vectors wxyz , j = 1, ..., 21, where each vector has dimensionality 3q × 1. In this way, we can investigate which parts of the latent space are operating together to control a particular joint. The q = 10 dimensional latent space was not constrained with dynamics, and was initialised by performing PCA on the whole Y dataset. As can be seen in figure 5.16 the model uncovers intuitive correlations in the joints of the body, via the cluster assignments. For example, the model tends to represent the head with a separate latent subspace, whereas joints belonging to the same limb typically share parts of the latent space. Moreover, the discovered clusters are similar (but not identical) to the ones obtained if we directly cluster the output dimensions corresponding to each
128
Manifold Relevance Determination
Fig. 5.16: In the fully independent MRD experiment we have 21 joints × 3 degrees of freedom (x,y,z coordinates) = 63 one-dimensional views. The 3 sets of ARD weights for each joint are clustered in k clusters. The figure shows the cluster assignments for each joint, for k = 3 (far left) to k = 10 (far right). Each cluster is represented as a separate combination of symbol/color and corresponds to output dimensions controlled by similar latent subspaces.
joint (after we group them by 3, aggregating information for the x, y, z coordinates). Therefore, the fully independent MRD formulation manages to maintain and uncover the cluster related properties of the original dataset in the efficiently segmented latent space. Achieving this via a low-dimensional latent space is important, since very high-dimensional output spaces might not be easily clustered in the high-dimensional Euclidean space. Further, the MRD formulation allows us to transfer information between output dimensions (which here constitute separate views), a task which is typically solved (in supervised learning) using multi-output GPs.
5.4
Conclusions
This chapter presented manifold relevance determination (MRD), a new segmented latent variable model for multi-view data. The model automatically segments the signal in the data using variables representing variance that exists in each view separately from variance being specific to a particular view. We introduced a relaxation to the discrete segmentation of the latent representation and allow for a “softly” shared latent space. To be able to perform tractable inference, we extended the variational framework presented in Chapter 3. Therefore, the attractive Bayesian properties of the variational GP-LVM were transferred to MRD as well. Recall that the variational GPLVM automatically discovers an effective latent space dimensionality for one dataset (view) by “switching off” weights corresponding to irrelevant dimensions. Similarly, the MRD discovers an effective latent space segmentation for multiple views, by switching on and off weights according to variance alignment between views. The Bayesian automatic Occam’s razor penalises redundancy in the latent space and, therefore, shared subspaces naturally emerge without having to incorporate bespoke
5.4 Conclusions
129
regularisers or heuristic constraints. We demonstrated the power of MRD as a generic tool for probabilistic inference. The approach is very effective in modelling ambiguous views and, if needed, is able to incorporate prior information (e.g. temporal continuity) to disambiguate predictions. Simple extensions (or rather, model constructions) allowed us to use MRD for structured generation of novel data, data exploration, visualisation, multi-label classification and inference of correlations in output dimensions. Similarly to the variational GP-LVM, the model can be scaled up computationally using parallel and, possibly, stochastic inference. We leave this extension as future work. Another interesting path to investigate is to use MRD as a generic feature consolidation and denoiser. For example, given a set of different trials of the same biological experiment, we can use MRD to factor out the irrelevant environmental noise corrupting our data. MRD has already been extended to non-Gaussian likelihoods by Andrade-Pacheco et al. [2014], who incorporated an expectation propagation approximation. The MRD algorithm was also adapted by Zhang et al. [2013] for the purpose of learning factorised topic models. A current limitation of the model, is that the latent space segmentation relies on the alignment of the views. This requirement can be unrealistic for some data collection protocols. For example, we might perform measurements at different frequencies to represent different views of the same underlying temporal process. One possible way to tackle this problem is to allow for approximate alignments by treating the observation spaces as distributions. The fact that the segmentation of the latent space is “soft” can be seen as both a good feature and a limitation. Indeed, in certain applications a spike-and-slab type of behaviour is more desirable.
Chapter 6 Deep Learning with Gaussian Processes Gaussian process models provide flexible, non-parametric, probabilistic approaches to function estimation in an analytically tractable manner. However, their tractability comes at a price: they can only represent a restricted class of functions. Indeed, even though sophisticated definitions and combinations of covariance functions can lead to powerful models [Durrande et al., 2011; Gönen and Alpaydin, 2011; Hensman et al., 2013b; Duvenaud et al., 2013; Wilson and Adams, 2013], the assumption about joint normal distribution of instantiations of the latent function remains; this limits the applicability of the models. Transformed representations [see e.g. Turner, 2010] have been used as a workaround. Another line of recent research to address this limitation focused on function composition [Snelson et al., 2004; Calandra et al., 2014] or process composition [Lawrence and Moore, 2007; Damianou et al., 2011; LázaroGredilla, 2012; Damianou and Lawrence, 2013; Duvenaud et al., 2014; Hensman and Lawrence, 2014]. In this chapter, we consider the particular process composition case resulting from nesting Gaussian processes, thereby introducing the term deep Gaussian processes (deep GPs) due to the relationship between these models and deep neural network models. In a deep GP, the data is modeled as the output of a multivariate GP whose inputs are governed by another GP; the overall model is no longer a GP. By recursing this procedure we form multiple layers. Even though full Bayesian inference is tractable for standard GPs, this is not the case for deep Gaussian processes. However, work presented in the previous chapters of this thesis laid the foundation for developing a tractable variational approximation framework for deep Gaussian processes. Specifically, the variables of every layer in the deep hierarchy can be treated as latent vari-
132
Deep Learning with Gaussian Processes
ables; this enables extension of the variational methodology of the previous chapters in the hierarchical setting, so as to approximately integrate out the latent variables in arbitrarily deep models. In this way, we obtain a deep, non-parametric generative model for unsupervised learning. The extension to the supervised scenario comes from constraining the whole hierarchy according to observed inputs, incorporated with the same mechanism presented in Chapter 3 for temporal inputs. Therefore, the main contributions of this chapter are: • Characterising the nature and properties of deep Gaussian processes for supervised and unsupervised learning. • Extending the mechanisms for uncertainty propagation in (“shallow”) GP-based graphical models presented in the previous chapters to the nested process composition case. It is shown that the developed variational framework allows for efficient regularisation, as well as automatic complexity control and structure discovery in deep Gaussian process models. It is demonstrated how a deep hierarchy of Gaussian processes can be obtained by marginalising out the latent variables in the structure, obtaining an approximation to the fully Bayesian training procedure and a variational approximation to the true posterior of the latent variables given the outputs. • The final contribution is to demonstrate the applicability of deep models even when data are scarce. The Bayesian training framework provides an automatic Occam’s razor, so that hidden spaces with increasing levels of concept abstraction are discovered without overfitting. Further, the statistical effects associated with learning from small sample sizes are counteracted by the reliability estimates provided by the Bayesian framework. The other extreme case, i.e. learning from very large datasets, is also discussed; incorporating the big data methodologies of Hensman et al. [2013a]; Gal et al. [2014]; Dai et al. [2014] seems like a plausible direction. • Several existing models can be implemented as specific instances of a deep GP, such as deep autoencoders [Kingma and Welling, 2013] of non-parametric nature and Bayesian warped Gaussian processes [Snelson et al., 2004; LázaroGredilla, 2012]. This chapter focuses especially on the development of nonparametric variational autoencoders. Overall, the resulting deep Gaussian process model is very flexible and should open up a range of applications for deep structures.
6.1 Background
6.1
133
Background
Probabilistic modelling with neural network architectures constitute a well studied area of machine learning. The recent advances in the domain of deep learning [Hinton et al., 2006; Bengio et al., 2012] have brought this kind of models back in popularity. Empirically, deep models seem to have structural advantages that can improve the quality of learning in complicated data sets associated with abstract information [Bengio, 2009]. The traditional approach to deep learning is based around hierarchical architectures such as neural networks or restricted Boltzmann machines (RBMs) [Hinton, 2010]. In particular, many of the early successes of model based deep learning are associated with the typical RBM version which uses binary latent variables. The emergence of the Boltzmann machine (BM) at the core of one of the most interesting approaches to modern machine learning was very much a case of a the field going back to the future: BMs rose to prominence in the early 1980s, but the practical implications associated with their training led to their neglect until families of algorithms were developed for the RBM model with its reintroduction as a product of experts in the late nineties [Hinton, 1999]. The computational intractabilities of Boltzmann machines led to other families of methods, in particular kernel methods such as the support vector machine (SVM), to be considered for the domain of data classification. Almost contemporaneously to the SVM, Gaussian process models were introduced as a fully probabilistic substitute for the multilayer perceptron (MLP). The relationship of standard GPs with single layer neural networks was firstly investigated by Radford Neal, whose PhD thesis (later published as a book [Neal, 1996]) inspired Rasmussen and Williams to consider GPs as a tool for regression, triggering the use of GPs in machine learning. At the time there was still a great deal of interest in the result that a neural network with a single layer and an infinite number of hidden units was a universal approximator [Hornik et al., 1989], but Neal was able to show that in such a limit the model became a Gaussian process with a particular covariance function (the form of the covariance function was later derived by Williams [1998]). Both Neal [1996] and MacKay [1998] pointed out some of the limitations of priors that ensure joint Gaussianity across observations; this has inspired work in moving beyond Gaussian processes, as was outlined in the beginning of this chapter. However, all GP-based approaches considered so far do not lead to a principled way of obtaining truly deep architectures and, to date, the field of deep learning remains mainly associated with older, parametric, hierarchical structures based on neural networks or
134
Deep Learning with Gaussian Processes
RBMs. This chapter introduces deep Gaussian processes as a flexible non-parametric approach for deep learning. The structure of the remainder of this chapter is as follows. Firstly, the remainder of Section 6.1 gradually introduces deep GPs from the mainstream function composition approach to the nested process composition scenario. It additionally highlights the similarities and differences between the discussed lines of work. Section 6.2 is mainly concerned with the development of the variational framework enabling learning and inference in deep GPs. This framework follows a more formal probabilistic definition of deep GPs. Section 6.3 demonstrates the deep GP framework in a variety of toy and real-world data, for supervised and unsupervised learning. Finally, Section 6.4 concludes the discussion on the proposed model and highlights possible future directions of this line of work.
Notation Throughout this chapter variables mainly need to be referenced according to their layer index. For this reason, we temporarily switch to notation which is clearer for these needs; specifically, subscripts are used to specify the layer associated with a variable, e.g. hℓ (or Hℓ in the multivariate case) is the set of hidden variables corresponding to the ℓth layer. Specific elements within a layer are indexed as in the previous chapter, but the subscripts are now turned into superscripts. For example, in (i) the single dimensional case, the scalar hℓ denotes the ith element (one-dimensional (i,:) (j) datapoint) of the vector hℓ ∈ ℜnℓ , and in the multivariate case hℓ and hℓ denote the ith row and jth column respectively of the matrix Hℓ ∈ ℜnℓ ×qℓ .
6.1.1
Function Composition for Deep Learning
Activation functions employed in neural networks are vector valued functions ϕ(·) of an adjustable basis, which are controlled by a parameter matrix U. In a similar way to generalised linear models, the final activation g(x) for a single layer neural network and input x is obtained by linearly weighting the bases using a matrix V: g(x) = V⊤ ϕ(Ux).
(6.1)
Deep neural networks then take the form of a functional composition of the basis functions, g(x) = VL⊤ ϕL (UL gL−1 (. . . U2 g1 (x))), (6.2)
135
6.1 Background
where L denotes the total number of layers and we represent the overall composition with the unindexed notation g(·). We can alternatively re-write the above expression by using equation (6.1) to replace all gℓ (·) terms: g(x) = VL⊤ ϕL (WL−1 ϕL−1 (. . . W2 ϕ1 (U1 x))), where Wℓ is the matrix mapping between each set of basis functions and is typically treated as a parameter to be learned. A serious challenge for deep networks, when trained in a feed-forward manner, is overfitting. As the number of layers and the number of basis functions per layer increases, a very powerful but also highly parametrised representation is formed. The matrix Wℓ has size kℓ × kℓ−1 , where kℓ is the number of basis functions in the ℓth layer. In practice, networks containing sometimes thousands of basis functions can be used, leading to a parameter explosion.
Weight Matrix Factorisation One approach to dealing with the many parameters contained in the matrices Wℓ , is to replace them with a lower rank form. This draws inspiration from the first function composition formulation shown in equation (6.2), but now the low rank decomposition is now made explicit and clear. We select rℓ < kℓ , kℓ−1 so as to obtain: ⊤ Wℓ = Uℓ Vℓ−1 ,
where Uℓ ∈ ℜkℓ ×rℓ and Vℓ−1 ∈ ℜkℓ−1 ×rℓ . Whilst this idea hasn’t yet, to our knowledge, been pursued in the deep neural network community, Denil et al. [2013] have empirically shown that trained neural networks might be well approximated by low rank matrices as evidenced by the ability to predict one set of part of the weight matrix given by another. The approach of “dropout” [Srivastava et al., 2014] is also widely applied to control the complexity of the model implying the models are over parameterised. Substituting the low rank form into the compositional structure for the deep network we have ⊤ g(x) = VL⊤ ϕL (UL VL−1 ϕL−1 (. . . U2 V1⊤ ϕ1 (U1 x))).
We can now identify the following form inside the functional decomposition, fℓ (z) = Vℓ⊤ ϕℓ (Uℓ z)
136
Deep Learning with Gaussian Processes
and once again obtain a functional composition, g(x) = fL (fℓ−1 (. . . f1 (x))).
(6.3)
The standard deep network is recovered when we set rℓ = min(kℓ , kℓ−1 ).
6.1.2
Process Composition
To obtain a deep Gaussian process we consider a nested structure as shown above with equation (6.3). The deep Gaussian process is recovered by keeping rℓ finite and allowing kℓ → ∞ for all layers. Of course, the mappings in the Gaussian process are treated probabilistically and integrated out1 , rather than optimised, so despite the increase in layer size the parameters in the resulting model are many times fewer than those in a standard deep neural network. Further, Duvenaud et al. [2014] have shown that dropout on the hidden layers is already being applied through this form of regularisation. To generalise a Gaussian process to the deep domain, rather than assuming that a data observation, y, is a draw from a noise corrupted Gaussian process prior, we instead make use of a functional composition, y = f1:L + ϵ
(6.4)
= fL (fℓ−1 (. . . f1 (x))) + ϵ. This is the same form as for standard neural networks, shown in equation (6.3), but now each function in the composition, fℓ (·), is a draw from a Gaussian process. However, the overall prior f1:L is no longer a Gaussian process. In the above equation, ϵ represents the noise, and we can introduce Gaussian noise in every layer. In this case, we can collect the noise corrupted function instantiations (corresponding to n data points) into a vector for each layer, so that we get the following recursive definition: hℓ = fℓ (hℓ−1 ) + ϵℓ .
(6.5)
From this recursive definition, we obtain the whole hierarchical construction if we denote y ≜ hL+1 and x ≜ h0 . The corresponding graphical model for a deep Gaussian process is illustrated in Figure 6.1. As can be seen, the generative procedure defined by the function f1:L can be represented in a graphical model as a deep architecture 1
If the mappings are instead fixed, then we obtain a standard (shallow) GP with a hierarchical covariance function, as noted and investigated by Duvenaud et al. [2014].
137
6.1 Background
x
f1 ∼ GP
h1
f2 ∼ GP
h2
f3 ∼ GP
y
Fig. 6.1: A deep Gaussian process with two hidden layers (compact depiction).
where each layer corresponds to a generative procedure associated with a function fℓ . Given equation (6.4), it is clear that this chapter develops a full probabilistic model through process composition. Process composition has the appealing property of retaining the theoretical qualities of the underlying stochastic process (such as Kolmogorov consistency) whilst providing a richer class of process priors. For example, for deep Gaussian processes Duvenaud et al. [2014] have shown that, for particular assumptions of covariance function parameters, the derivatives of functions sampled from the process have a marginal distribution that is heavier tailed than a Gaussian. In contrast, it is known that in a standard Gaussian process the derivatives of functions sampled from the process are jointly Gaussian with the original function. In the next section we compare the properties of deep Gaussian processes with the properties of traditional deep learning methods.
6.1.3
Inference Challenges and Expressiveness
A very popular approach to deep learning is to construct deep belief networks by stacking RBM models. Various approximate inference techniques (such as contrastive divergence) are then used for estimating model parameters. A significant amount of work has then to be done with annealed importance sampling if even the likelihood2 of a data set under the RBM model is to be estimated [Salakhutdinov and Murray, 2008]. When deeper hierarchies are considered, the estimate is only of a lower bound on the data likelihood. By considering sigmoidal activation functions, σ(z) = (1 + exp(−z))−1 , we obtain the conditional probability of a single hidden unit in a deep belief network given its parents as p(y|x) = σ(Ux)y (1 − σ(Ux))(1−y) . The conditional density of the output y depends only on a linear weighted sum of the inputs x. The representational power of a Gaussian process in the same role is significantly greater than that of an RBM. For the GP the corresponding likelihood is 2
Emphasis is used to clarify we are referring to the model likelihood, not the marginal likelihood required in Bayesian model selection.
138
Deep Learning with Gaussian Processes
over a continuous variable, but it is a nonlinear function of the inputs, � p(y|x) = N y|f (x), β −1 . In this case the likelihood is dependent on a mapping function, f (·), rather than a set of intermediate parameters, U. By placing a GP prior we can analytically integrate out the mappings. In the RBM, instead, the model likelihood is estimated and maximized with respect to the parameters, U. For the RBM, marginalizing U is not analytically tractable. Note that the two approaches can be mixed if p(y|x) = σ(f (x))y (1 − σ(f (x))(1−y) , which recovers a GP classification model. Analytic integration is no longer possible though, and a common approach to approximate inference is the expectation propagation algorithm [see e.g. Rasmussen and Williams, 2006]. However, this idea is not further considered in this thesis. Inference in deep models requires marginalization of the stacked input spaces, denoted as {hℓ }Lℓ=1 in equation (6.5). These intermediate spaces are typically treated as latent variables3 , which in the case of the RBM are binary variables. The number of the terms in the sum scales exponentially with the input dimension rendering it intractable for anything but the smallest models. In practice, sampling and, in particular, the contrastive divergence algorithm, are used for training. Similarly, marginalizing the intermediate, latent spaces in the deep GP is analytically intractable; indeed, as was discussed in Section 3.1, despite the simplicity of the Gaussian density its propagation through non-linear mappings is challenging. For this reason, the hierarchical GP-LVM [Lawrence and Moore, 2007], which constituted the first approach to stacking GPs, was defined within a maximum a posteriori (MAP) framework where the latent variables were maximised rather than marginalised out. For this MAP approach to work, however, a strong prior is required on the top level of the hierarchy. Further, MAP learning prohibits model selection because no estimate of the marginal likelihood is available. Most deep algorithms require a large amount of data to perform learning. Fitting such models to smaller data sets and using Bayesian approaches to deal with the complexity seems completely futile when faced with the associated computational intractabilities. However, we know that humans are able to perform inductive reasoning 3
Some of the variables can also be treated as observed, e.g. in the upper most layer of the hierarchy where we might include the data label or inputs for regression.
6.1 Background
139
Fig. 6.2: Samples from a deep GP showing the generation of features. The upper plot shows the successive non-linear warping of a two-dimensional input space. The red circles correspond to specific locations in the input space for which a feature (a “loop”) is created in layer 1. As can be seen, as we traverse the hierarchy towards the right, this feature is maintained in the next layers and is potentially further transformed. The bottom plot is similar as the upper plot, but a linear covariance function is used (equivalent to performing stacked PCA for training given observed data). As can be seen, linear transformations seem nonsensical in this setting, since multiplying an input by two matrices (two linear transformations) is equivalent to multiplying the input with a single combined matrix (one linear transformation).
(equivalent to concept generalization) with only a few examples [Tenenbaum et al., 2006]. This provokes the question as to whether deep structures and the learning of abstract structure can be undertaken in smaller data sets. For smaller data sets, questions of generalization arise: to demonstrate such structures are justified it is useful to have an objective measure of the model’s applicability. This chapter demonstrates the ability of deep Gaussian processes to learn even from small training sets. This property can be attributed to their fully Bayesian nature.
6.1.4
Model Capacity and Regularization in Deep GPs
In the previous sections it was assumed, for simplicity, that all variables are single dimensional. This section will consider the general multi-dimensional case. It will then be possible to provide an analysis with respect to the number and dimensionality of the hidden layers which, jointly, define the model capacity. To start with, we discuss the regularization benefits and tool availability arising from the deep GP Bayesian framework which aims at integrating out the hidden layers. Specifically, we can equip the Gaussian process prior of each layer with an ARD covariance function of the form given in equation (2.7). Similarly to the variational GP-LVM presented in Chapter 3, the ARD weights of this function automatically de-
140
Deep Learning with Gaussian Processes
fine an effective dimensionality for each layer. Further, the MRD method discussed in Chapter 5 can be incorporated to consider multi-view data or to induce conditional independencies between nodes in the hidden layers, thus incorporating potential a priori known structure. Notice that, in this context, the ARD weights w resemble the weight parameters of standard multilayer neural networks. Despite the structural similarity, the role of w is distinct in deep GPs. Firstly, thanks to the Bayesian training their optimisation follows an automatic Occam’s razor, as explained above. Secondly, compared to standard neural network approaches, a deep GP can achieve similar representational capacity per layer by using many fewer parameters. This is thanks to the non-parametric, continuous-valued and non-linear properties of the GP backbone. It has been argued that deep networks have more representational power compared to “shallow” ones. Intuitive illustrations are given in figures 6.3 and 6.6 which show that a deep architecture is able to discover long range dependencies in data. The same effect from a different viewpoint is also demonstrated in figure 6.12, which shows that the deep structure is able to decompose the data into a hierarchy of features with increasing levels of abstraction. This has been shown to facilitate learning [Bengio et al., 2012]. By generalising, this provokes the question as to whether considering more hidden layers will always result in a better model (ignoring, for the moment, overfitting or parameter explosion problems). Duvenaud et al. [2014] argue that an extreme expression of this effect can result in a pathology and, therefore, very deep networks are not always preferable. Specifically, it is shown that a deep network with a very large number of hidden layers tends to focus all of its representational power on a very small set of input directions, effectively becoming invariant in the rest of the directions. Intuitively, this happens because the repetitive warping of the input through a very large number of successive layers tends to force the whole input domain to be associated with function values that are tightly clustered around a few centers. However, the effect of creating this kind of “knots” in the space of learned features is much more improbable in high dimensions and it only occurs for certain parameter values. For the Gaussian processes case, the simulations in [Duvenaud et al., 2014] reveal that the “pathology” does not arise in the kind of architectures employed in practice. In particular, it is shown that, as long as relatively wide networks are used (in terms of dimensionality), problems could arise only in structures with more than several hundreds of layers. Further, equipping a deep GP with a Bayesian training procedure is expected to guard, to some degree, against this degeneracy, in the sense that the model evidence will reject unnecessarily complex model structures. Since the saturation of the hidden units is easily avoided in practical settings, we can actually interpret
6.1 Background
141
the above analysis as an insight to an advantageous aspect of deep GPs. Specifically, since the derivatives of functions sampled from the process have a marginal distribution that is heavier tailed than a Gaussian (for particular assumptions of covariance function parameters), deep GPs constitute a richer prior compared to a GP. Further, the above discussion reveals the mechanism with which useful features are learned in each layer. Consider the case where we sample from a deep GP layer by layer. When a feature is created in layer ℓ (e.g. a “knot”) then this feature is maintained in layers ℓ′ > ℓ. This is demonstrated in figure 6.3 and also in figure 6.2. During training, this mechanism is used so that each layer creates a new transformation of the features discovered for the previous layers, thereby learning increasingly abstract representations. As a final note, notice that the computational complexity of a deep GP only grows linearly with the number of layers and hidden dimensions, and it remains almost unaffected by the number of output dimensions p. This allows us to model very high dimensional data.
6.1.5
Unsupervised Deep Learning
Although deep learning has achieved remarkable results in supervised learning tasks (e.g. image classification), deep unsupervised learning seems to currently face more challenges. The main problem behind these challenges is that a single objective function for unsupervised learning cannot be easily derived for the traditional deep learning structures. For example, deep neural networks rely on alternating between forward and backward passes, making it difficult to use this regime without supervision on the top layer; stacked RBMs constitute undirected graphical models for which even the likelihood of the data is not easily computed. However, recent research towards bypassing the above problems has produced promising results. This section will outline only some of the most commonly used ideas for performing deep unsupervised learning. One successful strand of work in unsupervised deep learning, comes from the work of Hinton et al. [2006] which is now considered as a breakthrough. In this work, the authors suggest a greedy, layer-wise pre-training of deep belief networks without the presence of data labels. This idea allows to perform unsupervised learning at one level at a time. This produces for each layer a new transformation of the features learned in the previous ones. Lee et al. [2008] further extend deep belief networks in the sparse setting, as an alternative to hierarchical sparse coding. An idea similar to layer-wise pre-training was later studied by Bengio et al. [2007] who
142
Deep Learning with Gaussian Processes
also studied it in the context of autoencoders (see also [Hinton and Salakhutdinov, 2006]). An autoencoder is a particular type of deep network which achieves unsupervised learning by defining a supervised structure where the inputs are the same as the outputs. The original proposal of the above mentioned greedy, layer-wise pretraining trick was to use it only as an initialisation step. After this step was completed, one can fine tune the parameters of all layers together. To achieve this, Hinton and Salakhutdinov [2006] suggest proceeding with further unsupervised learning using the wake-sleep algorithm [Hinton et al., 1995]; or one can proceed with supervised learning, by adding an extra layer which contains observed inputs and performing gradient descent to optimise the supervised training criterion [Bengio et al., 2007]. Coming back to the discussion about autoencoders, there currently exist multiple variants. These include: the sparse autoencoder [see e.g. Ranzato et al., 2008], the denoising autoencoder [Vincent et al., 2008] and the contracive autoencoders [Rifai et al., 2011]. More recently, [Kingma and Welling, 2013] have proposed the autoencoding variational Bayes, a stochastic variational inference algorithm to learn autoencoders in directed probabilistic models with continuous variables. This approach employs a recognition model to approximate the intractable posterior, in a similar manner to Rezende et al. [2014] who interpret their recognition model as a stochastic encoder in the denoising autoencoder setting. The deep Gaussian processes developed in this thesis aims at solving unsupervised learning tasks in a fully Bayesian, non-parametric fashion and without the need to rely on layer-wise training or on creating autoencoder structures. The deep GP can be trained in an unsupervised manner by simply writing down the analytic approximation to the objective function and performing gradient descent. Of course, both the layerwise training and autoencoder techniques are optionally available to use in the deep GP framework. In fact, a layer-wise training seems to be a good initialisation option, and an autoencoder construction can potentially lead to better performance in certain tasks, as discussed in Section 6.2.5.
6.2
Deep Gaussian Processes
This section describes the deep GP framework in more detail, initially focusing on unsupervised learning. Section 6.2.1 provides a more formal probabilistic definition. Subsequently, the variational training procedure for training and inference is described. Specifically, Section 6.2.2 is concerned with the variational inference part used within each layer for marginalising out the latent mappings; then, Section 6.2.3
6.2 Deep Gaussian Processes
143
is concerned with the next variational inference stage, which enables marginalisation of variables that are “non-local”, namely inducing outputs (which can act as global parameters in a special case) and hidden variables (each set being associated with two layers). Finally, the supervised learning case is separately discussed in Section 6.2.4.
6.2.1
Probabilistic Definition
The deep Gaussian process class of probabilistic models is now formally described. To do so, single-dimensional variables will again be considered, although it is underlined that this is only for simplicity and without loss of generality. Further, the analysis is made by firstly considering the unsupervised learning scenario, where a hierarchy of latent spaces is assumed to generate observed outputs. The deep GP consists of a cascade of L hidden layers of latent variables, {hℓ }Lℓ=1 with the observed outputs being placed in the leaves of the hierarchy. An intermediate node hℓ ∈ ℜn associated with layer ℓ constitutes the output of that layer and acts as an input for the generative procedure of the subsequent layer, ℓ + 1. Gaussian processes govern the mappings between the layers. Each mapping corresponds to a separate GP, having covariance function kℓ and hyperparameters θℓ . Further, every set of latent variables hℓ is obtained from the functional output of the previous layer with the addition of Gaussian noise ϵℓ ∼ N (0, βℓ−1 I). Therefore, a single layer of the deep GP is effectively a GP-LVM, just as a single layer of a regular deep model is typically an RBM. The joint distribution of a deep GP model with L hidden layers can be written as: p(y, {hℓ }Lℓ=1 ) = p(y|hL )p(hL |hL−1 ) · · · p(h2 |h1 )p(h1 ),
(6.6)
where p(h1 ) = N (h1 |0, I). As for the conditional probabilities, they can be expanded as: Z p(hℓ |hℓ−1 ) = p(hℓ |fℓ )p(fℓ |hℓ−1 )dfℓ , (6.7) where the first and second factor inside the integral are given in equations (2.4) and (2.2) respectively, with the obvious substitution in the variable names. The observations are included in this recursive formulation by considering the special notation hL+1 ≜ y. Figure 6.3 shows examples of samples drawn from the deep GP architecture, where the top layer was chosen deterministically. This figure makes evident that deep GPs constitute much more powerful priors compared to traditional GPs (observe, for example, the long range correlations in the samples). However, although
144
Deep Learning with Gaussian Processes f1 (x) 3
2 1 0 1 2 0.0 3 f2 (f1 ) 2 1 0 1 2 3 0.0 3 f3 (f2 ) 2 1 0 1 2 0.0
0.2
0.4
0.6
0.8
1.0
0.2
0.4
0.6
0.8
1.0
0.2
0.4
0.6
0.8
x
1.0
Fig. 6.3: Samples from a deep Gaussian process with three dimensional hidden and output nodes. A linear input x (not depicted) was propagated through two hidden layers (top and middle plot) to the output layer (bottom plot).
sampling from a deep GP is easy, the real challenge is training it. Indeed, Lawrence and Moore [2007] showed that the straightforward (GP-LVM style) MAP optimisation for {hl }Ll=1 is challenging. Intuitively, the problem arises from the fact that MAP optimisation turns all hidden nodes into extra model parameters. This can create a huge regularization problem even for relatively “shallow” architectures, as was discussed in Section 6.1.4. Instead, this thesis aims to marginalise out all hidden layers in a Bayesian paradigm. The regularization benefits of such an approach are two fold: firstly, the number of parameters is drastically reduced because each additional layer mainly contributes with variational rather than model parameters. Secondly, we are able to automatically infer the structure of the deep network by making use of an approximation to the model evidence and by using the automatic relevance determination (ARD) techniques discussed in section 6.1.4. However, the nonlinearities introduced by the GP covariance functions make the Bayesian treatment of this model challenging. To demonstrate this, consider a deep GP with two hidden layers. Then, the marginal likelihood can be written as: �Z
Z p(y) =
p(y|h2 )
� p(h2 |h1 )p(h1 )dh1 dh2 .
The nested integral can be written according to equation (6.7) as: Z p(h2 ) =
p(h2 |f2 )p(f2 |h1 )p(h1 )dh1 df2 = ⟨p(h2 |h1 )⟩p(h1 )
(6.8)
and is intractable, because the density p(h1 ) cannot be propagated through the function p(f2 |h1 ) which is constructed by a nonlinear covariance function k1 (h1 , h1 ).
6.2 Deep Gaussian Processes
145
A similar situation arises in every layer when deeper architectures are employed. That is, if there was an additional layer we would have to compute the expectation ⟨p(h3 |h2 )⟩p˜(h2 ) , where p˜(h2 ) = ⟨p(h2 |h1 )⟩p(h1 ) is coming from equation (6.8). We can, thus, formalise the problem by writing the recursive definition p˜(hℓ ) = ⟨p(hℓ |hℓ−1 )⟩p˜(hℓ−1 ) of the densities required for the calculation of the marginal likelihood and observing that all required expectations are intractable, as demonstrated for the two hidden layer architecture above. In the next section we develop variational methodologies which solve this intractability.
6.2.2
Variational Inference in Deep GPs Within a Layer
Consider the intractable integral of equation (6.8). Similarly to the variational GPLVM discussed in Chapter 3, we seek to obtain tractability by first augmenting the probability space of every layer with auxiliary variables (xu )ℓ and uℓ . The incorporation of auxiliary variables expands every factor p(hℓ |hℓ−1 ) of the joint distribution of equation (6.6)h into a quantity p(hiℓ |hℓ−1 , uℓ ) which depends on additional (1) (2) (m ) function values uℓ = uℓ , uℓ , · · · , uℓ ℓ evaluated at pseudo-inputs (xu )ℓ−1 = h i (1) (2) (mℓ ) (xu )ℓ−1 , (xu )ℓ−1 , · · · , (xu )ℓ−1 , where ℓ = 2, · · · , L + 1. Figure 6.4 demonstrates this construction. The inducing inputs xu will be omitted from our expressions for the rest of the chapter, since they always appear in the conditioning set of any probability involving u. Throughout this chapter we will assume that the number of inducing points mℓ is fixed for every layer, i.e. mℓ = m, ∀ℓ, although this simplification is just for clarity and not actually used in our implementation. Similarly to equation (6.7), we can now write: Z p(hℓ |uℓ , hℓ−1 ) = p(hℓ |fℓ )p(fℓ |uℓ , hℓ−1 )dfℓ , � where p(hℓ |fℓ ) = N hℓ |fℓ , βℓ−1 I . As in equations (2.15), (2.16), (2.17), we have: � � eℓ , p(fℓ |uℓ , hℓ−1 ) = N fℓ |aℓ , K
(6.9)
aℓ = Kfℓ−1 uℓ−1 K−1 uℓ−1 uℓ−1 uℓ e ℓ = Kf f − Kf u K−1 K uℓ−1 uℓ−1 Kuℓ−1 fℓ−1 ℓ−1 ℓ−1 ℓ−1 ℓ−1
(6.10)
where:
146
Deep Learning with Gaussian Processes
x(i)
f1 (i)
(xu )1
(i)
(xu )1
h1
h1
f2
f2 (xu )2
u2
(xu )2
(i)
h2
u2
f3
f3 u3
(i)
h2
u3
y (i)
y (i) i = 1...n
i = 1...n (a)
(b)
Fig. 6.4: A graphical model representation of: (a) the unsupervised and (b) the supervised deep GP structure with inducing variables and L = 2 hidden layers. Nodes arranged horizontally form part of the same layer.
The expanded with inducing points probability p(fℓ |uℓ , hℓ−1 ) of equation (6.9) is still problematic; we are still unable to propagate a density of hℓ−1 coming from a subsequent layer. However, we can employ the same trick as in variational GPLVM, where a preliminary (in the sense that it still includes inducing outputs) variational bound is further bounded after marginalising the inducing outputs, giving us a tractable approximation. Specifically, we can obtain a preliminary variational bound on the logarithm of the augmented form of equation (6.6) as follows: log p(y, {hℓ }Lℓ=1 |{uℓ }L+1 ℓ=2 ) = log p(y|hL , uL+1 ) +
L X
log p(hℓ |hℓ−1 , uℓ ) + log p(h1 )
ℓ=2
≥ L = log p(h1 ) +
L+1 X
Lℓ ,
(6.11)
ℓ=2
where LL+1 lower bounds log p(y|hL , uL+1 ) while for the rest of the terms we have Lℓ ≤ log p(hℓ |uℓ , hℓ−1 ). By following the methodology described in Section 2.3.1, each term Lℓ is found analytically as: � βℓ � � eℓ . Lℓ = log N hℓ |aℓ , βℓ−1 I − tr K 2
(6.12)
147
6.2 Deep Gaussian Processes
Given the inducing function values u, the latent function values f are no longer coupled, meaning that the variatinal bound of equation (6.11) is factorised across datapoints. For our so far derivations single dimensional data were assumed, but if more dimensions are considered, then the bound also factorises across dimensions (and layers). Therefore, this bound is fully factorised. This is further illustrated in Appendix C, which also includes an analytic expression for L. The dependencies of this expression are represented in figure 6.4. Finally, the above formulation allows us to further marginalise out the latent spaces h and inducing outputs u from equation (6.11). This is explained in detail in the next section.
6.2.3
Variational Inference in Deep GPs Across Layers
In the previous section we used the variational sparse GP trick to integrate out the latent mappings fℓ within each layer, thus obtaining the preliminary lower bound of equation (6.11). In this section we begin with that bound and aim at further integrating out the latent variables h across layers, as well as the inducing function values u. The variational methodology described here closely resembles the one used in Chapter 3, and follows from the fact that we view the deep GP as a stack of variational GPLVMs. Our aim is to approximate the logarithm of the marginal likelihood: Z log p(y) = log
p(y, {hℓ }|{uℓ })
L+1 Y
p(uℓ )d{hℓ }d{uℓ },
ℓ=2
where we denote {hℓ } = {hℓ }Lℓ=1 and similarly {uℓ } = {uℓ }L+1 ℓ=2 . To compute the above integral we will introduce a variational distribution Q=
L Y
q(uℓ+1 )q(hℓ ).
(6.13)
ℓ=1
Notice that factorising the variational distribution q({hℓ }Lℓ=1 ) across layers is not the optimal choice, but only a mean-field approximation. The factorisation for the variational distribution on u is optimal, however, as is clear from the graphical model in figure 6.4. Given our choice for the variational distribution, we can make use of
148
Deep Learning with Gaussian Processes
Jensen’s inequality, so as to get a bound F ≤ log p(y), with: Z F=
p(y, {hℓ }|{uℓ }) Q log Q
QL+1 ℓ=2
p(uℓ )
d{hℓ }d{uℓ }
L+1 X
= ⟨log p(y, {hℓ }|{uℓ })⟩Q − KL (q(uℓ ) ∥ p(uℓ )) + | {z } ℓ=2
L X
≥⟨L⟩Q
H (q(hℓ ))
(6.14)
ℓ=1
where H (·) denotes the entropy of a distribution and we made use of inequality (6.11) for L. Since all of the p(·) distributions above are Gaussian, we can restrict the class of variational distributions q(hℓ ) and q(uℓ ) to also be Gaussian, so that all of the terms in equation (6.14) are tractable due to conjugacy and due to easy calculation of the entropies. So we rewrite equation (6.13) with the specific form: Q = q({hℓ })q({uℓ }) = =
L Y ℓ=1 L Y
(N (hℓ |mℓ , Sℓ ) N (uℓ+1 |µℓ+1 , Σℓ+1 )) N (uℓ+1 |µℓ+1 , Σℓ+1 )
n Y
�
(i)
(i)
(i)
N hℓ |mℓ , sℓ
�
! .
i=1
ℓ=1
(6.15) If qℓ > 1, variational distribution takes the fully factorised form: Q = q({Hℓ })q({Uℓ }) =
Notice that
(i) Sℓ
L Y
qℓ+1
ℓ=1
j=1
Y
N
�
(j) (j) (j) uℓ+1 |µℓ+1 , Σℓ+1
n �Y
N
�
(i,:) (i,:) (i) hℓ |mℓ , Sℓ
�
!
i=1
are diagonal qℓ × qℓ matrices whereas
(j) Σℓ
(6.16) are full mℓ × mℓ matrices.
By using the above form for Q and equation (6.11), we can now derive the first term of the bound shown in equation (6.14): ⟨L⟩Q = ⟨log p(h1 )⟩q(h1 ) +
L+1 X
⟨Lℓ ⟩q(hℓ−1 )q(hℓ )q(uℓ ) ,
(6.17)
ℓ=2
where we also identified the dependencies in the variables to take the needed expectations. The first expectation above can be combined with the entropy term H(q(h1 )) of equation (6.14) to form a KL term. Further, now that we have identified the relevant expectations from the whole Q, the sum appearing in equation (6.17) can be easily computed with the aid of equation (6.12). Overall, the final form of the bound
.
149
6.2 Deep Gaussian Processes F ≤ log p(y) is written as: L+1 � X
�� F= log N hℓ |aℓ , βℓ−1 I q(h
� βℓ D � e �E tr Kℓ − ℓ−1 )q(hℓ )q(uℓ ) 2 q(hℓ−1 )
ℓ=2
− KL (q(h1 ) ∥ p(h1 )) −
L+1 X
KL (q(uℓ ) ∥ p(uℓ )) +
ℓ=2
L X
(6.18) H (q(hℓ )) ,
ℓ=2
where we recall that hL+1 ≜ y. All the terms of the above bound are tractable. Specifically, the KL and entropy terms are straightforward. As for the first line of the formula, it can be found by expanding the Gaussian forms; then, the expectations with respect to the q(h) terms turn the covariance matrices into {ξ, Ψ, Φ} statistics (see equation 3.15) for every layer. Therefore, the tractability of equation (6.18) depends on the same conditions as for the variational GP-LVM, that is, the covariance functions selected should be feasibly convoluted with the Gaussian density q(h). More details on the derivation of the above lower bound and a complete form which shows its factorisation with respect to data points and features can be found in Appendix C. A gradient based optimisation routine can be employed to maximise the final form of the variational lower bound with respect to: model parameters: {βℓ , θf ;ℓ }L+1 ℓ=2 and n oL (i) variational parameters: (xu )ℓ , mℓ , {diag(Sℓ ), µℓ+1 , Σℓ+1 }ni=1 . ℓ=1
Collapsed Bound Versus Big Data Extensions As with the variational GP-LVM, out of the two variational distributions appearing in a layer, the one can be collapsed with respect to the other. To describe this procedure, we will again consider the general case where all observed and hidden spaces are multivariate. Firstly, instead of taking the expectation with respect to q(Uℓ ) for every term Lℓ , we collect from the bound all terms (per layer) that involve q(Uℓ ); we can then determine the optimal form of q(Uℓ ), i.e. the form it would take (as a function of q(Hℓ )) if a stationary point was reached in the optimisation. Then, one can replace q(Uℓ ) with its optimal form in the approximation and obtain a tighter bound. In other words, for every layer we repeat exactly the same procedure that one has to follow for the variational GP-LVM case, which is described in detail in Appendix B.1.1.
150
Deep Learning with Gaussian Processes
Therefore, we can write the collapsed variational bound for the deep GP as: F=
p X j=1
(j) FˆL+1 +
qℓ L X X ℓ=2
! (j) Fˆℓ + H (q(Hℓ ))
− KL (q(H1 ) ∥ p(H1 )) .
j=1
(j) (j) Here, the terms FˆL+1 are given directly by equation (3.25). As for the terms Fˆℓ , ℓ = 2, . . . , L, they are again given by equation (3.25) but the term YY⊤ appearing there is now substituted with the term:
� Hℓ−1 H⊤ ℓ−1 q(H
ℓ−1 )
=
qℓ−1 h X
(j) (j) µℓ−1 (µℓ−1 )⊤
+
(j) Sℓ−1
i
.
j=1
The collapsed variational bound no longer depends on the variational distributions �n oqℓ �L+1 (j) (j) q(U), so that the many parameters µℓ , Σℓ disappear. However, this j=1
ℓ=2
(j) marginalisation re-introduces the coupling in the data, since the involved terms, Fˆℓ , do not factorise in n, as can be seen in equation (3.25). The implementation developed for this thesis follows the collapsed variational bound approach; for smaller training sets this is a better approach, because of the tighter bound and the reduced size of the parameters. For larger training sets, there are two promising extensions that are left as future work. Firstly, we can use the collapsed variational bound and incorporate the parallel training algorithm of Gal et al. [2014]; Dai et al. [2014]. Secondly, we can use the factorised, non-collapsed version of the variational bound and incorporate the stochastic variational inference framework of Hensman et al. [2013a, 2014a].
6.2.4
Supervised Learning
One advantage of being able to write down the full joint probability of a deep model (rather than stacking individual models) is that the supervised and unsupervised case are naturally handled within the same generative framework. In the previous sections, we demonstrated the variational framework for the unsupervised learning scenario. However, the supervised version, depicted graphically in figure 6.4(b), can be obtained by following a very similar methodology. Specifically, the joint distribution is now conditioned on the observed inputs x, placed on the top layer of the graphical model. These observed variables now appear in the conditioning set of all probabilities involving h1 , i.e. p(h1 ) is now written as p(h1 |x). Similarly to the rest of the layers, we can consider a function f1 with a GP prior that maps from x to h1 . However, since x is deterministic, propagating it through the non-linear mapping f1
151
6.2 Deep Gaussian Processes
is feasible, so that we can analytically compute the Gaussian p(h1 |x). Therefore, the data augmentation trick is not required here and no inducing variables need to be introduced for the top warping layer. Consequently, the derivations presented in the previous chapter also hold for the supervised learning case, after introducing the conditioning on x where appropriate. Therefore, although the supervised deep GP uses one more warping function to accommodate the observed inputs, by convention we will not refer to the top warping layer as a hidden layer. That is, both deep GPs illustrated in figures 6.4a and 6.4b are said to have 2 hidden layers. Given our so far mathematical description for deep GPs, the only difference between the supervised and the unsupervised case comes from the variational distribution considered for h1 . Specifically, we explicitly model correlations in the input space through the approximate posterior q(h1 ); this is achieved by following the formulation discussed in Section 3.3.6 for the variational GP-LVM. In other words, for the supervised learning scenario the full variational distribution, Q, would be as in equation (6.16) but the latent space distribution would factorise as: q({Hℓ }) =
q1 Y
N
�
(j) (j) (j) h1 |m1 , S1
j=1
n L Y �Y
� � (i,:) (i,:) (i) N hℓ |mℓ , Sℓ ,
ℓ=2 i=1
(j)
where S1 is a full n × n matrix.
6.2.5
Autoencoders
An autoencoder is a hierarchical model comprising an encoder, mapping the observation to the latent space, and a decoder, mapping the latent to the observation space. Deep autoencoders can also be formed. In the context of deep GPs, all mappings are taken to be non-parametric with GP priors. In this setting, to form an autoencoder we just need to consider a supervised deep GP where the top level inputs are the same as the outputs. In this way, the latent space posterior q(X1 ) of the top layer is correlated (i,:) across points x1 and through a prior p(X1 |Y). A second way to obtain a deep GP autoencoder is to make use of the variational back-constraints developed in Section 4.2.1. Rather than coupling the top layer posterior, we define a factorised prior and variational distribution but constrain each (i,:) q(x1 ) to be a Gaussian centered around y(i,:) . This requires q1 = p. Bengio et al. [2007] showed that, in terms of modelling, even choosing q1 > p is sensible. Con(i,:) cerning the variances of q(x1 ), there are three ways in which they can be set. Firstly, we can set them to ϵ → 0. However, this strong constraint was found to make the model prone to “switching off” the top layer by explaining it with noise. Secondly,
152
Deep Learning with Gaussian Processes
the variances can be freely optimised. However, this can be problematic when p (and, hence, q1 ) is large. Finally, the variances can be fixed to a small value. This approach was found to be the best. Intuitively, it allows for flexibility in the encoder and reminds the denoising autoencoder trick, where the top layer inputs constitute a noisy version of the true outputs. Since our framework allows for propagating variances, the noise is here taken to be Gaussian, rather than considering ad-hoc corruptions of the input. There are two main motivations to study autoencoders. Firstly, because the topological constraint applied on the latent space can result in richer latent representations, as was also observed by Lawrence and Quiñonero Candela [2006]. Secondly, because during test time, given a test point y∗ we can find directly and almost immediately its (approximate) latent representation q(x∗ ) using the encoder. This comes in contrast to the unsupervised learning scenario where the latent representation is found after optimising a new variational bound. This optimisation not only requires a sensible initialisation to kick-off, but is also prone to local minima. Therefore, one advantage of directly using the encoder is that it is potentially more robust. Another advantage is that it is much faster during test time, making it a very useful approach in real-time applications as well as big data or stochastic optimisation scenarios.
6.3
Experiments
This section evaluates the approach in toy and real data for supervised and unsupervised learning. The main goals with this demonstration are the following: firstly, to demonstrate the representation learning ability of the method, which can model observed data by decomposing them into a hierarchy of meaningful features. To this end, this section shows results from unsupervised learning experiments, as well as results obtained through a generative autoencoder reformulation that is derived from the developed framework. Secondly, we wish to show that the Bayesian training paradigm allows for automatically finding an effective structure for the deep architecture, by learning conditional independencies among the nodes and by switching off irrelevant nodes. Thirdly, this section investigates the effectiveness of deep Gaussian processes as a means of obtaining better discrimination in the latent space and smaller error in regression tasks.
6.3 Experiments
6.3.1
153
Toy data
Step function We first attempt to fit a (supervised) deep GP in a simulated step function [Rasmussen and Williams, 2006], following the experimental setting of Hensman and Lawrence [2014]; Calandra et al. [2014]. n = 40 equidistant training inputs {x(i,:) }ni=1 were generated in the interval [0, 1]. As for the outputs, we set y (i,:) = 1 if x(i,:) < 0.5 and 0 otherwise, plus the addition of Gaussian noise with standard deviation 0.02. Therefore, the output space is very “flat” but broken by a big discontinuity (step), thus making the application of a standard GP very challenging. In contrast, a deep GP as a generative model is able to capture this extreme non-stationarity and bimodality by making use of the available intermediate layers that gradually “push” the points in the two extrema. The results presented below confirm this, and they are very similar to those of Hensman and Lawrence [2014] who used a deep GP variant with nested variational compression. Indeed, figure 6.5 shows 300 sample paths from the posterior obtained by a standard GP with exponentiated quadratic cov. function (figure 6.5a) and a deep GP with one (figure 6.5b) and three (figure 6.5c) hidden layers. Each of the paths corresponds to the discretization of the interval [−1, 2] in 500 points. The figure demonstrates how even a 1 hidden layer deep GP is able to easily operate in a regime which seems bimodal. A deeper architecture (figure 6.5c) fits in this regime even better, with fewer samples falling between the two extrema. It is interesting to examine the locations of these samples: they seem to cover uniformly and very sparsely the area between the “modes”. Further, this kind of samples are only obtained away from the interval [0, 1], signifying that a “jump” is expected to happen (although with extremely low probability) in regions away from the data. On the other hand, away from the data the standard GP produces many samples corresponding to y values that are too far form the training points. Furthermore, the GP is even forced to underfit the data; there are no samples falling in the region close to the “jump” even if two training points (one up and one down) exist there while, at the same time, the variance around the training data is too large. To confirm the above intuitions, as well as to draw further conclusions, in figure 6.6 we plot whole sample paths from the deep and the standard GP. For the deep GP, figure 6.6a shows the samples’ successive warping through the deep hierarchy, which gradually “pushes” them towards the bimodal regime. As can be seen, the samples (especially in the middle layers) are smooth, and are probabilistically assigned to one of the two modes. Jumps can occur but are rare, perhaps because only
154
Deep Learning with Gaussian Processes y
|
|
|
|
|
|
|
|
|
|
|
|
|
|
|
|
|
|
|
|
|
y
y
x Fig. 6.5: Samples drawn from the posterior of a standard GP (top), a deep GP with 1 hidden layer (middle) and a deep GP with three hidden layers (bottom). As in [Hensman and Lawrence, 2014], for better visualisation the sampled points are drawn as small, red semitransparent squares, whereas the training points are plotted as black opaque x’s.
one jump exists in the training data. The interpolation suggests that the deep GP interprets the differences of the points within each cluster mostly as noise, which matches the actual toy data generation. Finally, figure 6.7 also depicts sample paths, but there each plot shows the sample output signal in every layer versus its corresponding input signal – in contrast to figure 6.6 where the x−axis is the input x. As can be seen in figure 6.7, each layer’s warping function is learned to have a sigmoidal shape, so as to successively “push” the top layer’s samples into the bi-modal regime.
155
6.3 Experiments
−1
−0.5
0
0.5
1
1.5
2
−1
−0.5
0
0.5
1
1.5
2
1.5
1
0.5
0
−1
−0.5
0
0.5
1
1.5
2
−0.5 −1
−0.5
0
0.5
1
1.5
2
1
1.5
2
(a) Deep GP with three hidden plus one warping layer. 1.5 1 0.5 0 −0.5 −1 −1
−0.5
0
0.5
(b) Standard GP
Fig. 6.6: (a) Successive warping of sample paths drawn from a deep GP, gradually “pushing” them towards a bimodal regime. (b) Sample paths drawn from a standard GP. In this figure, each sample is drawn versus the initial input x. Instead, figure 6.7 shows a plot of each layer’s output signal versus its input signal.
156
Deep Learning with Gaussian Processes
1
1
0
0 −1
−1 −1
0
1
2
−1
0
1
2
2 1 0 −1 −1
2
2
2
0
0
0
−2
−1
0
−2
1
−1
0
−2
1
2
2
2
0
0
0
−2 −2
−2 −1
0
1
2
−2
−1
0
1
2
1
1
0.5
0.5
0.5
0 −2
−1
0
1
2
−1
−2 −2
1
0
0
1
0
−1
2
1
0
2
1
2
0 −2
−1
0
1
2
−2
−1
0
1
2
Fig. 6.7: Plotting the input versus the output sample signals of every layer in the deep GP. This reveals sigmoidal warping functions which successively “push” the top layer’s samples into the bi-modal regime. In the axis labels, the subscript denotes the sample number and the subscript denotes the layer number.
Toy Regression Problem To quantify the performance of the model in supervised learning, a toy regression problem was used for testing. For this simple example a toy data set was created by stacking two Gaussian processes as follows: the first Gaussian process employed a covariance function which was the sum of a linear and an exponentiated quadratic kernel and received as input an equally spaced vector of 120 points. 1-dimensional samples were generated from the first GP and used them as input for the second GP, which employed a exponentiated quadratic kernel. Finally, 10-dimensional samples were generated with the second GP, thus overall simulating a warped process. The final data set was created by simply ignoring the intermediate layer (the samples from the first GP) and presenting to the tested methods only the continuous equally spaced input given to the first GP and the output of the second GP. To make the data set more challenging, only 25 datapoints were randomly selected for the training set and the rest were left for the test set. Figure 6.8 nicely illustrates the effects of sampling through two GP models, nonstationarity and long range dependencies across the input space become prevalent. A data set of this form would be challenging for traditional approaches because of
157
6.3 Experiments
4
x
3.5
MSE
f1 (x)
GP deepGP
3
f2 (f1 )
2.5 2 1.5
experiment #
x 1
(a)
1
2
3
4
5
6
7
8
9
10
(b)
Fig. 6.8: Figure (a) shows the toy data created for the regression experiment. The top plot shows the (hidden) warping function and bottom plot shows the final (observed) output. Figure (b) shows the results obtained over each experiment repetition.
these long range dependencies, similarly to the above step function demonstration. Another way of thinking of data like this is as a nonlinear warping of the input space to the GP. Because this type of deep GP only contains one hidden layer, it is identical to the the dynamical variational GP-LVM [Damianou et al., 2011]. With the deep GP models described in this chapter the aim is to provide a more complex deep hierarchy, but still learn the underlying representation correctly. To this end, a standard GP (1 layer less than the actual process that generated the data) and a deep GP with two hidden layers (1 layer more than the actual generating process) were applied. The experiment was repeated 10 times, each time obtaining different samples from the simulated warped process and different random training splits. The results show that the deep GP predicted better the unseen data, as can be seen in figure 6.8(b). The results, therefore, suggest that the deep model can at the same time be flexible enough to model difficult data as well as robust, when modelling data that is less complex than that representable by the hierarchy. It can be presumed that these characteristics are due to the Bayesian learning approach that deals with capacity control automatically.
Toy Manifold Learning Problem As a final demonstration on toy data, a hierarchy of signals was created by sampling from a three-level stack of GPs. Figure 6.9 (a) depicts the true hierarchy: from the top latent layer two intermediate latent signals are generated. These, in turn, together
158
Deep Learning with Gaussian Processes
(a) Real data.
(b) Deep GP reconstruction.
(c) Stacked Isomap reconstruction.
(d) Stacked PCA reconstruction.
Fig. 6.9: Attempts to reconstruct the real data (fig. (a)) with our model (b), stacked Isomap (c) and stacked PCA (d). Our model can also find the correct dimensionalities automatically.
generate 10-dimensional observations (not depicted) through sampling of another GP. These observations are then used to train the following models: a deep GP, a simple stacked Isomap [Tenenbaum et al., 2000] and a stacked PCA method, the results of which are shown in figures 6.9 (b, c, d) respectively. From these models, only the deep GP marginalises the latent spaces and, in contrast to the other two, it is not given any information about the dimensionality of each true signal in the hierarchy; instead, this is learned automatically through ARD. As can be seen in figure 6.9, the deep GP finds the correct dimensionality for each hidden layer, but it also discovers latent signals which are closer to the real ones. This result is encouraging, as it indicates that the model can recover the ground truth when samples from it are taken, and gives confidence in the variational learning procedure.
6.3 Experiments
6.3.2
159
Unsupervised Learning
USPS Digits For the first experiment in unsupervised learning we demonstrate the ability of our model to learn latent features of increasing abstraction and we demonstrate the usefulness of an analytic bound on the model evidence as a means of evaluating the quality of the model fit for different choices of the overall depth of the hierarchy. Many deep learning approaches are applied to large digit data sets such as MNIST. Given the Bayesian formulation of our model, our specific intention is to explore the utility of deep hierarchies when the digit data set is small. We subsampled a data set consisting of 50 examples for each of the digits {0, 1, 6} taken from the USPS handwritten digit database [Hull, 1994]. Each digit is represented as an image in 16 × 16 pixels. We experimented with deep GP models of depth ranging from 1 (equivalent to Bayesian GP-LVM) to 5 hidden layers and evaluated each model by measuring the nearest neighbour error in the latent features discovered in each hierarchy. We found that the quality of the model in terms of nearest neighbour errors increased as we added layers. Indeed, the single-layer model made 5 mistakes even though it automatically decided to use 10 latent dimensions and the quality of the trained models was increasing with the number of hidden layers. Finally, only one point had a nearest neighbour of a different class in the 4−dimensional top level’s feature space of a model with depth 5. A 2D projection of this space is plotted in figure 6.11. The ARD weights for this model are depicted in figure 6.10. Deeper models were also tried, but numerical instabilities arose because of the large n/L ratio. Therefore, the experiments with even deeper GPs were more ad-hoc and very careful initialisation had to be provided. Deep GPs with more than 5 layers tended to switch off the extra layers by inflating the noise parameter βℓ . Our final goal is to demonstrate that, as we rise in the hierarchy, features of increasing abstraction are accounted for. To this end, we generated outputs by sampling from each hidden layer. The samples are shown in figure 6.12. There, it can be seen that the lower levels encode local features whereas the higher ones encode more abstract information.
Motion Capture Data Here it is shown that deep GPs can not only learn meaningful latent spaces as well as the hierarchical GP-LVM [Lawrence and Moore, 2007] but, importantly, they do not suffer from the strong limitation that the segmentation and dimensionality of the
160
Deep Learning with Gaussian Processes layer 5
1
2
... 3
4
5
6
7
8
9
10
layer 4
11
12
13
14
15
1
2
... 3
4
5
6
7
8
9
layer 3
10
11
12
1
2
... 3
4
5
6
7
8
layer 2
9
10
1
2
... 3
4
5
6
layer 1
7
8
1
2
... 3
4
5
6
Fig. 6.10: The ARD weights of a deep GP with 5 hidden layers as learned for the digits experiment. The layer which is closest to the data is using many dimensions, somehow performing “feature expansion” in order to learn very low-level features. The highest the layer in the hierarchy, the fewer weights it seems to use. This is because upper layers work with increasingly rich and abstract features, created in the lower layers. Furthermore, the upper layers seem to better decompose the signals into a more diverse mix of very linear (small weight) and very non-linear dimensions. Note that when we ran a shallow deep GP with a single layer, then that layer used fewer weights compared to the left-most panel shown here. This confirms the idea that having a deep architecture promotes a kind of “feature expansion” in the lowest layers.
latent space must be given a priori. To this end, a motion capture data experiment from Lawrence and Moore [2007] was recreated. They used data from the CMU MOCAP database representing two subjects walking towards each other and performing a ‘high-five’. The data contains 78 frames of motion and each character has 62 dimensions, leading to 124 dimensions in total (i.e. more dimensions than data). To account for the correlated motions of the subjects we applied our method with a two-level hierarchy where the two observation sets were taken to be conditionally independent given their parent latent layer. In the layer closest to the data we associated each GP-LVM with a different set of ARD parameters, allowing the layer above to be used in different ways for each character. In this approach we are inspired by the MRD structure presented in Chapter 5 which is designed to model loosely correlated data sets within the same model. The end result was that we obtained three optimised sets of ARD parameters: one for each modality of the bottom layer (fig. 6.13(b)), and one for the top node (fig. 6.13(c)). Our model discovered a common subspace in the intermediate layer, since for dimensions 2 and 6 both ARD sets have a non-zero value. This is expected in a well trained model, as the two subjects perform very similar motions with opposite directions. The ARD weights are also a means of automatically selecting the dimensionality of each layer and subspace. This flexibility in modelling is impossible for a MAP method like the hierarchical GP-LVM [Lawrence and Moore, 2007], which requires the exact latent structure to be given a priori. Given the true latent structure, the hierarchical GP-LVM learned a latent space which is plotted in figure 6.14 (d,e,f), where fig. (d) corresponds to the top latent space and each
6.3 Experiments
161
Fig. 6.11: The nearest neighbour class separation test on a deep GP model with depth 5. This plot shows the top layer’s latent space projection on its two principal dimensions (5 and 6). The output images corresponding to the top layer’s training inputs are superimposed on the plot (some instances resulting in occlusions were removed). This demonstrates the robust separation learned by the deep model in a completely unsupervised manner (i.e. no class labels were given to it). It is interesting to notice the digits on the border of the clusters. For exampe, the zeros that are close to the cluster of ones are very elongated and those that are further are very round.
of the other two encodes information for each of the two interacting subjects. Our method is not constrained to two dimensional spaces, so for comparison we plot twodimensional projections of the dominant dimensions of each subspace in figure 6.14 (a,b,c). The similarity of the latent spaces is obvious. In contrast to Lawrence and Moore [2007], we did not have to constrain the latent space with dynamics in order to obtain results of good quality.
Further, we can sample from these spaces to see what kind of information they encode. Indeed, we observed that the top layer generates outputs which correspond to different variations of the whole sequence, while when sampling from the first layer we obtain outputs which only differ in a small subset of the output dimensions, e.g. those corresponding to the subject’s hand.
162
Deep Learning with Gaussian Processes
Fig. 6.12: Outputs obtained when sampling from this model. The first two rows (top-down), which were sampled from layers 5 and 4 respectively, encode very local features, e.g. explaining if a zero is a closed circle or not, or how big the circle of a 6 is. We discovered many more local features when we sampled from different dimensions. Conversely, when we sampled from the two dominant dimensions of the parent latent node (two rows in the bottom) we obtained much more varying outputs, i.e. the higher levels indeed encode much more abstract information.
6.3.3
Autoencoders
The deep GP autoencoders are evaluated qualitatively by showing the learned representations, and quantitatively by using them as feature extractors. We consider the following methods and naming abbreviations: • M1 : Unsupervised learning with the variational GP-LVM (see Chapter 3). • M2 : An autoencoder obtained by using a prior conditioned on Y and correlating all points x(i,:) in the posterior. • M3 : An autoencoder obtained by using a variational back-constraint.
Visualisation To get a first flavor of the manifolds learned by the autoencoder we considered again the oil flow dataset. Also, we considered the Frey faces dataset [Frey et al., 1998] that was also used in a similar context by Kingma and Welling [2013]; Hensman and Lawrence [2014]. It constitutes a video of 1965 frames, each in 20 × 28 pixels, from which we only used every other frame. The video is a recording of a man’s face in various grimaces and expressions. For the oil flow data we used model M1 with only one, 10 dimensional layer, so that we match the experimental setting of Section 3.5.2. Due to the large dimensionality of the Frey faces data, we used model M2 in that case, but experimented with a deep autoencoder (3 layers with dimensionality 3,2,2).
163
6.3 Experiments
H1
HA 2
HAB 2
YA
HB2
YB
(a) A multi-view deep GP model.
(b) ARD weights for the two views of the bottom layer.
(c) ARD weights for the top latent layer.
Fig. 6.13: Figure (a) shows the (multi-view) deep GP model employed. Figure (b) shows the ARD weights for the bottom layer’s mappings f2A (blue/wider bins) and f2B (red/thinner bins). Dimensions 2 and 6 form the shared space. Figure (c) shows the ARD weights for the top layer’s mappings, f1 .
Figure 6.15 depicts the results by showing the projection on the most dominant dimensions of the top layer’s latent space. As can be seen, although the models were not given the temporal information for the video data and the label information for the oil flow data, they managed to discover latent spaces that encapsulate this information naturally. In particular, concerning the oil flow data, the nearest neighbour error in the projection is 0, meaning that all points are clustered very well in relation to their label. This figure can be compared to the unsupervised learning case of figure 3.5a. The ARD weights were very similar to those of figure 3.4. Notice that the latent points represented as red crosses form an “L” shape with those of the class corresponding to green circles in a third dimension (not visualised), perpendicular to the page. Figure 6.15c shows the Frey faces data outputs centered on their corresponding latent locations (only a small subset is shown due to removing overlaps). Many aspects of this high-dimensional data was captured on only two dimensions. Firstly, the outliers (e.g. top image and low, far left) were placed away from the rest of the points. Other quite peculiar grimaces are also clustered together (winking, tongue out etc). Secondly, we see multiple levels of separation: moving top-down on the y−axis, the faces gradually change rotation from looking on the (subject’s) right to the left. Further, “happy” faces are placed on the left and “sad” and then “angry” faces are placed on the right.
164
Deep Learning with Gaussian Processes
(a)
(b)
(c)
(d)
(e)
(f)
Fig. 6.14: Up (a,b,c): projections of the latent spaces discovered by our model, Down (d,e,f): the full latent space learned for the model of Lawrence and Moore [2007].
Evaluating the Compression Quantitatively To evaluate the quality of the compression achieved by the autoencoders, we applied the models on data associated with labels (not given to the model) and used the discovered latent space (means of the variational distributions) as features for a discriminative classifier. We used the oil flow dataset (1000 training and 1000 test instances) and the USPS digit data subset that was considered in Section 6.3.2 (150 training and 150 test examples). We compared models M1 , M2 and M3 in both, the “shallow” and the deep setting. However, the deeper models produced similar results to the shallow ones but with an extra optimisation burden. Therefore, in the rest of the analysis we restrict our attention to the shallow models. To increase the reliability of the results we tried two different classifiers: a vanilla support vector machine (SVM) and multiple logistic regression (MLR). The results are summarised in Table 6.1. As can be seen, the autoencoders result in better performance. On the other hand, optimising an autoencoder during the training phase is, in general, more challenging due to the increased number of parameters. In a few cases we needed to restart the optimisation due to getting stuck in local minima, although for the unsupervised learning model this was generally not needed. Another observation from our experiments is that the autoencoder M2 requires much more iterations to converge, possibly because of the correlated structure in the posterior. In conclusion, the important result to keep from these experiments is that the autoencoders perform at least as well as the unsupervised equivalent but are much faster at test time.
165
6.4 Conclusion and Future Work
Table 6.1: Accuracy obtained by using each of the considered models as feature generators for multiple logistic regression (MLR) and an SVM for classification. Best method per group is shown in bold. K refers to the number of inducing points used in the models.
Dataset Usps3Class Usps3Class Usps3Class Usps3Class Usps3Class Usps3Class Oil Flow Oil Flow Oil Flow
6.4
Method M1 M2 M3 M1 M2 M3 M1 M2 M3
K 70 70 70 150 150 150 50 50 50
MLR 96.00% 98.00% 94.00% 94.00% 98.00% 96.67% 96.20% 98.50% 99.00%
SVM 96.00% 97.33% 96.00% 95.33% 98.67% 97.33% 99.30% 99.20% 99.70%
Conclusion and Future Work
This chapter has introduced a framework for efficient Bayesian training of nested Gaussian process mappings. The defined approach approximately marginalises out the latent space, thus allowing for automatic structure discovery in the hierarchy. The method was able to successfully learn hierarchical feature representations for a variety of supervised and unsupervised tasks which describe natural human motion and the pixels of handwritten digits. Persuasive evidence was given that deep GP models are powerful enough to encode abstract information even for smaller data sets. Further exploration could include testing the model on other inference tasks, such as class conditional density estimation, to further validate the ideas. The developed method can also be used to improve existing deep algorithms, something which can be further investigated by incorporating ideas from past approaches. Indeed, previous efforts to combine GPs with deep structures were successful at unsupervised pre-training [Erhan et al., 2010] or guiding [Snoek et al., 2012] of traditional deep models. Although the experiments presented here considered only up to 5 layers in the hierarchy, the methodology is directly applicable to deeper architectures. The marginalisation of the latent space allows for such an expansion with simultaneous regularisation. Preliminary ad-hoc experiments suggest that deeper structures can be considered, but were not supported by the specific datasets considered in this chapter. In the digits experiment, for example, for deep GPs with more than 5 hidden layers the unsupervised learning was switching off layers 6 and above by inflating the noise. Despite the Bayesian nature of the framework, when very deep architectures were
166
Deep Learning with Gaussian Processes
considered in combination with small datasets, optimisation instabilities are naturally likely to arise. Initialising deep GPs is another aspect of the training framework which it is hoped that future research will improve. The main initialisation burden of the model is associated with the variational distributions q(h) of every hidden layer. Literature in traditional deep learning approaches has taught us that smart initialisations have the potential to greatly improve the overall performance of the model. The deep hierarchy proposed in this chapter can also be used with inputs governing the top layer of the hierarchy, leading to a powerful model for regression based on Gaussian processes, but which is not itself a Gaussian process. A promising future direction is to test this model for applications in multitask learning (where intermediate layers could learn representations shared across the tasks) and in modelling real-world non-stationary data or data involving jumps, such as financial data. These are both areas where a single layer GP struggles and the step function experiment showed that the deep GP is very promising alternative to consider. A remaining challenge is to extend the developed methodologies to very large data sets. A very promising approach would be to apply stochastic variational inference [Hoffman et al., 2012]. Hensman et al. [2013a] have shown that the standard variational GP and GP-LVM can be made to fit within this formalism, as was also discussed in Chapter 3. An even more straightforward approach would be to take advantage of algorithms which parallelise the optimisation procedure in multiple computational cores [Gal et al., 2014; Dai et al., 2014]. The next step for deep GPs will be to incorporate these large scale variational learning algorithms.
167
6.4 Conclusion and Future Work
(a) Frey faces: The latent space with colors denoting the position of the frame in the video.
(b) Oil data: Projection onto the two principal directions.
(c) Frey faces: Sample images placed at the location of their corresponding latent points.
Fig. 6.15: Visualisation of autoencoders’ results for the Frey faces and the oil dataset.
Chapter 7 Conclusions and Discussion This thesis considered probabilistic models built using latent and/or partially observed variables connected with Gaussian process mappings. The objective of optimising these models is to learn rich structure in their components while carefully incorporating any available prior information. However, such flexible models are associated with many degrees of freedom and, hence, are challenging to regularise. Therefore, this thesis was concerned with developing the mathematical framework and algorithms that allow for uncertainty propagation between the different model components and optimisation stages. Variational methods were developed to allow for principled uncertainty handling, and were shown to enable automatic capacity control (i.e. regularisation) even when data is scarce. The developed variational methodology enabled the definition and development of powerful Bayesian models, all of which can be seen as special cases of the most general model introduced in this thesis: the deep Gaussian process. This chapter summarizes the key ideas, contributions and results of this thesis. Ideas for further research are also discussed.
7.1
Summary of Contributions
• Chapter 2 provided a unifying view of existing approximations for sparse Gaussian processes, with a particular focus on variational approaches. • In Chapter 3 a variational framework was developed, that allows for learning approximate posteriors (rather than just point estimates) of latent variables that act as inputs to a GP. Within this Bayesian framework, the use of automatic relevance determination covariance functions is shown to enable automatic capacity control. • In the same chapter, the variational framework was extended to allow for corre-
170
Conclusions and Discussion
lating the latent space posteriors given additional prior information, for example temporal inputs. Bayesian warped Gaussian processes and autoencoders can then be seen as special cases. • Chapter 4 introduced semi-described learning as a new type of learning with GPs where the inputs are partially observed. Variational constraints were introduced to account for the partial information in the context of the developed variational methods. • In the same chapter, algorithmics were developed to generalise the variational GP framework to semi-supervised learning. Auto-regressive GPs is a special case which was also studied. • Chapter 5 extended the variational framework to the multi-view case. This allowed for discovering conditional (in)dependencies in the latent space which, in contrast to past approaches like [Ek, 2009], is automatically segmented in a “soft” manner. The resulting model can be seen as a non-linear, non-parametric, Bayesian variant of inter-battery factor analysis [Tucker, 1958]. In this context, our method is one of the first to be successfully demonstrated on truly large modality sets. • Chapter 6 introduced deep Gaussian processes (deep GPs). Their relation to more traditional deep learning approaches was studied and a variational framework that allowed for optimising them in a principled Bayesian manner was developed. Encouraging results in supervised and unsupervised learning were demonstrated. • In the same chapter, it was shown that even when the data is scarce, deep models are still able to learn a hierarchy of latent features with increasing abstraction, i.e. to successfully perform representation learning.
7.2
Future Work
Promising paths for future work involve approaches to solving current limitations of the presented methods and further extensions of the developed methodologies. In particular, a common limitation of the developed methods is difficulty in scaling them up. The discussed factorised variational bounds seem to be a promising direction, but the algorithmics to optimising them have to be improved. Further, the variational frameworks developed here make specific assumptions about the choices of the variational distributions. Milder assumptions could lead to better approximations. Finally, Gaussian likelihoods were used throughout the thesis. Extension to non-Gaussian likelihoods could enable application of the methods to new domains. After summarising
7.2 Future Work
171
the current limitations of the developed methods, it is useful to outline below in more detail the most promising paths for future research. Big data. An increasing amount of machine learning research is lately focused on big data. The main modelling contributions defined in this thesis (variational GP-LVM, MRD, deep GPs) were associated with objective functions which are distributable and/or fully factorised. Thus, a natural future direction of research is to exploit recent advances in the algorithmics of stochastic or distributed optimisation [Hensman et al., 2013a; Gal et al., 2014; Dai et al., 2014] to be able to apply the models developed here to big data. Promising results towards this direction were shown in Section 3.5.6 and by [Gal et al., 2014; Dai et al., 2014]. Furthermore, there is the potential of exploiting recent advances in speeding up GPs using sophisticated algorithmic structures, e.g. [Meier et al., 2014; Bui and Turner, 2014; Deisenroth and Ng, 2015]. Comparing to / complementing traditional deep learning methods. Scaling up deep Gaussian processes to large datasets would also allow us to more directly compare their performance to that of traditional (parametric) deep learning approaches. Since traditional deep learning approaches struggle with unsupervised learning, it would be interesting to see whether they can be complemented by or even combined with deep Gaussian processes. Indeed, previous efforts to combine GPs with deep structures were successful at unsupervised pretraining [Erhan et al., 2010] or guiding [Snoek et al., 2012] of traditional deep models. Improving the algorithmics. Conversely, it would be interesting to explore how the algorithmics of the models developed here can accommodate elements from the methodology being developed in the field of deep learning. Although ideally we would prefer as much automation as possible in optimising our models, the domain of deep learning has taught us that putting effort in improving the initialisation and calibration of our methods can drastically improve performance. There is still a lot of ground to be covered in improving the algorithmics of the models developed in this thesis. Better convergence rates can potentially be achieved through better inference procedures, e.g. by optimising the latent variables separately in an EM-like algorithm. Stochastic optimisation can be improved with better momentum and learning rate adaptation policies. Further, although for the experiments carried out in this thesis a simple initialisation for the latent space was used, such as PCA, it is worth exploring more sophisticated alternatives. In particular, application-driven initialisation can be considered, e.g. when the latent space corresponds to that of a dynamical
172
Conclusions and Discussion
model, it is natural to seek initial solutions that correspond to latent time-series. Representation and generic feature learning. The models developed in this thesis aim to learn a highly structured and compressed latent space from observations. A natural direction for future research would be to investigate the applicability of these models as generic feature extractors. A flavour of this functionality was given in the discussion for semi-supervised learning and for autoencoders. Additionally, it would be interesting to use MRD for consolidating heterogeneous features in order to improve upon existing feature extractors. For example, using as new features the shared space discovered by an MRD model which is given edge descriptors, color descriptors and raw pixels as separate views. Taking the feature extraction ideas one step further, a promising future direction would be to pursue research in using the developed models for representation learning, e.g. transfer learning. Applications. Although the methodology developed in this thesis was not particularly application-driven, it is possible that combining it with application-specific engineering into a higher-level learning algorithm might provide unique solutions. For example, Lu and Tang [2014] have been able to achieve remarkable face recognition rates with an algorithm based on the GP-LVM. Apart from the domain of computer vision, robotics is another very promising application area for the models developed here. The intuitive and highly structured latent spaces learned through semi-described and semi-supervised learning can act as the perception module of an autonomous robot. System constraints (e.g. torque limits) can be accommodated through priors. Scarce data often encountered in robotics can be handled well by the developed Bayesian models. Additionally, decision making mechanisms can be added as a separate component, in the manner of Deisenroth et al. [2014]. Computational biology is another field where the models developed here can prove useful, e.g. MRD can be used to consolidate experimental results. Recognition models. This thesis was concerned with generative models which consider the likelihood of the outputs given the latent spaces (and potential inputs). Given novel outputs, an approximate posterior of the latent points is obtained through optimisation. A promising direction for future research is to use recognition models to directly model this inverse mapping. This constitutes a more sophisticated solution with regards to the variational constraints developed in Chapter 4. Recognition models have been shown to not only speed up inference at test time, but also to improve convergence during training [Stuhlmüller et al., 2013; Rezende et al., 2014].
References Ankur Agarwal and Bill Triggs. Recovering 3D human pose from monocular images. IEEE Transactions on Pattern Analysis and Machine Intelligence, 28(1), 2006. doi: 10.1109/TPAMI.2006.21. (page 117) Mauricio A. Álvarez, David Luengo, Michalis K. Titsias, and Neil D. Lawrence. Variational inducing kernels for sparse convolved multiple output Gaussian processes. Technical report, University of Manchester, 2009. (page 21) Mauricio A. Álvarez, David Luengo, Michalis K. Titsias, and Neil D. Lawrence. Efficient multioutput Gaussian processes through variational inducing kernels. In Teh and Titterington [2010], pages 25–32. (page 127) Ricardo Andrade-Pacheco, James Hensman, and Neil D. Lawrence. Hybrid discriminative-generative approaches with Gaussian processes. In Kaski and Corander [2014]. (page 129) The GPy authors. GPy: A Gaussian process framework in Python. 2014. URL https://github.com/SheffieldML/GPy. (page 74) David J. Bartholomew. Latent Variable Models and Factor Analysis. Charles Griffin & Co. Ltd, London, 1987. (page 57) Alexander Basilevsky. Statistical Factor Analysis and Related Methods. Wiley, New York, 1994. (page 57) Matthew James Beal. Variational algorithms for approximate Bayesian inference. PhD thesis, University of London, 2003. (page 45) Sue Becker, Sebastian Thrun, and Klaus Obermayer, editors. Advances in Neural Information Processing Systems, volume 15, Cambridge, MA, 2003. MIT Press. (pages 177 and 180) Mikhail Belkin and Partha Niyogi. Laplacian eigenmaps for dimensionality reduction and data representation. Neural Computation, 15(6):1373–1396, 2003. doi: 10.1162/089976603321780317. (page 39) Yoshua Bengio. Learning Deep Architectures for AI. Found. Trends Mach. Learn., 2 (1):1–127, January 2009. ISSN 1935-8237. doi: 10.1561/2200000006. (page 133) Yoshua Bengio, Pascal Lamblin, Dan Popovici, and Hugo Larochelle. Greedy layerwise training of deep networks. In In NIPS. MIT Press, 2007. (pages 141, 142, and 151)
174
References
Yoshua Bengio, Aaron C. Courville, and Pascal Vincent. Unsupervised feature learning and deep learning: A review and new perspectives. CoRR, abs/1206.5538, 2012. (pages 133 and 140) Christopher M. Bishop. Bayesian PCA. In Michael J. Kearns, Sara A. Solla, and David A. Cohn, editors, Advances in Neural Information Processing Systems, volume 11, pages 482–388, Cambridge, MA, 1999. MIT Press. (pages 40, 43, and 57) Christopher M. Bishop. Pattern Recognition and Machine Learning. Springer-Verlag, 2006. ISBN 0387310738. (pages 14 and 33) Christopher M. Bishop. Pattern Recognition and Machine Learning (Information Science and Statistics). Springer, 1st ed. 2006. corr. 2nd printing edition, October 2007. ISBN 0387310738. (page 45) Christopher M. Bishop and Gwilym D. James. Analysis of multiphase flows using dual-energy gamma densitometry and neural networks. Nuclear Instruments and Methods in Physics Research, A327:580–593, 1993. doi: 10.1016/01689002(93)90728-Z. (pages 66 and 101) Christopher M. Bishop, Marcus Svensén, and Christopher K. I. Williams. GTM: the Generative Topographic Mapping. Neural Computation, 10(1):215–234, 1998. doi: 10.1162/089976698300017953. (pages 38 and 39) M Brookes. The matrix reference manual, 2011. URL http://www.ee.imperial.ac.uk/ hp/staff/dmb/matrix/intro.html. (page 188) Thang Bui and Richard E. Turner. Tree-structured Gaussian process approximations. In Ghahramani, Welling, Weinberger, Lawrence, and Cortes, editors, Advances in Neural Information Processing Systems, volume 26, 2014. (pages 32 and 171) Roberto Calandra, Jan Peters, Carl Edward Rasmussen, and Marc Peter Deisenroth. Manifold gaussian processes for regression. arXiv preprint arXiv:1402.5876, 2014. (pages 131 and 153) Olivier Chapelle, Bernhard Schölkopf, and Alex Zien, editors. Semi-supervised Learning. MIT Press, Cambridge, MA, 2006. (page 99) Lehel Csató and Manfred Opper. Sparse on-line Gaussian processes. Neural Computation, 14(3):641–668, 2002. (pages 21, 23, 63, and 200) Zhenwen Dai, Andreas Damianou, James Hensman, and Neil Lawrence. Gaussian process models with parallelization and GPU acceleration. arXiv:1410.4984, NIPS workshop on Software Engineering for Machine Learning, 2014. (pages 6, 30, 32, 33, 50, 77, 87, 132, 150, 166, and 171) Andreas Damianou and Neil Lawrence. Uncertainty propagation in Gaussian process pipelines. NIPS workshop on modern non-parametrics, 2014. (page 6) Andreas Damianou and Neil Lawrence. Semi-described and semi-supervised learning with Gaussian processes. In 31st Conference on Uncertainty in Artificial Intelligence (UAI), 2015. (page 6)
References
175
Andreas Damianou and Neil D. Lawrence. Deep Gaussian processes. In Carlos Carvalho and Pradeep Ravikumar, editors, Proceedings of the Sixteenth International Workshop on Artificial Intelligence and Statistics, volume 31, AZ, USA, 2013. JMLR W&CP 31. (pages 7 and 131) Andreas Damianou, Michalis K. Titsias, and Neil D. Lawrence. Variational Gaussian process dynamical systems. In Peter Bartlett, Fernando Peirrera, Chris Williams, and John Lafferty, editors, Advances in Neural Information Processing Systems, volume 24, Cambridge, MA, 2011. MIT Press. (pages 6, 32, 37, 39, 40, 77, 87, 131, and 157) Andreas Damianou, Carl Henrik Ek, Michalis K. Titsias, and Neil D. Lawrence. Manifold relevance determination. In John Langford and Joelle Pineau, editors, Proceedings of the International Conference in Machine Learning, volume 29, San Francisco, CA, 2012. Morgan Kauffman. (pages 7 and 32) Andreas Damianou, Michalis K., Titsias, and Neil D. Lawrence. Variational inference for latent variables and uncertain inputs in Gaussian processes. Journal of Machine Learning Research (in press), 2015. (pages 5, 6, 35, 40, 77, 86, and 87) Sanjoy Dasgupta and David McAllester, editors. Proceedings of the 30th International Conference on Machine Learning, ICML 2013, Atlanta, GA, USA, 16-21 June 2013, volume 28 of JMLR Proceedings, 2013. JMLR.org. (pages 175 and 185) Marc P. Deisenroth, Dieter Fox, and Carl Edward Rasmussen. Gaussian processes for data-efficient learning in robotics and control. IEEE Transactions on Pattern Analysis and Machine Intelligence, 99:1, 2014. ISSN 0162-8828. (pages 102 and 172) Marc Peter Deisenroth and Jun Wei Ng. Distributed Gaussian processes. arXiv preprint arXiv:1502.02843, 2015. (pages 32 and 171) Marc Peter Deisenroth, Ryan Darby Turner, Marco F Huber, Uwe D Hanebeck, and Carl Edward Rasmussen. Robust filtering and smoothing with Gaussian processes. Automatic Control, IEEE Transactions on, 57(7):1865–1871, 2012. (pages 76, 96, and 97) Petros Dellaportas and David A Stephens. Bayesian analysis of errors-in-variables regression models. Biometrics, pages 1085–1095, 1995. (page 20) Misha Denil, Babak Shakibi, Laurent Dinh, Nando de Freitas, et al. Predicting parameters in deep learning. In Advances in Neural Information Processing Systems, pages 2148–2156, 2013. (page 135) N Durrande, D Ginsbourger, and O Roustant. Additive kernels for Gaussian process modeling. ArXiv e-prints 1103.4023, 2011. (page 131) David Duvenaud, James Robert Lloyd, Roger Grosse, Joshua B. Tenenbaum, and Zoubin Ghahramani. Structure discovery in nonparametric regression through compositional kernel search. In Dasgupta and McAllester [2013], pages 1166– 1174. (page 131)
176
References
David Duvenaud, Oren Rippel, Ryan Adams, and Zoubin Ghahramani. Avoiding pathologies in very deep networks. In Kaski and Corander [2014]. (pages 131, 136, 137, and 140) Carl Henrik Ek. Shared Gaussian Process Latent Variable Models. PhD Thesis, 2009. (pages 104, 119, and 170) Carl Henrik Ek, Phil Torr, and Neil Lawrence. Gaussian process latent variable models for human pose estimation. Proceedings of the 4th international conference on Machine learning for multimodal interaction, 2007. (page 105) Carl Henrik Ek, Jon Rihan, Philip Torr, Gregory Rogez, and Neil D. Lawrence. Ambiguity modeling in latent spaces. In Andrei Popescu-Belis and Rainer Stiefelhagen, editors, Machine Learning for Multimodal Interaction (MLMI 2008), LNCS, pages 62–73. Springer-Verlag, 28–30 June 2008a. (pages 87, 89, 91, 104, and 107) Carl Henrik Ek, Philip H.S. Torr, and Neil D. Lawrence. Gaussian process latent variable models for human pose estimation. In Andrei Popescu-Belis, Steve Renals, and Hervé Bourlard, editors, Machine Learning for Multimodal Interaction (MLMI 2007), volume 4892 of LNCS, pages 132–143, Brno, Czech Republic, 2008b. Springer-Verlag. doi: 10.1007/978-3-540-78155-4_12. (pages 19 and 104) Dumitru Erhan, Yoshua Bengio, Aaron Courville, Pierre-Antoine Manzagol, Pascal Vincent, and Samy Bengio. Why does unsupervised pre-training help deep learning? J. Mach. Learn. Res., 11:625–660, March 2010. ISSN 1532-4435. (pages 165 and 171) Brian D. Ferris, Dieter Fox, and Neil D. Lawrence. WiFi-SLAM using Gaussian process latent variable models. In Manuela M. Veloso, editor, Proceedings of the 20th International Joint Conference on Artificial Intelligence (IJCAI 2007), pages 2480–2485, 2007. (page 19) Brendan J Frey, Antonio Colmenarez, and Thomas S Huang. Mixtures of local linear subspaces for face recognition. In Computer Vision and Pattern Recognition, 1998. Proceedings. 1998 IEEE Computer Society Conference on, pages 32–37. IEEE, 1998. (page 162) Roger Frigola, Fredrik Lindsten, Thomas B Schön, and Carl E Rasmussen. Identification of Gaussian process state-space models with particle stochastic approximation em. In 19th World Congress of the International Federation of Automatic Control (IFAC), Cape Town, South Africa, 2014. (page 76) Nicoló Fusi, Christoph Lippert, Karsten Borgwardt, Neil D. Lawrence, and Oliver Stegle. Detecting regulatory gene-environment interactions with unmeasured environmental factors. Bioinformatics, 2013. doi: 10.1093/bioinformatics/btt148. (page 19) Yarin Gal, Mark van der Wilk, and Carl E. Rasmussen. Distributed variational inference in sparse Gaussian process regression and latent variable models. arXiv:1402.1389, 2014. (pages 30, 32, 33, 50, 77, 87, 132, 150, 166, and 171)
References
177
Athinodoros Georghiades, Peter Belhumeur, and David Kriegman. From few to many: Illumination cone models for face recognition under variable lighting and pose. IEEE Trans. Pattern Anal. Mach. Intelligence, 23(6), 2001. (pages 112 and 114) Zoubin Ghahramani, editor. Proceedings of the International Conference in Machine Learning, volume 24, 2007. Omnipress. ISBN 1-59593-793-3. (pages 180 and 185) Agathe Girard, Carl Edward Rasmussen, Joaquin Quiñonero Candela, and Roderick Murray-Smith. Gaussian process priors with uncertain inputs—application to multiple-step ahead time series forecasting. In Becker et al. [2003], pages 529–536. (pages xvii, 20, 36, 40, 63, 86, 87, 96, 97, 98, and 99) Paul W. Goldberg, Christopher K. I. Williams, and Christopher M. Bishop. Regression with input-dependent noise: A Gaussian process treatment. In Michael I. Jordan, Michael J. Kearns, and Sara A. Solla, editors, Advances in Neural Information Processing Systems, volume 10, pages 493–499, Cambridge, MA, 1998. MIT Press. (pages 20 and 87) Mehmet Gönen and Ethem Alpaydin. Multiple kernel learning algorithms. Journal of Machine Learning Research, 12:2211–2268, Jul 2011. (page 131) Neil J. Gordon, David J. Salmond, and Adrian F. M. Smith. Novel approach to nonlinear/non-gaussian bayesian state estimation. IEE Proceedings F Radar and Signal Processing, 140(2), 1993. (page 38) J Ham, D Lee, and Lawrence K Saul. Semisupervised alignment of manifolds. In Annual Conference on Uncertainty in Artificial Intelligence, 2005. (page 104) James Hensman and Neil D Lawrence. Nested variational compression in deep Gaussian processes. arXiv preprint arXiv:1412.1370, 2014. (pages 26, 131, 153, 154, and 162) James Hensman, Magnus Rattray, and Neil D. Lawrence. Fast variational inference in the conjugate exponential family. In Peter L. Bartlett, Fernando C. N. Pereira, Christopher J. C. Burges, Léon Bottou, and Kilian Q. Weinberger, editors, Advances in Neural Information Processing Systems, volume 25, Cambridge, MA, 2012. (page 28) James Hensman, Nicoló Fusi, and Neil D. Lawrence. Gaussian processes for big data. In Ann Nicholson and Padhraic Smyth, editors, Uncertainty in Artificial Intelligence, volume 29. AUAI Press, 2013a. (pages 28, 31, 33, 52, 54, 77, 132, 150, 166, and 171) James Hensman, Neil D. Lawrence, and Magnus Rattray. Hierarchical Bayesian modelling of gene expression time series across irregularly sampled replicates and clusters. BMC Bioinformatics, 14(252), 2013b. doi: doi:10.1186/1471-2105-14-252. (page 131) James Hensman, Andreas Damianou, and Neil Lawrence. Deep Gaussian processes for large datasets. AISTATS, Late Breaking Poster, 2014a. URL http://tinyurl.com /deepGPsLargeData. (pages 6, 52, 75, 77, and 150)
178
References
James Hensman, Alex Matthews, and Zoubin Ghahramani. Scalable variational Gaussian process classification. arXiv preprint arXiv:1411.2005, 2014b. (page 74) Geoffrey E. Hinton. Products of experts. In ICANN 99: Ninth international conference on artificial neural networks, volume 1, pages 1–6. IEE Press, 1999. (page 133) Geoffrey E. Hinton. A Practical Guide to Training Restricted Boltzmann Machines. Technical report, 2010. (page 133) Geoffrey E Hinton and Ruslan R Salakhutdinov. Reducing the dimensionality of data with neural networks. Science, 313(5786):504–507, 2006. (page 142) Geoffrey E. Hinton, Peter Dayan, Brendan J. Frey, and Radford M. Neal. The wakesleep algorithm for unsupervised neural networks. Science, 268:1158–1161, 1995. (page 142) Geoffrey E Hinton, Simon Osindero, and Yee-Whye Teh. A fast learning algorithm for deep belief nets. Neural computation, 18(7):1527–1554, 2006. (pages 133 and 141) Matthew Hoffman, David M. Blei, Chong Wang, and John Paisley. Stochastic variational inference. arXiv preprint arXiv:1206.7051, 2012. (pages 28, 31, and 166) Kurt Hornik, Maxwell Stinchcombe, and Halbert White. Multilayer feedforward networks are universal approximators. Neural Networks, 2(5):359–366, 1989. (page 133) J. J. Hull. A database for handwritten text recognition research. IEEE Transactions on Pattern Analysis and Machine Intelligence, 16:550–554, 1994. (pages 73, 101, and 159) Aapo Hyvärinen, Juha Karhunen, and Erkki Oja. Independent Component Analysis. John Wiley and Sons, 2001. ISBN 978-0-471-40540-5. (page 38) William H Jefferys and James O Berger. Ockham’s razor and bayesian analysis. American Scientist, pages 64–72, 1992. (page 45) Sami Kaski and Jukka Corander, editors. Artificial Intelligence and Statistics, volume 33, Iceland, 2014. JMLR W&CP 33. (pages 173 and 176) Kristian Kersting, Christian Plagemann, Patrick Pfaff, and Wolfram Burgard. Most likely heteroscedastic gaussian process regression. In Proceedings of the 24th international conference on Machine learning, ICML ’07, pages 393–400, New York, NY, USA, 2007. ACM. ISBN 978-1-59593-793-3. doi: 10.1145/ 1273496.1273546. (pages 20 and 87) Daniel Keysers, Roberto Paredes, Hermann Ney, and Enrique Vidal. Combination of tangent vectors and local representations for handwritten digit recognition. In Structural, Syntactic, and Statistical Pattern Recognition, pages 538–547. Springer, 2002. (page 75)
References
179
Nathaniel J. King and Neil D. Lawrence. Fast variational inference for Gaussian Process models through KL-correction. In ECML, Berlin, 2006, Lecture Notes in Computer Science, pages 270–281, Berlin, 2006. Springer-Verlag. (pages 29 and 53) Diederik P Kingma and Max Welling. Auto-encoding variational bayes. arXiv preprint arXiv:1312.6114, 2013. (pages 59, 88, 90, 102, 132, 142, and 162) Diederik P. Kingma, Danilo J. Rezende, Shakir Mohamed, and Max Welling. Semisupervised learning with deep generative models. CoRR, abs/1406.5298, 2014. (pages 86, 99, and 101) Arto Klami and Samuel Kaski. Generative models that discover dependencies between data sets. In Proceedings of MLSP’06, IEEE International Workshop on Machine Learning for Signal Processing, pages 123–128, 2006. (page 104) Jonathan Ko and Dieter Fox. GP-BayesFilters: Bayesian filtering using Gaussian process prediction and observation models. Autonomous Robots, 27:75–90, July 2009. ISSN 0929-5593. doi: 10.1007/s10514-009-9119-x. (pages 19, 42, and 76) Jonathan Ko and Dieter Fox. Learning GP-Bayesfilters via Gaussian process latent variable models. Autonomous Robots, 30:3–23, 2011. ISSN 0929-5593. 10.1007/s10514-010-9213-0. (page 42) Malte Kuss and Thore Graepel. The Geometry Of Kernel Canonical Correlation Analysis. 2003. (page 104) Neil D. Lawrence. Gaussian process models for visualisation of high dimensional data. In Sebastian Thrun, Lawrence Saul, and Bernhard Schölkopf, editors, Advances in Neural Information Processing Systems, volume 16, pages 329–336, Cambridge, MA, 2004. MIT Press. (page 18) Neil D. Lawrence. Probabilistic non-linear principal component analysis with Gaussian process latent variable models. Journal of Machine Learning Research, 6: 1783–1816, 11 2005. (pages 5, 18, 19, 35, and 39) Neil D. Lawrence. The Gaussian process latent variable model. Technical Report CS-06-03, The University of Sheffield, Department of Computer Science, 2006. (page 19) Neil D. Lawrence. Learning for larger datasets with the Gaussian process latent variable model. In Marina Meila and Xiaotong Shen, editors, Proceedings of the Eleventh International Workshop on Artificial Intelligence and Statistics, pages 243–250, San Juan, Puerto Rico, 21-24 March 2007a. Omnipress. (pages 39, 67, 69, and 73) Neil D. Lawrence. Fast sparse Gaussian process methods: The informative vector machine, 7 2007b. (page 21) Neil D. Lawrence. A unifying probabilistic perspective for spectral dimensionality reduction: Insights and new models. Journal of Machine Learning Research, 13, 2012. URL http://jmlr.csail.mit.edu/papers/v13/lawrence12a.html. (page 39)
180
References
Neil D. Lawrence. Personalized health with Gaussian processes, 11 2013. URL http://staffwww.dcs.shef.ac.uk/people/N.Lawrence/talks/personalized_healt h_leahurst13.pdf. Presented at the Disease Mapping Workshop, Leahurst. (page 3) Neil D. Lawrence and Michael I. Jordan. Semi-supervised learning via Gaussian processes. In Lawrence Saul, Yair Weiss, and Léon Bouttou, editors, Advances in Neural Information Processing Systems, volume 17, pages 753–760, Cambridge, MA, 2005. MIT Press. (page 99) Neil D. Lawrence and Andrew J. Moore. Hierarchical Gaussian process latent variable models. In Ghahramani [2007], pages 481–488. ISBN 1-59593-793-3. (pages 42, 131, 138, 144, 159, 160, 161, and 164) Neil D. Lawrence and Joaquin Quiñonero Candela. Local distance preservation in the gp-lvm through back constraints. In Proceedings of the 23rd international conference on Machine learning, ICML ’06, pages 513–520, New York, NY, USA, 2006. ACM. ISBN 1-59593-383-2. doi: http://doi.acm.org/10.1145/1143844.1143909. (pages 88 and 152) Neil D. Lawrence and Joaquin Quiñonero Candela. Local distance preservation in the GP-LVM through back constraints. In William Cohen and Andrew Moore, editors, Proceedings of the International Conference in Machine Learning, volume 23, pages 513–520. Omnipress, 2006. ISBN 1-59593-383-2. doi: 10.1145/ 1143844.1143909. (pages 87, 89, and 91) Neil D. Lawrence, Matthias Seeger, and Ralf Herbrich. Fast sparse Gaussian process methods: The informative vector machine. In Becker et al. [2003], pages 625–632. (page 31) Miguel Lázaro-Gredilla. Bayesian warped Gaussian processes. In Advances in Neural Information Processing Systems, pages 1619–1627, 2012. (pages 40, 59, 131, and 132) Miguel Lázaro-Gredilla and Michalis K. Titsias. Variational heteroscedastic gaussian process regression. In In 28th International Conference on Machine Learning (ICML-11, pages 841–848. ACM, 2011. (pages 20 and 87) Honglak Lee, Chaitanya Ekanadham, and Andrew Y Ng. Sparse deep belief net model for visual area v2. In Advances in neural information processing systems, pages 873–880, 2008. (page 141) Xuejun Liu, Marta Milo, Neil D. Lawrence, and Magnus Rattray. Probe-level measurement error improves accuracy in detecting differential gene expression. Bioinformatics, 22(17):2107–2113, 2006. doi: 10.1093/bioinformatics/btl361. (page 86) Chaochao Lu and Xiaoou Tang. Surpassing human-level face verification performance on lfw with gaussianface. CoRR, abs/1404.3840, 2014. (pages 19 and 172) David J. C. MacKay. Hyperparameters: optimise or integrate out? In G. Heidbreder, editor, Maximum Entropy and Bayesian Methods, Santa Barbara 1993, Dordrecht, The Netherlands, 1994. Kluwer. (page 15)
References
181
David J. C. MacKay. Probable networks and plausible predictions – a review of practical Bayesian methods for supervised neural networks. Network: Computation in Neural Systems, 6(3):469–505, 1995a. (page 45) David J. C. MacKay. Bayesian neural networks and density networks. Nuclear Instruments and Methods in Physics Research, A, 354(1):73–80, 1995b. doi: 10.1016/0168-9002(94)00931-7. (pages 36, 37, 38, and 39) David J. C. MacKay. Introduction to Gaussian processes. In C. M. Bishop, editor, Neural Networks and Machine Learning, NATO ASI Series, pages 133–166. Kluwer Academic Press, 1998. (page 66) David J. C. MacKay. Introduction to Gaussian Processes. In Christopher M. Bishop, editor, Neural Networks and Machine Learning, volume 168 of Series F: Computer and Systems Sciences, pages 133–166. Springer-Verlag, Berlin, 1998. (pages 16 and 133) David J. C. MacKay. Information Theory, Inference and Learning Algorithms. Cambridge University Press, Cambridge, U.K., 2003. ISBN 0-52164-298-1. (page 14) Kantilal V. Mardia, John T. Kent, and John M. Bibby. Multivariate analysis. Academic Press, London, 1979. ISBN 0-12-471252-5. (page 39) Iain Matthews, Tim Cootes, Andrew Bangham, Stephen Cox, and Richard Harvey. Extraction of visual features for lipreading. Pattern Analysis and Machine Intelligence, IEEE Transactions on, 24(2):198–213, 2002. (page 121) Andrew McHutchon and Carl Edward Rasmussen. Gaussian process training with input noise. In NIPS’11, pages 1341–1349, 2011. (pages 20 and 87) Franziska Meier, Philipp Hennig, and Stefan Schaal. Incremental local Gaussian regression. In 28th Annual Conference on Neural Information Processing Systems (NIPS 2014), 2014. (pages 32 and 171) Roland Memisevic, Leonid Sigal, and David J Fleet. Shared Kernel Information Embedding for Discriminative Inference. Transactions on Pattern Analysis and Machine Intelligence, 2011. (page 104) Thomas P. Minka. Automatic choice of dimensionality for PCA. In Todd K. Leen, Thomas G. Dietterich, and Volker Tresp, editors, Advances in Neural Information Processing Systems, volume 13, pages 598–604, Cambridge, MA, 2001. MIT Press. (page 57) Toby J Mitchell and John J Beauchamp. Bayesian variable selection in linear regression. Journal of the American Statistical Association, 83(404):1023–1032, 1988. (page 43) Radford M. Neal. Bayesian Learning for Neural Networks. Springer, 1996. Lecture Notes in Statistics 118. (pages 15 and 133) Jeremey Oakley and Anthony O’Hagan. Bayesian inference for the uncertainty distribution of computer model outputs. Biometrika, 89(4):769–784, 2002. (pages 20, 36, 63, 87, and 96)
182
References
Jeremy Oakley. Bayesian uncertainty analysis for complex computer codes. PhD thesis, University of Sheffield, 1999. (page 20) Jeremy Oakley. Eliciting Gaussian process priors for complex computer codes. Journal of the Royal Statistical Society: Series D (The Statistician), 51(1):81–97, 2002. (page 19) Jeremy Oakley. Estimating percentiles of uncertain computer code outputs. Journal of the Royal Statistical Society: Series C (Applied Statistics), 53(1):83–93, 2004. (page 20) Manfred Opper and Cédric Archambeau. The variational Gaussian approximation revisited. Neural Computation, 21(3):786–792, 2009. (pages 58, 59, and 196) Fabian Pedregosa, Gaël Varoquaux, Alexandre Gramfort, Vincent Michel, Bertrand Thirion, Olivier Grisel, Mathieu Blondel, Peter Prettenhofer, Ron Weiss, Vincent Dubourg, et al. Scikit-learn: Machine learning in python. The Journal of Machine Learning Research, 12:2825–2830, 2011. (page 74) Kaare Brandt Petersen, Michael Syskind Pedersen, et al. The matrix cookbook. Technical University of Denmark, 450:7–15, 2008. (page 188) Joaquin Quiñonero Candela and Carl Edward Rasmussen. A unifying view of sparse approximate Gaussian process regression. Journal of Machine Learning Research, 6:1939–1959, 2005. (pages 21, 22, and 33) Joaquin Quiñonero-Candela, Agathe Girard, Jan Larsen, and Carl Edward Rasmussen. Propagation of uncertainty in bayesian kernel models-application to multiple-step ahead forecasting. In Acoustics, Speech, and Signal Processing, 2003. Proceedings.(ICASSP’03). 2003 IEEE International Conference on, volume 2, pages II–701. IEEE, 2003. (pages 20, 86, 87, and 96) Marc-Aurelio Ranzato, Lan Boureau, and Yann LeCun. Sparse feature learning for deep belief networks. In Advances in neural information processing systems, pages 1185–1192, 2008. (page 142) Carl Edward Rasmussen and Christopher K. I. Williams. Gaussian Processes for Machine Learning. MIT Press, Cambridge, MA, 2006. ISBN 0-262-18253-X. (pages 14, 15, 63, 65, 66, 138, 153, 198, and 200) Danilo Jimenez Rezende, Shakir Mohamed, and Daan Wierstra. Stochastic backpropagation and variational inference in deep latent gaussian models. arXiv preprint arXiv:1401.4082, 2014. (pages 52, 142, and 172) Salah Rifai, Pascal Vincent, Xavier Muller, Xavier Glorot, and Yoshua Bengio. Contractive auto-encoders: Explicit invariance during feature extraction. In Proceedings of the 28th International Conference on Machine Learning (ICML-11), pages 833–840, 2011. (page 142) Chuck Rosenberg, Martial Hebert, and Henry Schneiderman. Semi-supervised selftraining of object detection models. In Application of Computer Vision, 2005. WACV/MOTIONS ’05 Volume 1. Seventh IEEE Workshops on, volume 1, pages 29–36, Jan 2005. doi: 10.1109/ACVMOT.2005.107. (pages 87 and 94)
References
183
Sam T. Roweis and Lawrence K. Saul. Nonlinear dimensionality reduction by locally linear embedding. Science, 290(5500):2323–2326, 2000. doi: 10.1126/scie nce.290.5500.2323. (page 39) Ruslan Salakhutdinov and Iain Murray. On the quantitative analysis of deep belief networks. In Sam Roweis and Andrew McCallum, editors, Proceedings of the International Conference in Machine Learning, volume 25, pages 872–879. Omnipress, 2008. (page 137) Mathieu Salzmann, Carl Henrik Ek, Raquel Urtasun, and Trevor Darrell. Factorized Orthogonal Latent Spaces. International Conference on Artificial Intelligence and Statistics, 2010. (pages 104, 105, 106, and 112) John W. Sammon. A nonlinear mapping for data structure analysis. IEEE Transactions on Computers, C-18(5):401–409, 1969. doi: 10.1109/T-C.1969.222678. (page 39) Simo Särkkä. Bayesian Filtering and Smoothing. Cambridge University Press, 2013. ISBN 9781107619289. (pages 37 and 38) Bernhard Schölkopf, Alexander Smola, and Klaus-Robert Müller. Nonlinear component analysis as a kernel eigenvalue problem. Neural Computation, 10:1299–1319, 1998. doi: 10.1162/089976698300017467. (page 39) Matthias Seeger, Christopher K. I. Williams, and Neil D. Lawrence. Fast forward selection to speed up sparse Gaussian process regression. In Christopher M. Bishop and Brendan J. Frey, editors, Proceedings of the Ninth International Workshop on Artificial Intelligence and Statistics, Key West, FL, 3–6 Jan 2003. (pages 21, 23, 63, and 200) Aaron Shon, Keith Grochow, Aaron Hertzmann, and Rajesh Rao. Learning shared latent structure for image synthesis and robotic imitation. In Neural Information Processing Systems, 2006. (pages 104, 105, and 107) Alex J. Smola and Bernhard Schölkopf. Sparse greedy matrix approximation for machine learning. In Pat Langley, editor, Proceedings of the International Conference in Machine Learning, volume 17, pages 911–918, San Francisco, CA, 2000. Morgan Kauffman. (page 31) Edward Snelson and Zoubin Ghahramani. Sparse Gaussian processes using pseudoinputs. In Weiss et al. [2006]. (pages 21 and 23) Edward Snelson, Carl Edward Rasmussen, and Zoubin Ghahramani. Warped gaussian processes. Advances in neural information processing systems, 16:337–344, 2004. (pages 40, 59, 131, and 132) Jasper Snoek, Ryan Prescott Adams, and Hugo Larochelle. On nonparametric guidance for learning autoencoder representations. In Fifteenth International Conference on Artificial Intelligence and Statistics (AISTATS), 2012. (pages 165 and 171) Nitish Srivastava, Geoffrey Hinton, Alex Krizhevsky, Ilya Sutskever, and Ruslan Salakhutdinov. Dropout: A simple way to prevent neural networks from overfitting. Journal of Machine Learning Research, 15:1929–1958, 2014. URL http://jmlr.org/papers/v15/srivastava14a.html. (page 135)
184
References
Andreas Stuhlmüller, Jacob Taylor, and Noah Goodman. Learning stochastic inverses. In C.J.C. Burges, L. Bottou, M. Welling, Z. Ghahramani, and K.Q. Weinberger, editors, Advances in Neural Information Processing Systems 26, pages 3048–3056. Curran Associates, Inc., 2013. (pages 52 and 172) Graham W. Taylor, Geoffrey E. Hinton, and Sam Roweis. Modeling human motion using binary latent variables. In Bernhard Schölkopf, John C. Platt, and Thomas Hofmann, editors, Advances in Neural Information Processing Systems, volume 19, Cambridge, MA, 2007. MIT Press. (pages 67, 69, and 73) Yee Whye Teh and D. Michael Titterington, editors. Artificial Intelligence and Statistics, volume 9, Chia Laguna Resort, Sardinia, Italy, 13-16 May 2010. JMLR W&CP 9. (pages 173 and 184) Johsua B. Tenenbaum, Thomas L. Griffiths, and Charles Kemp. Theory-based bayesian models of inductive learning and reasoning. Trends in Cognitive Sciences, 10(7):309–318, 2006. doi: 10.1016/j.tics.2006.05.009. (page 139) Joshua B. Tenenbaum, Virginia de Silva, and John C. Langford. A global geometric framework for nonlinear dimensionality reduction. Science, 290(5500):2319– 2323, 2000. doi: 10.1126/science.290.5500.2319. (pages 39 and 158) Michael E. Tipping. The relevance vector machine. In Sara A. Solla, Todd K. Leen, and Klaus-Robert Müller, editors, Advances in Neural Information Processing Systems, volume 12, pages 652–658, Cambridge, MA, 2000. MIT Press. (page 43) Michael E. Tipping and Christopher M. Bishop. Probabilistic principal component analysis. Journal of the Royal Statistical Society, B, 6(3):611–622, 1999. doi: doi:10.1111/1467-9868.00196. (page 57) Michalis Titsias and Miguel Lázaro-Gredilla. Variational inference for mahalanobis distance metrics in Gaussian process regression. In C.J.C. Burges, L. Bottou, M. Welling, Z. Ghahramani, and K.Q. Weinberger, editors, Advances in Neural Information Processing Systems 26, pages 279–287. Curran Associates, Inc., 2013. (page 56) Michalis K. Titsias. Variational learning of inducing variables in sparse Gaussian processes. In David van Dyk and Max Welling, editors, Proceedings of the Twelfth International Workshop on Artificial Intelligence and Statistics, volume 5, pages 567–574, Clearwater Beach, FL, 16-18 April 2009. JMLR W&CP 5. (pages 21, 23, 24, 25, 29, 31, 33, 47, 54, and 77) Michalis K. Titsias and Neil D. Lawrence. Bayesian Gaussian process latent variable model. In Teh and Titterington [2010], pages 844–851. (pages 5, 6, 32, 35, 40, 77, and 86) Ledyard R. Tucker. An inter-battery method of factor analysis. Psychometrika, 23 (2):111–136, 1958. (page 170) Richard Turner and Maneesh Sahani. Probabilistic amplitude and frequency demodulation. In J. Shawe-Taylor, R.S. Zemel, P.L. Bartlett, F. Pereira, and K.Q. Weinberger, editors, Advances in Neural Information Processing Systems 24, pages 981– 989. Curran Associates, Inc., 2011. (page 96)
References
185
Richard E Turner. Statistical models for natural sounds. PhD thesis, UCL (University College London), 2010. (pages 96 and 131) Raquel Urtasun and Trevor Darrell. Discriminative Gaussian process latent variable model for classification. In Ghahramani [2007]. ISBN 1-59593-793-3. (pages 19 and 41) Raquel Urtasun, David J. Fleet, and Pascal Fua. 3D people tracking with Gaussian process dynamical models. In Proceedings of the IEEE Computer Society Conference on Computer Vision and Pattern Recognition, pages 238–245, New York, U.S.A., 17–22 Jun. 2006. IEEE Computer Society Press. doi: 10.1109/CV PR.2006.15. (page 42) Larens J. P. van der Maaten and Geoffrey E. Hinton. Visualizing data using t-sne. Journal of Machine Learning Research, 9:2579–2605, 2008. (page 39) Deepak Vasisht, Andreas Damianou, Manik Varma, and Ashish Kapoor. Active learning for sparse bayesian multilabel classification. In Proceedings of the 20th ACM SIGKDD international conference on Knowledge discovery and data mining, pages 472–481. ACM, 2014. (page 7) Pascal Vincent, Hugo Larochelle, Yoshua Bengio, and Pierre-Antoine Manzagol. Extracting and composing robust features with denoising autoencoders. In Proceedings of the 25th international conference on Machine learning, pages 1096–1103. ACM, 2008. (page 142) Jack M. Wang, David J. Fleet, and Aaron Hertzmann. Gaussian process dynamical models. In Weiss et al. [2006]. (pages 37 and 42) Jack M. Wang, David J. Fleet, and Aaron Hertzmann. Gaussian process dynamical models for human motion. IEEE Transactions on Pattern Analysis and Machine Intelligence, 30(2):283–298, 2008. ISSN 0162-8828. doi: 10.1109/TPAM I.2007.1167. (pages 19 and 42) Yair Weiss, Bernhard Schölkopf, and John C. Platt, editors. Advances in Neural Information Processing Systems, volume 18, Cambridge, MA, 2006. MIT Press. (pages 183 and 185) Christopher K. I. Williams. Computation with infinite neural networks. Neural Computation, 10(5):1203–1216, 1998. (page 133) Christopher K. I. Williams and Carl E. Rasmussen. Gaussian processes for regression. In David Touretzky, Michael Mozer, and Mark Hasselmo, editors, Advances in Neural Information Processing Systems, volume 8, pages 514–520, Cambridge, MA, 1996. MIT Press. (page 33) Andrew Gordon Wilson and Ryan Prescott Adams. Gaussian process kernels for pattern discovery and extrapolation. In Dasgupta and McAllester [2013], pages 1067–1075. (page 131) Chang Xu, Dacheng Tao, and Chao Xu. A survey on multi-view learning. arXiv preprint arXiv:1304.5634, 2013. (page 103) Cheng Zhang, Carl Henrik Ek, Andreas Damianou, and Hedvig Kjellström. Factorized topic models. CoRR, abs/1301.3461, 2013. (pages 7 and 129)
Appendix A Useful Identities This thesis contains a large amount of mathematical computations involving Gaussian random variables and matrices. This appendix defines a few equations deemed convenient for the derivations but, perhaps, not immediately obvious.
A.1
Gaussian Identities
Marginalisation and conditioning in Gaussian distributions is facilitated thanks to the easy manipulation of the Gaussian form inside integrals. Here we define some shorthands that can be very useful and save the effort of explicitly having to compute integrals. The defined equations are used explicitly or implicitly almost in every technical chapter of this thesis. Marginal and Conditional Distributions: If we have a marginal Gaussian distribution for u and a conditional Gaussian distribution for f given u in the form: p(f |u) = N (f |Mu + m, Σf ) p(u) = N (u|µu , Σu ) then the marginal distribution of f and the conditional distribution of u given f are given by: p(f ) = N f |Mµu + m, Σf + MΣu M⊤
�
(A.1)
−1 p(u|f ) = N u|L M⊤ Σ−1 f (f − m) + Σu µu , L ,
�
�
188
Useful Identities
⊤ −1 ⊤ −1 where L = (Σ−1 u + M Σf M ) .
The Kullback–Leibler Divergence Between Two Multivariate Gaussians: Assume a random variable X ∈ ℜn×q . For two continuous distributions q(X) and p(X), the Kullback-Leibler divergence of p(X) from q(X) is written as: Z KL (q(X) ∥ p(X)) =
q(X) log
h i qX dX = − ⟨log p(X)⟩q(X) + Hq(X) , p(X)
where Hq(X) denotes the entropy of the distribution. For the case of two multivariate Q Q Gaussian distributions: q(X) = qj=1 N (xj |mj , Sj ) and p(X) = qj=1 N (xj |µj , Σ) (i.e. Σj = Σ, ∀j), we have: q
� q 1 X � −1 KL (q(X) ∥ p(X)) = log |Σ| + tr Σ Sj + (µj − mj )⊤ Σ−1 (µj − mj ) 2 2 j=1 q
1X nq − log |Sj | − . 2 j=1 2
A.2
(A.2)
Matrix Identities
In this section we use the following notation: A is an invertible matrix of size n × n, U and V are matrices of size n × m and W is an invertible matrix of size m × m.
The Woodbury matrix identity: A + UWV⊤
�−1
�−1 ⊤ −1 = A−1 − A−1 U W−1 + V⊤ A−1 U V A ,
(A.3)
The matrix determinant lemma: A + UWV⊤ = W−1 + V⊤ A−1 U |W| |A| ,
(A.4)
where |·| denotes the determinant of a matrix.
A.3
Useful Formulae for Derivative
Great help in computing derivatives can be obtained by studying Brookes [2011] and Petersen et al. [2008]. Here I have summarised some identities that are the most
A.3 Useful Formulae for Derivative
189
useful in the context of this thesis. Notation: Capital, bold font letters denote matrices. Small, non-bold font letters denote scalars. |X| denotes the determinant of the matrix. ∂Y ∂X ∂(XY) =X + Y ∂θ ∂θ ∂θ ∂K−1 ∂K −1 = − K−1 K ∂θ ∂θ ∂tr(X) =I ∂X � � ∂ log |K| −1 ∂K = tr K ∂θ ∂θ � � ∂tr(f (X)) ∂f (X) = tr ∂θ ∂θ ∂tr(XA) = A⊤ ∂X ∂tr(AXB) = A ⊤ B⊤ ∂X ∂|X| = |X|X−1 ∂X ∂ log |X| 1 = |X|X−1 = X−1 ∂X |X|
Appendix B Variational GP-LVM This appendix concerns the variational GP-LVM framework developed in Chapter 3 and which is used as a backbone for the methodology developed in the rest of the chapters. The details of this appendix aim at providing a useful reference for the implementation of the software, or for extending the method. In summary, the variational GP-LVM framework aims at defining a variational lower bound for the logarithm of the marginal likelihood: Z F ≤ log p(Y) = log
p(Y|X)p(X)dX,
where Y ∈ ℜn×p constitute the output data and X ∈ ℜn×q are the latent inputs. The developed variational approximation overcomes associated intractabilities by working in an augmented probability space, where the function values F are accompanied with pseudo-outputs U evaluated at pseudo-inputs Xu . Section B.1 provides more mathematical details concerning the derivation of the variational lower bound, firstly discussed in Section 3.3.3, where the variational distributions q(X) and q(U) are introduce to achieve the approximation. In 3.3.4 one of the two variational distributions is “collapsed”. Section B.2 shows the computation of the type of statistics appearing in the bound due to taking the expectation of the covariance with respect to the variational distribution of the inputs. Section B.3 shows the analytic calculation of all the derivatives needed for the dynamical version of the variational GP-LVM. The derivatives are quite complicated due to the reparameterisation introduced in Section 3.3.6, and this appendix might provide useful in understanding that technique.
192
B.1
Variational GP-LVM
Further Details About the Variational Bound
This appendix section contains supplementary details for deriving some mathematical formulae related to the calculation of the final expression of the variational lower bound for the training phase. Since many derivations require completing the square to recognize a Gaussian, we will use the following notation throughout the Appendix: Z = the collection of all constants for the specific line in equation, where the definition of a constant depends on the derivation at hand.
B.1.1
Calculating the Explicit Form of q(uj )
Recall that in section 3.3.4 the variational lower bound was collapsed to optimally eliminate its dependence on the variational distribution q(U). To obtain the collapsed bound, one needs to firstly find the optimal form of the variational distribution and then to replace it back to the bound to eliminate it. The optimal form was expressed in equation (3.22), and here we compute it in more detail. From equation (3.22), we have:
�� log q(uj ) = const + log N yj |aj , β −1 In q(X) + log p(uj ). (B.1) All the involved distributions are Gaussian and, hence, we only need to compute the r.h.s of the above equation and complete the square in order to get the posterior Gaussian distribution for q(uj ). The expectation appearing in the above equation is easily just by summing the relevant terms over the n outputs in equation (3.14):
�� β � −1 ⊤ log N yj |aj , β −1 In q(X) = const − tr yj yj⊤ − 2yj u⊤ j Kuu Ψ 2 � −1 −1 + u⊤ K ΦK u . j j uu uu
We can now easily find equation (B.1) by combining equations (B.2) and (3.9):
(B.2)
193
B.1 Further Details About the Variational Bound
�� log q(uj ) ∝ log N yj |aj , β −1 In q(X) + log p(uj ) � 1 � −1 ⊤ ⊤ −1 −1 = Z − −1 tr yj yj⊤ − 2yj u⊤ K Ψ + u K ΦK u j uu j uu uu j 2β � � 1 ⊤ − tr K−1 uu uj uj 2 � 1 � ⊤ −1 −1 = Z − tr uj βK−1 uu ΦKuu + Kuu uj 2 � ⊤ ⊤ ⊤ (B.3) Ψ y u + βyj yj − 2βK−1 j j . uu We can now complete the square again and recognize that q(uj ) = N (uj |µu , Σu ), where: −1 −1 Σu = βK−1 uu ΦKuu + Kuu
�−1
and
⊤ µu = βΣu K−1 uu Ψ yj .
By “pulling” the Kuu matrices out of the inverse and after simple manipulations we get the final form of q(uj ): q(uj ) = N (uj |µu , Σu ) where �−1 ⊤ µu = Kuu β −1 Kuu + Φ Ψ yj � −1 Σu = β −1 Kuu β −1 Kuu + Φ Kuu .
B.1.2
(B.4)
Detailed Derivation of Fˆj (q(X)) in Equation (3.23)
In this section we derive the first term of the collapsed variational bound, denoted as Fˆj (q(X)), in more detail. A preliminary expression for this bound is given in equation (3.23). We rewrite this equation here for completeness: Fˆj (q(X)) = log
Z
⟨log N (yj |aj ,β −1 In )⟩q(X) e p(uj )duj − A.
Part of the r.h.s of this expresson has already been computed in the previous appendix, in equation (B.3). To use this result, we rewrote equation (B.3) as a function of the optimal q(uj ) found in equation (B.4) by completing the constant terms:
�� log N yj |aj , β −1 In q(X) + log p(uj ) = B + log N (uj |µu , Σu ) where we have defined:
(B.5)
194
Variational GP-LVM
1 1 n 1 1 β −1 B = − log(2π) − log |β −1 In | − log |Kuu | − yj⊤ yj + µ⊤ u Σu µu + log |Σu |. 2 2 2 2 2 2 (B.6) We can now obtain the final expression for (3.23) by simply putting the quantity of (B.5) on the exponent and integrating. By doing so, we get: Z Z ⟨log N (yj |aj ,βIn )⟩q(X) e p(uj )duj = eB elog N (uj |µu ,Σu ) duj = eB eq. (B.6)
=
n
n
β
1
⊤
1
1
⊤
−1
(2π)− 2 β 2 |Kuu |− 2 e− 2 yj yj |Σu | 2 e 2 µu Σu
µu
.
(B.7)
By using equation (B.4) and some straightforward algebraic manipulations, we can −1 replace in the above µ⊤ u Σu µu with: −1 ⊤ 2 −1 ⊤ µ⊤ u Σu µu = yj β Ψ(βΦ + Kuu ) Ψ yj . {z } |
(B.8)
W′
Finally, using equation (B.4) to replace Σu with its equal, as well as equation (B.8), we can write the integral of equation (B.7) as: Z
n
⟨log N (yj |ad ,βId )⟩q(X)
e
p(uj )duj =
1
β
⊤
β 2 |Kuu |− 2 |Kuu |e− 2 yj yj (2π)n/2 |βΦ + Kuu |
1 2
1
⊤
′
e 2 yj W yj .
(B.9)
We can now obtain the final form for the variational bound by replacing equation (B.9) in equation (3.23), as well as replacing the term A with its equal and defining W = βIn − W′ . By doing the above, we get exactly the final form of the bound of equation (3.25).
B.2
Calculating the {ξ, Ψ, Φ} Quantities
Here we explain how one can compute the {ξ, Ψ, Φ} quantities (introduced in Section 3.3.3) for two standard choices for the GP mapping. For completeness, we start by rewriting the equations (3.16), (3.17) and (3.18): ξ=
n X
ξˆi , with ξˆi =
Z kf (xi,: , xi,: )N (xi,: |µi,: , Si ) dxi,: .
i=1
Z Ψi,k =
Φ=
n X i=1
ˆ i with (Φ ˆ i )k,k′ = Φ
kf (xi,: , (xu )k,: )N (xi,: |µi,: , Si ) dxi,: . Z kf (xi,: , (xu )k,: )kf ((xu )k′ ,: , xi,: ) N (xi,: |µi,: , Si ) dxi,:
B.3 Derivatives of the Variational Bound for the Dynamical Variational GP-LVM195 The above computations involve convolutions of the covariance function with a Gaussian density. For some standard kernels such the ARD exponentiated quadratic (RBF) covariance and the linear covariance function these statistics are obtained analytically. In particular for the ARD exponentiated quadratic kernel of equation (2.7) we have: ξ = nσf2 q
Ψi,k = σf2
Y exp
�
2
w (µ −(x )k,j ) − 12 j wji,j(Si )j,ju+1
�
1
(wj (Si )j,j + 1) 2 � w ((xu )k,j −(xu )k′ ,j )2 q exp − j − Y 4 j=1
ˆ i )k,k′ = σ 4 (Φ f
1
j=1 (xu )
wj (µi,j −(x¯u )j )2 2wj (Si )j,j +1
+(xu )
(2wj (Si )j,j + 1) 2
� ,
′
k,j k ,j where (x¯u )j = . This gives us all the components we need to compute 2 the variational lower bound for the ARD exponentiated quadratic kernel.
For the linear covariance function given in equation (2.8) the integrals are also tractable: � ξˆi = tr C(µi,: µ⊤ i,: + Si ) (Ψ)i,k = µ⊤ i,: C(xu )k,: ˆ i )k,k′ = (xu )⊤ C(µi,: µ⊤ + Si )C(xu )k′ ,: . (Φ k,: i,:
B.3
Derivatives of the Variational Bound for the Dynamical Variational GP-LVM
Before giving the expressions for the derivatives of the variational bound (3.6), it should be reminded that the variational parameters µj and Sj (for all js) have been reparametrised as �−1 ¯j, Sj = K−1 and µj = Kx µ x + Λj For clarity, in this section we denote the main diagonal of Sj as sj and the main diagonal of Λj as λj . Given the above, the set of the parameters to be optimised is: ¯ j , λj }qj=1 , Xu ). (θf , θx , {µ The gradient w.r.t the inducing points Xu , however, has exactly the same form as for θf and, therefore, is not presented here. All gradients are computed for the collapsed variational bound which is used as
196
Variational GP-LVM
objective function during optimisation. The expression of this bound is given in equation (3.26) and rewritten here for completeness: F = Fˆ − KL (q(X) ∥ p(X)) =
p X
Fˆj − KL (q(X) ∥ p(X|t)) ,
j=1
ˆ where we used the shorthand F = F(q(X)) and Fˆ = F(q(X)) and considered the dynamical formulation for the KL term. Further, recall that F is given in equation (3.25) while the KL term is given in equation (3.29).
B.3.1
Derivatives w.r.t the Variational Parameters
Given the objective function (lower bound), the derivatives can be found after doing some calculations. Since the derivatives have to be taken w.r.t the new parameters (resulting after the reparametrisation), our approach to computing them is to use the chain rule so as to express them as functions of the derivatives for the standard variational GP-LVM. This approach draws inspiration from [Opper and Archambeau, 2009]. ∂F = Kx ¯j ∂µ
∂ Fˆ ¯j −µ ∂µj
!
∂F and = −(Sj ◦ Sj ) ∂λj
∂ Fˆ 1 + λj ∂sj 2
! .
where we use ◦ to denote the Hadammard (or element-wise) product of two matrices. The partial derivatives appearing above are given by: � � Fˆ βp ∂ξ ∂Ψ⊤ ⊤ −1 =− + βtr YY ΨA ∂µj 2 ∂µj ∂µj � � � β ∂Φ −1 −1 −1 −1 ⊤ ⊤ −1 + tr pKuu − β pA − A Ψ YY ΨA 2 ∂µj � � ∂ Fˆ p ∂ξ ∂Ψ⊤ ⊤ −1 = − −1 + βtr YY ΨA ∂(Sj )k,l 2β ∂(Sj )k,l ∂(Sj )k,l � � � β ∂Φ −1 −1 −1 −1 ⊤ ⊤ −1 + tr pKuu − β pA − A Ψ YY ΨA 2 ∂(Sj )k,l with A = β −1 Kuu + Φ.
B.3 Derivatives of the Variational Bound for the Dynamical Variational GP-LVM197
B.3.2
Derivatives w.r.t θ = (θf , θx ) and β
This section is concerned with the derivatives of the variational lower bound with respect to the hyperparameters of the mapping covariance function θf , the hyperparameters of the temporal GP prior, θx and the inverse variance parameter of the noise model, β. Note that the variance parameter β −1 could instead be used as a parameter to be presented to the optimiser, but this was found to be less numerically stable in practice. Given that the KL term involves only the temporal prior, its gradient w.r.t the parameters θf is zero. Therefore: ∂F ∂ Fˆ = ∂θf ∂θf with:
� � βp ∂ξ ∂Ψ⊤ ∂ Fˆ ⊤ −1 = const − + βtr YY ΨA ∂θf 2 ∂θf ∂θf � � � 1 ∂Kuu −1 −1 −1 −1 ⊤ ⊤ −1 −1 −1 + tr pKuu − β pA − A Ψ YY ΨA − βpKuu ΦKuu 2 ∂θf � � � β ∂Φ −1 −1 −1 −1 ⊤ ⊤ −1 + tr pKuu − β pA − A Ψ YY ΨA 2 ∂θf The expression above is identical for the derivatives w.r.t the inducing points. For the gradients w.r.t the β term, we have a similar expression:
� � � � ∂ Fˆ 1h −1 = p tr K−1 − ξ − tr YY⊤ + tr A−1 Ψ⊤ YY⊤ Ψ uu Φ + (n − m)β ∂β 2 � �i +β −2 p tr Kuu A−1 + β −1 tr Kuu A−1 Ψ⊤ YY⊤ ΨA−1 . In contrast to the above, the term Fˆ does involve parameters θx , because it involves the variational parameters that are now reparametrised with Kx , which in turn depends on θx . To demonstrate that, we will forget for a moment the reparametrisation of Sj and express the bound as F(θx , µj (θx )) (where µj (θx ) = Kx µ¯j ) so as to show explicitly the dependency on the variational mean which is now a function of θx . Our � ˆ �⊤ ∂ F (µj ) ∂µj (θx ) that is what we calculations must now take into account the term ∂µj ∂θx
198
Variational GP-LVM
“miss” when we consider µj (θx ) = µj : ∂F(θx , µj (θx )) ∂F(θx , µj ) = + ∂θx ∂θx
ˆ j) ∂ F(µ ∂µj
!⊤
∂µj (θx ) ∂θx
� ˆ � ∂ F(µ ∂(−KL)(θx , µj (θx )) j) = �� + + ∂θx � ∂θx
ˆ j) ∂ F(µ ∂µj
!⊤
∂µj (θx ) . ∂θx
We do the same for Sj and then take the resulting equations and replace µj and Sj ¯ j and λj : with their equals so as to take the final expression which only contains µ �h � 1 �ˆ ∂F(θx , µj (θx ), Sj (θx )) ˆj + µ ¯jµ ¯⊤ = tr − Bj Kx B j ∂θx 2 ! � � �⊤ i ∂K � ∂ Fˆ � x ˆ ˆ + I − Bj Kx diag I − Bj Kx ∂sj ∂θx !⊤ ˆ j) ∂ F(µ ∂Kx ¯j + µ ∂µj ∂θx 1
1
1
1
ˆ j = Λ2 B e −1 Λ 2 . and B ˜ j = I + Λ 2 Kx Λ 2 . Note that by using this B ˜j where B j j j j j matrix (which has eigenvalues bounded below by one) we have an expression which, when implemented, leads to more numerically stable computations, as explained in Rasmussen and Williams [2006] page 45-46.
B.4
Variational Lower Bound for Partially Observed Test Data
This section provides some more details related to the task of doing predictions based on partially observed test data Y∗U . Specifically, section B.4.1 explains in more detail the form of the variational lower bound for the aforementioned prediction scenario and illustrates how this gives rise to certain computational differences for the standard and the dynamical variational GP-LVM. Section B.4.2 gives some more details for the mathematical formulae associated with the above prediction task.
B.4.1
The Variational Bound in the Test Phase and Computational Issues
As discussed in Section 3.4.1, when doing predictions based on partially observed outputs with the variational GP-LVM, one needs to construct a variational lower
B.4 Variational Lower Bound for Partially Observed Test Data
199
bound as for the training phase. However, this now needs to be associated with the full set of observations (Y, Y∗U ). Specifically, we need to lower bound the marginal likelihood given in equation (3.35) with a variational bound that takes the form: p(YU |X)p(Y∗O , YO |X∗ , X)p(X∗ , X) dX∗ dX. q(X∗ , X) (B.10) For the standard variational GP-LVM, we can further expand the above equation by noticing that the distributions q(X, X∗ ) and p(X, X∗ ) are fully factorised as: O
Z
log p(Y∗ , Y) ≥
q(X∗ , X) log
q(X, X∗ ) =
n Y
q(xi,: )
i=1
n∗ Y
q(xi,∗ ).
i=1
Therefore, equation (B.10) can be written as: Z
O
log p(Y∗ , Y) ≥ Z +
q(X) log p(YU |X)dX q(X∗ , X) log p(Y∗O , YO |X∗ , X)dX∗ dX
− KL (q(X) ∥ p(X)) − KL (q(X∗ ) ∥ p(X∗ )) .
(B.11)
Recalling equation (3.27), we see that an approximation for the first term above can P be obtained as the sum j∈U Fˆj (q(X)) where each of the involved terms is given by equation (3.25) and is already computed during the training phase and, therefore, can be held fixed during test time. Similarly, the third term of equation (B.11) is also held fixed during test time. As for the second and fourth term, they can be optimised exactly as the bound computed for the training phase with the difference that now the data are augmented with test observations and only the observed dimensions are accounted for.
In contrast, the dynamical version of our model requires the full set of latent variables (X, X∗ ) to be fully coupled in the variational distribution q(X, X∗ ), as they together form a timeseries. Consequently, the expansion of equation (B.11) cannot be applied here, meaning that in this case no precomputations can be used from the training phase. However, one could apply the approximation q(X, X∗ ) = q(X)q(X∗ ) to speed up the test phase. In this case, each set of latent variables is still correlated, but the two sets are not. However, this approximation was not used in our implementation as it is only expected to speed up the predictions phase if the training set is very big, which is not the case for our experiments.
200
B.4.2
Variational GP-LVM
Calculation of the Posterior q(FU∗ |X∗ ) of Equation (3.4.1)
Optimisation based on the variational bound constructed for the test phase with partially observed outputs, as explained in Section 3.4.1, gives rise to the posterior q(FU∗ , U, X∗ ), as exactly happens in the training phase. Therefore, according to equation (3.12) we can write: q(FU∗ , U, X∗ ) =
p Y
! U |uj , X∗ )q(uj ) q(X∗ ). p(f∗,j
j=1
Q R U The marginal q(FU∗ |X∗ ) is then simply found as j∈U p(f∗,j |uj , X∗ )q(uj )duj . The integrals inside the product are easy to compute since both types of densities appearing there are Gaussian, according to equations (3.8) and (B.4). In fact, each factor takes the form of a projected process predictive distribution from sparse GPs [Csató and Opper, 2002; Seeger et al., 2003; Rasmussen and Williams, 2006]. We will show the analytic derivation for the general case where. all dimensions are observed. Specifically, we want to compute: Z q(f∗,j |X∗ ) =
p(f∗,j |uj , X∗ )q(uj )duj .
For this calculation we use the Gaussian identity of equation (A.1), so that: −1 q(f∗,j |X∗ ) = N f∗,j |K∗u B, K∗∗ − K∗u K−1 Ku∗ uu + (Kuu + βΦ)
��
with B = β(Kuu + βΦ)−1 Ψ⊤ yj . In the above calculations we also used the simplification: �−1 β −1 β −1 Kuu + Φ = (Kuu + βΦ)−1 . Summary This extensive appendix discussed in depth the mathematical derivations leading to the variational lower bound and derivatives for the (dynamical) variational GP-LVM. Further, the appendix elaborated on the coupling introduced by the reparametrisation technique applied to the parameters of the variational Gaussian approximation of the original paramerameters for the dynamical variational GP-LVM. This coupling makes the computation of the derivatives quite challenging. Therefore, this section could potentially be a useful reference for tackling this kind of problems. In summary, I hope that sharing the detailed derivations contained in this appendix will help the interested reader gain insight into the method, facilitate future extensions or implementations, but also help new PhD students familiarise with some mathematical “tricks”.
Appendix C Deep Gaussian Processes This appendix concerns the variational approximation developed in the context of deep Gaussian processes, introduced in Chapter 6. The additional information contained in this appendix, compared to the main thesis, is: firstly more analytic computations of expressions relating to the variational bound. Secondly, expressions that explicitly show the form of the bound in the multivariate case (because in the main chapter the assumption about single-dimensional variables was often made for clarity). Recall that the The road-map of this appendix is as follows: Section C.1 Derivatives with respect to the model parameters are not derived here, but this derivation is straight-forward given the extensive material of Appendix B. The derivatives for the deep GP consist of repeated application of the formulae developed for the variational GP-LVM derivatives with the additional consideration of the fact that each latent variable, h is now affecting two layers: one as an input and one as an output.
C.1
Bound on the marginal likelihood
This section provides some more mathematical details for obtaining the variational lower bound for the deep GP. Specifically, we rewrite the expressions for the case where the observed and hidden spaces are multivariate. We start by deriving in more detail the preliminary bound L, where we only consider marginalisation of the latent mappings fℓ . Then, we proceed to give more details for obtaining the final form of the bound, where we additionally integrate over all hℓ and uℓ terms. We only consider the unsupervised learning case, as the supervised extension trivially comes by modifying
202
Deep Gaussian Processes
the top layer according to the methodology of Chapter 3, as explained in the main part of the thesis.
C.1.1
The preliminary bound for the deep GP
The partial approximations Lℓ of equation (6.12) can be combined to form the full variational bound: L ≤ log p(H1 ) + log p(Y, {Hℓ }Lℓ=2 |{Uℓ }L+1 ℓ=2 ), according to equation (6.11): p X
� � � � β L+1 (j) −1 e L+1 tr K log N y(j) |aL+1 , βL+1 I − 2 j=1 ! qℓ q1 L � � � � β � � X X X ℓ (j) (j) (j) −1 e + + log N hℓ |aℓ , βℓ I − tr Kℓ log N h1 |0, I , 2 j=1 j=1 ℓ=2
L = log p(H1 ) +
with the required quantities being given in equation (6.10). Notice that this bound further factorises with respect to datapoints; indeed, we can write it as: " p n X X
� β � L+1 ˜ (i,:) (i,:) (j) −1 , β k u log N y (i,j) |kL K−1 uL uL L+1 L+1 − 2 L+1 i=1 j=1 ! qℓ L � � β X X ℓ ˜ (i,:) (i,j) (i,:) (j) −1 + log N hℓ |kℓ−1 K−1 kℓ uℓ−1 uℓ−1 uℓ , βℓ I − 2 j=1 ℓ=2 # q1 � � X (i,j) + log N h1 |0, 1 ,
L=
(C.1)
j=1 (i,:) ˜ (i,:) denotes the ith diagonal element where kℓ denotes the ith row of Kfℓ ,uℓ and k ℓ ˜ (i,:) are associated with a single data-point. e ℓ . That is, the quantities k(i,:) and k of K ℓ ℓ To make the factorisation more obvious we will write the bound as: ! p qℓ q1 n L X � � X X X X (i,j) (i,j) (i,j) L= LL+1 + Lℓ + log N h1 |0, 1 . i=1
j=1
ℓ=2 j=1
j=1
203
C.1 Bound on the marginal likelihood
C.1.2
The Final Form of the Bound
We start as in section 6.2, assuming single dimensional variables and the variational distribution of equation (6.16) and denoting {hℓ } = {hℓ }Lℓ=1 and {uℓ } = {uℓ }L+1 ℓ=2 : L+1 Y Q p(y, {hℓ }|{uℓ }) p(uℓ ) d{hℓ , uℓ } Q ℓ=2 QL+1 Z p(y, {hℓ }|{uℓ }) ℓ=2 p(uℓ ) d{hℓ , uℓ }, ≥ Q log QL ℓ=1 q(uℓ+1 )q(hℓ )
Z
log p(y) = log
where we used Jensen’s inequality and replaced Q with its equal on the denominator inside the logarithm. We then break the logarithm and use inequality (6.11): ! L 1 p(uℓ ) X log p(y) ≥ Q log p(y, {hℓ }|{uℓ }) + + log d{hℓ , uℓ } log q(uℓ ) ℓ=1 p(hℓ ) ℓ=2 Z L+1 Z X p(uℓ ) q(uℓ ) log = Q log p(y, {hℓ }|{uℓ }, x)d{hℓ , uℓ } + duℓ q(u ℓ) ℓ=2 L Z X 1 q(hℓ ) log + q(hℓ ) ℓ=1 hℓ L+1 X
Z
≥ ⟨L⟩Q −
L+1 X
KL (q(uℓ ) ∥ p(uℓ )) +
L X
H (q(hℓ )) .
(C.2)
ℓ=1
ℓ=2
By using equation (6.11) while identifying the dependencies in the variables, we have: ⟨L⟩Q = ⟨log p(h1 )⟩q(h1 ) +
L+1 X
⟨Lℓ ⟩q(hℓ−1 )q(hℓ )q(uℓ ) .
ℓ=2
The first expectation above can be combined with the entropy term H(q(h1 )) of equation (C.2), so that we get the final form of the bound F ≤ log p(y), where: F=
L+1 X
⟨Lℓ ⟩Q − KL (q(h1 ) ∥ p(h1 )) −
ℓ=2
L+1 X ℓ=2
KL (q(uℓ ) ∥ p(uℓ )) +
L X
H (q(hℓ )) .
ℓ=2
(C.3) The entropy and KL terms are straightforward to compute. Specifically, due to equation (6.15), the entropy term can be written as: n
q
ℓ � � 1 XX (i) (j,j) log(2π) + 1 + log(Sℓ ) , H (q(hℓ )) = 2 i=1 j=1
(C.4)
204
Deep Gaussian Processes (i)
(i)
where (Sℓ )(j,j) denotes the j−th element in the diagonal of Sℓ . What remains is to show the computations for the first group of terms appearing above. This will be shown below for the general, multivariate case.
We notice that by firstly taking the expectation ⟨Lℓ ⟩q(Hℓ−1 ) , we obtain an expression similar to the second line of equation (C.1) with the covariance matrices turned into the following statistics: ξℓ = ⟨tr (Kfℓ fℓ )⟩q(Hℓ ) ,
Ψℓ = ⟨Kfℓ uℓ ⟩q(Hℓ ) ,
Φℓ = ⟨Kfℓ uℓ Kuℓ fℓ ⟩q(Hℓ ) .
These quantities are exactly analogous to equation (3.15), so they are factorised with (i,:) respect to n. Specifically, the rows Ψℓ of Ψℓ are computed in a decomposed way P P (i) ˆ (i) . Hence, ξˆ(i) , Ψ(i,:) , Φ ˆ (i) are obtained by while ξℓ = ni=1 ξˆℓ and Φℓ = ni=1 Φ ℓ ℓ ℓ ℓ (i,:) evaluating the above expressions using a single data point hℓ . We therefore have, for ℓ = 1, . . . : ⟨Lℓ ⟩q(Hℓ−1 ) = ⟨Lℓ+1 ⟩q(Hℓ ) =
qℓ+1 D n X X i=1 j=1
D
(i,j)
Lℓ+1
E
(i,j) Lℓ+1
E (i,:)
q(hℓ
, with: )
� � 1 βℓ+1 (i,j) 2 (i,j) (i,:) −1 (j) −1 = − log(2πβ (h ) − β tr h Ψ K u ) + ℓ+1 uℓ uℓ ℓ+1 ℓ+1 ℓ+1 ℓ ℓ+1 (i,:) 2 2 q(hℓ ) � � βℓ+1 (j) (j) ⊤ −1 (i) − tr K−1 uℓ uℓ uℓ+1 (uℓ+1 ) Kuℓ uℓ Φℓ 2 � �� βℓ+1 � ˆ(i) (i) ξℓ − tr Φℓ K−1 . − uℓ uℓ 2
After computing the terms ⟨Lℓ+1 ⟩q(Hℓ ) , we now further take the expectations of Lℓ+1 with respect to q(Hℓ+1 ) and q(Uℓ ) to obtain the expectation of the preliminary bound with respect to the full variational distribution Q: D
(i,j)
Lℓ+1
E
� 1 βℓ+1 � (i,j) 2 (i) −1 = − log(2πβℓ+1 )+ tr (mℓ+1 ) + (Sℓ+1 )(j,j) 2 2 Q � � β � � �� ℓ+1 (i,j) (i,:) (j) ˆ(i) − tr Φ(i) K−1 − βℓ+1 tr mℓ+1 Ψℓ K−1 µ − ξ uℓ uℓ uℓ uℓ ℓ+1 ℓ ℓ 2 � � � � βℓ+1 (j) (j) ⊤ (i) −1 tr K−1 , (C.5) − uℓ uℓ µℓ+1 (µℓ+1 ) + Σℓ+1 Kuℓ uℓ Φℓ 2
We can now use equations (C.4) (generalised for the multivariate case) and (C.5)
205
C.1 Bound on the marginal likelihood into the equation (C.3) for the bound, to obtain the final expression: F=
n X
p D X
i=1
j=1
L
q
(i,j) LL+1
E Q
+
qℓ D L X X ℓ=2 j=1
(i,j)
Lℓ
E Q
ℓ � � 1 XX (i) + log(2π) + 1 + log(Sℓ )(j,j) 2 ℓ=1 j=1
� � (i,:) (i,:) − KL q(h1 ) ∥ p(h1 )
! −
qℓ L+1 X X ℓ=1 j=1
� � (j) (j) KL q(uℓ ) ∥ p(uℓ ) .