Hindawi Mathematical Problems in Engineering Volume 2018, Article ID 5847460, 11 pages https://doi.org/10.1155/2018/5847460
Research Article Deep Image Understanding Using Multilayered Contexts Donghyeop Shin and Incheol Kim Department of Computer Science, Kyonggi University, San 94-6, Yiui-dong, Yeongtong-gu, Suwon-si 443-760, Republic of Korea Correspondence should be addressed to Incheol Kim;
[email protected] Received 26 July 2018; Accepted 21 November 2018; Published 10 December 2018 Guest Editor: Ayed A. Salman Copyright © 2018 Donghyeop Shin and Incheol Kim. This is an open access article distributed under the Creative Commons Attribution License, which permits unrestricted use, distribution, and reproduction in any medium, provided the original work is properly cited. Generation of scene graphs and natural language captions from images for deep image understanding is an ongoing research problem. Scene graphs and natural language captions have a common characteristic in that they are generated by considering the objects in the images and the relationships between the objects. This study proposes a deep neural network model named the Context-based Captioning and Scene Graph Generation Network (C2SGNet), which simultaneously generates scene graphs and natural language captions from images. The proposed model generates results through communication of context information between these two tasks. For effective communication of context information, the two tasks are structured into three layers: the object detection, relationship detection, and caption generation layers. Each layer receives related context information from the lower layer. In this study, the proposed model was experimentally assessed using the Visual Genome benchmark data set. The performance improvement effect of the context information was verified through various experiments. Further, the high performance of the proposed model was confirmed through performance comparison with existing models.
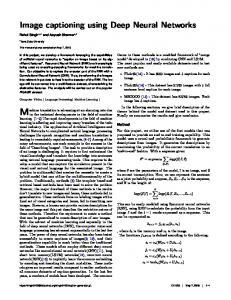
1. Introduction Image understanding is one of the core elements of computer vision and has been extensively researched. Traditional subjects of image understanding research include image classification, object detection, and semantic segmentation [1]. Previous studies have focused on superficial information such as identification of objects included in images and their locations. However, these data are insufficient for expressing image content and have, therefore, been used as basic modules for solving complex image understanding problems such as visual question answering (VQA) [2–4] and referring expression comprehension [5]. Recently, there has been increased research interest on deeper understanding of images, in contrast to traditional studies on image understanding. Thus, efforts have been made to achieve more specific high-level image expressions by obtaining image captions, scene graphs, etc. [6–10]. Figure 1 shows examples of captions and scene graphs generated for an input image. Here, “A woman is riding a horse” is part of an image caption, and is part of a scene graph. The image captions expressed in natural language sentences and the formal knowledge
expressed in scene graphs for the same image scene have complementary characteristics. Image captions expressed in natural sentences have the advantage of being in a form that can be most easily understood by humans; however, they have high complexity as a learning problem as they also include linguistic elements such as grammar in addition to the core elements of the scene. Meanwhile, simple sentence knowledge in triple form, consisting of subject, predicate, and object, as in a scene graph, requires transformation into another form for real-world application. For example, transformation to natural language sentences could be required. However, compared to natural language sentences that may be vague, scene graphs can clearly express the relationships among the objects, which are the core elements of image scenes. Further, the scene graph approach has lower difficulty as a learning problem, because there is no need to consider complex grammatical structures. Moreover, the knowledge graphs acquired from images can be easily combined with numerous existing background datasets and prior knowledge datasets and can potentially exert power in more application areas [11–13]. Image captions and scene graphs have common characteristics in that they are generated with consideration of the objects in the images and the relationships between
2
Mathematical Problems in Engineering Image
Scene Graph wearing
helmet
riding
horse
woman
Region Caption “A woman is riding a horse” “A woman is wearing a helmet” detected objects detected caption regions
Figure 1: Example of scene graph generation and image captioning.
those objects. In view of this characteristic, Li et al. [14] attempted to generate image captions and scene graphs simultaneously from images. This method had the effect of solving two different problems in a complementary manner. For high-level image understanding, the present study proposes the Context-based Captioning and Scene Graph Generation Network (C2SGNet), which is a deep neural network model that simultaneously generates natural language captions and scene graphs from input images. The proposed model consists of three layers in total: the object detection, relationship detection, and caption generation layers. Each layer attempts to predict an accurate scene graph or image caption using the context information of the lower layer. Furthermore, the dependence relations between layers are trained through delivery of features via the context information. To analyze the performance of the proposed model, various experiments are conducted using the Visual Genome benchmark dataset [15].
2. Related Work In general, the scene graph generation process consists of the object detection step, which detects the objects in the image, and the relationship detection step, which detects the relationships between the objects. In many studies, objects in images have been found using object detectors based on the convolutional neural network (CNN) approach, with the relationships between the objects then being predicted by extracting various features of each object pair. To generate accurate scene graphs, an object detector with high prediction accuracy is required. Among the available object detectors, the high-accuracy Faster R-CNN [16] is mainly used [17– 19]. In some studies [20–22], attempts have been made to increase the object classification performance by adopting unconventional methods. In those works, the object regions were predicted using only the region proposal network (RPN) of Faster R-CNN, with object classification then being performed using various features. In the present study, the proposed model is based on Faster R-CNN for more accurate object detection, with the region prediction and object classification processes being separately trained.
In previous studies on scene graph generation, the effective features were obtained from detected objects and used for relationship detection. For example, Lu et al. [23] employed language features with consideration of the visual features of the objects and the semantic similarity of the object words and relation words. Further, Dai et al. [17] and Liao et al. [24] used spatial features (the location information of individual objects) to more accurately identify the location relations. Zhang et al. [25] and Newell et al. [26] converted different region features into comparable features of embedding space. Predictions were then made based on the distances between features. However, in all the above works, a sequential pipeline was essential to predict the relationships between the objects based on the detection results for individual objects. This criterion generates the limitation that the relationship detection performance is highly dependent on the individual object detection performance, i.e., the prior process. Recently, attempts have been made to perform object detection and relationship detection in a complementary manner [14, 20, 22]. In those studies, a neural network model was designed that allows the context information acquired in both processes to be shared through a message-passing system. Simultaneously, the individual object detection process and the relationship detection process for object pairs are implemented. These complementary models have stabilized the unstable performance of individual object detection and also helped improve the relationship detection performance. Furthermore, Li et al. [14] have proposed a deep neural network model that can simultaneously generate scene graphs and image captions, by newly adding caption generation to this model and expanding the message-passing system with existing object detection and relationship detection processes. However, in the techniques presented in the above studies, subcontext features related to the object of prediction are obtained, with the simple sum or average of these features then being used as the context information. Therefore, these methods are limited because it is impossible to know the related element for which each subcontext feature provides context information. Furthermore, the visual features of images have been extracted through CNN in studies on general image caption
Mathematical Problems in Engineering
3 “A woman is riding a horse.”
fcap Caption RPN
fcap Caption Features
Caption Region Rcap
Relationship Region Rrel Pairing & Covering
Image
Object
Object Region Robj
fcap
tcap
Caption Feature crel Relationship Context Feature
Caption Context Network (CCN)
ccap Caption Context Feature
Object Features
(b) Region Feature Extraction
Caption Generation
Caption Feature ccap Caption Context Feature
Captions riding
frel
frel Relationship Features
fobj
RPN
(a) Candidate Region Proposal
Feature Extraction
VGG-16
frel Relationship Feature
Relationship Feature
fobj Subject Feature trel frel Relationship Feature
Relationship Context Network (RCN)
fobj
crel Relationship Context Feature
Relationship Detection
crel
woman
Relationships
Relationship Context Feature
horse
Object Feature
fobj
Object Detection
Object Feature
(c) Context Feature Extraction
riding
wearing
horse
helmet
woman
Scene Graph
Objects
(d) Scene Graph Generation & Captioning
Figure 2: Overall framework of the proposed C2SGNet model.
generation; hence, appropriate sentences for the visual features were generated using a recurrent neural network (RNN) [27]. Among the RNN methods, long short-term memory (LSTM) has mainly been used, which easily processes timeseries data. Previously, Johnson et al. [8, 9, 28] investigated the problem of caption generation for various partial regions of images, in contrast to the existing image captioning problem that treats the image as a whole. This technique involves prediction of candidate regions for captioning from the image, as well as caption generation for each region. However, it is difficult to focus on object information using the technique presented in [28], because the features of the object elements included in the caption candidate regions are not used. Instead, only the total visual features are used. The present paper proposes the C2SGNet model, which generates both natural language captions and scene graphs in a complementary manner for improved accuracy. For this purpose, the model separates the object detection, relationship detection, and caption generation processes and predicts the results using the context information corresponding to each process. For detection of interobject relationships, the context information for the corresponding two objects is used. For caption generation, the context information for objects in the caption regions and their relationships is used. Furthermore, to overcome the limitations of previous studies, an effective context information extraction method for related elements of the prediction object is proposed.
3. Image Captioning and Scene Graph Generation Model 3.1. Model Outline. This study proposes C2SGNet, a deep neural network model that simultaneously generates natural language captions and scene graphs for input images using context information. Figure 2 shows the overall framework of the proposed model. The C2SGNet model is largely composed of three layers: the object detection, relationship detection, and caption generation layers. In addition, the process consists of four
steps: candidate region proposal, region feature extraction, context feature extraction, and scene graph generation and captioning. First, in the candidate region proposal step, the candidate regions in the image that are needed for each layer are generated using a visual feature map, which is extracted from the input image by the VGG-16. In the region feature extraction step, the unique features of each layer are extracted from the candidate regions. In the context feature extraction step, the context information to be used in the upper layer is extracted from the lower layer through the relationship context network (RCN) and the caption context network (CCN). Finally, in the scene graph generation and captioning step, captions are generated that consist of scene graphs composed of triples in form as well as natural language sentences; this is achieved by combining the region features of each layer and the context features obtained from the lower layer. Whereas the natural language captions of the input image are directly obtained as a result of the top caption generation layer, the scene graphs are obtained by combining the results of the two lower layers, i.e., the object detection and relationship detection layers. 3.2. Candidate Region Proposal. As shown in Figure 2(a), C2SGNet generates candidate regions for object detection, relationship detection, and caption generation, respectively, for scene graph generation and captioning. Hereafter, the object region 𝑅𝑜𝑏𝑗 indicates the candidate region of an individual object. The relationship region 𝑅𝑟𝑒𝑙 indicates a candidate region that includes two object regions that have a relationship. Finally, the caption region 𝑅𝑐𝑎𝑝 indicates the candidate region for caption generation. In this paper, we define the form of region R as shown in (1). A region R consists of four values which indicate center coordinates, width, and height of region R. 𝑅 = (𝑥𝑚𝑖𝑑 , 𝑦𝑚𝑖𝑑 , w, ℎ)
(1)
In C2SGNet, the individual object region and caption region are generated through RPN𝑜𝑏𝑗 and RPN𝑐𝑎𝑝 , respectively. These two RPNs have the same network structure,
4
Mathematical Problems in Engineering RPNcap Conv2D Caption Scores
Conv2D
VGG-16 VGG-16 VGG-16
Image I
(
Conv2D
Caption Region Feature
xmid ymid w ℎ , , , ) W H W H
Caption Region Rcap
Bounding Boxes
RPNobj Shared Visual Feature img
Conv2D Object Scores
Conv2D (
Conv2D
Object Region Feature
xmid ymid w ℎ , , , ) W H W H
Object Region Robj
Bounding Boxes
Figure 3: Object and caption region proposal networks.
but are trained differently in accordance with their role. The proposal process of these two regions is illustrated in Figure 3. To generate the regions, the visual feature V𝑖𝑚𝑔 of the input image I is extracted through VGG-16, which is a CNN, as shown in (2). The extracted V𝑖𝑚𝑔 is used as the input feature of the two RPNs, as shown in (3) and (4). Sharing the image features allows reduction of the model size and increased model prediction speed. V𝑖𝑚𝑔 = VGG16 (𝐼)
(2)
𝑅𝑜𝑏𝑗 = RPN𝑜𝑏𝑗 (V𝑖𝑚𝑔 )
(3)
𝑅𝑐𝑎𝑝 = RPN𝑐𝑎𝑝 (V𝑖𝑚𝑔 )
(4)
The RPN predicts the bounding box value of the region and the region score through the convolution layer. The region score consists of two probabilities. A first probability indicates a correctness of region, whereas a second probability indicates an incorrectness of region. The sum of two probabilities is always 1. Therefore, only a first probability is used to judge the bounding box includes a correct target. In RPN𝑜𝑏𝑗 , the target will be an object. If a bounding box is close to a perfect object region, the correctness score will be high. Similarly, in RPN𝑐𝑎𝑝 , the target will be a caption region that could be used to generate a proper caption. The region scores of RPN𝑜𝑏𝑗 and RPN𝑐𝑎𝑝 are illustrated as object score and caption score in Figure 3. If the correctness score of a region is greater than a predefined threshold, the region is selected as the candidate region. The relationship region consists of subjects and objects. Therefore, as shown in Figure 4, the relationship region is generated as a combination of predicted object regions. From the object regions predicted through the RPN, two object pairs are created. Then, the minimum-sized rectangular region wrapping around each object region (𝑅𝑜𝑏𝑗 , 𝑅𝑜𝑏𝑗 ) is
defined as the 𝑅𝑟𝑒𝑙 for the corresponding object pair. This is expressed as follows: 𝑥𝑚𝑖𝑛 = 𝑥𝑚𝑖𝑑 −
𝑤 , 2
(5)
ℎ 𝑦𝑚𝑖𝑛 = 𝑦𝑚𝑖𝑑 − 2 𝑤 𝑥𝑚𝑎𝑥 = 𝑥𝑚𝑖𝑑 + , 2 𝑦𝑚𝑎𝑥
(6)
ℎ = 𝑦𝑚𝑖𝑑 + 2
𝑅 𝑅 union (𝑅, 𝑅 ) = (min (𝑥𝑅𝑚𝑖𝑛 , 𝑥𝑅𝑚𝑖𝑛 ) , min (𝑦𝑚𝑖𝑛 , 𝑦𝑚𝑖𝑛 ),
max (𝑥𝑅𝑚𝑎𝑥 , 𝑥𝑅𝑚𝑎𝑥 ) − min (𝑥𝑅𝑚𝑖𝑛 , 𝑥𝑅𝑚𝑖𝑛 ) ,
(7)
𝑅 𝑅 𝑅 , 𝑦𝑚𝑎𝑥 ) − min (𝑦𝑚𝑖𝑛 , 𝑥𝑅𝑚𝑖𝑛 )) max (𝑦𝑚𝑎𝑥
𝑅𝑟𝑒𝑙 = union (𝑅𝑜𝑏𝑗 , 𝑅𝑜𝑏𝑗 )
(8)
3.3. Region Feature Extraction. For the generated candidate regions, C2SGNet extracts the unique region features (𝑟𝑜𝑏𝑗 , 𝑟𝑟𝑒𝑙 , 𝑟𝑐𝑎𝑝 ) for object detection, relationship detection, and caption generation, respectively, in each layer, as shown in Figure 2(b). This process is detailed in Figure 5. Each layer performs region of interest (RoI) pooling for each candidate region (of various sizes) and determines the visual features (V𝑜𝑏𝑗 , V𝑟𝑒𝑙 , V𝑐𝑎𝑝 ) of the same size. Here, all three layers use the preextracted visual features of the image as the features for pooling. Then, the region features appropriate for each layer are determined through two fully connected layers. 𝑓𝑜𝑏𝑗 and 𝑓𝑐𝑎𝑝 region features are extracted as follows: 𝑓𝑜𝑏𝑗 = 𝑊2𝑜 ⋅ 𝑊1𝑜 ⋅ V𝑜𝑏𝑗
(9)
𝑓𝑐𝑎𝑝 = 𝑊2𝑐 ⋅ 𝑊1𝑐 ⋅ V𝑐𝑎𝑝
(10)
Mathematical Problems in Engineering
5 Subject
Object
Pairing
Covering
Object Region Object Pairs
Relationship Region
Figure 4: Generation of relationship regions. 7∗7∗512 RoI Pooling
Caption Region Rcap
1024
1024
FC Layer
FC Layer
fcap Caption Features
7∗7∗512 RoI Pooling
Relationship Region Rrel
1024
1024
1024
1024
FC Layer
FC Layer
frel Relationship Features
Subject Object y x w ℎ ( mid , mid , , ) W H W H
7∗7∗512 RoI Pooling
Object Region Robj
2 Bounding Boxes 1024
1024
1024
FC Layer
FC Layer
fobj Object Features
Figure 5: Region feature extraction network.
In the case of the relationship detection layer, the region features 𝑓𝑟𝑒𝑙 are determined by inputting the two bounding boxes (𝑏𝑜𝑏𝑗 , 𝑏𝑜𝑏𝑗 ) of the two objects comprising the relationship region, as well as the visual features, to the fully connected layer, as shown in (11). This aids identification of the spatial relationship (e.g., a relationship indicated by an “in” or “on” preposition) through the locational relationships between the two objects. The region features of each layer determined through this process are defined as object features, relationship features, and caption features. 𝑓𝑟𝑒𝑙 = 𝑊2𝑟 ⋅ 𝑊1𝑟 ⋅ [V𝑟𝑒𝑙 , 𝑏𝑜𝑏𝑗 , 𝑏𝑜𝑏𝑗 ]
(11)
3.4. Context Feature Extraction. The region features of each layer include the visual features of each candidate region only and do not include structural information on the scene of the corresponding image. Therefore, the relationship detection and caption generation layers additionally require the core elements comprising the relationships or scenes, as well as the context information indicating their combination structures besides the visual features of the candidate region. For example, the relationship detection layer requires additional context information on the two objects comprising the relationships in order to effectively determine the relationships between object pairs. On the other hand, the caption generation layer requires additional
context information on the relationships between object pairs to be included in the natural language captions. To overcome this problem, in this study, the context features (𝑐𝑟𝑒𝑙 , 𝑐𝑐𝑎𝑝 ) required in the relationship detection and caption generation layers are extracted through the RCN and CCN, respectively, as shown in Figure 2(c). Figure 6 shows the RCN and CCN, which are the networks for extracting the relationship contexts and caption contexts, respectively. To overcome the above-mentioned limitations of the existing techniques, context features are generated by combining the region features of the two core components before and after the region feature of the candidate region. To extract the relationship context feature 𝑐𝑟𝑒𝑙 , the RCN uses the region features 𝑡𝑟𝑒𝑙 of the three components of form. Here, 𝑡𝑟𝑒𝑙 is expressed as 𝑡𝑟𝑒𝑙 = (𝑓𝑜𝑏𝑗 , 𝑓𝑟𝑒𝑙 , 𝑓𝑜𝑏𝑗 )
(12)
To extract the caption context features 𝑐𝑐𝑎𝑝 , the CCN uses the regions and context features of the three components of form. Meanwhile, as one caption region can include multiple relationship regions, the proposed model selects the relationship region having the highest intersection over union (IoU) with the
Mathematical Problems in Engineering Caption Context Feature
max
max
max
max
ccap
CCN
max
Relationship Context Feature
RCN
max
max
crel
max
6
fobj
frel
fobj
frel
fcap
crel
Subject Feature
Relationship Feature
Object Feature
Relationship Feature
Region Feature
Relationship Context Feature
Relationship Context Network (RCN)
Caption Context Network (CCN)
Figure 6: Context feature extraction networks: RCN and CCN.
caption region and uses it for extraction of caption context features. Here, 𝑡𝑐𝑎𝑝 is expressed as 𝑡𝑐𝑎𝑝 = (𝑓𝑟𝑒𝑙 , 𝑓𝑐𝑎𝑝 , 𝑐𝑟𝑒𝑙 )
(13)
To effectively combine the three input features, the RCN and CNN are composed of two bidirectional LSTM (BiLSTM) layers. Bi-LSTM is a bidirectional RNN, as apparent from the following relations: ℎ𝑖 = BiLSTM1,𝑖 (𝑡𝑖 , ℎ𝑖−1 )
(14)
𝑐𝑖 = BiLSTM2,𝑖 (ℎ𝑖 , 𝑐𝑖−1 )
(15)
The aim here is to extract context features by sufficiently considering the combination sequence of the relationship and caption components. In this study, for effective expression of context information, 𝑐1 is selected as the context feature, being dependent on the input features on both sides (see (15)). 3.5. Scene Graph Generation. The scene graph for an image is expressed as a triple set of form, which consists of subject, object and the relationships between them. To generate this scene graph, the object detection layer detects the objects and the relationship detection layer predicts the relationships between object pairs. Figure 7 shows the scene graph generation network and process, which corresponds to Figure 2(d). The two layers input the features extracted in the previous process into the fully connected layer and predict the probability distribution of the objects or relationship classes. The object detection layer uses only the object feature 𝑓𝑜𝑏𝑗 as the input feature, whereas the relationship detection layer uses both the relationship feature 𝑓𝑟𝑒𝑙 and the relationship context feature 𝑐𝑜𝑏𝑗 . The predicted probability distribution represents the individual probability for predefined types. Therefore,
the type having the highest probability is selected as the predicted result of the corresponding region. This process is expressed in the following equations, where 𝑙𝑜 and 𝑙𝑟 indicate the predicted object type and relationship type, respectively: 𝑙𝑜 = arg max (𝑊𝑜 ⋅ 𝑓𝑜𝑏𝑗 )
(16)
𝑙𝑟 = arg max (𝑊𝑟 ⋅ [𝑓𝑟𝑒𝑙 , 𝑐𝑜𝑏𝑗 ])
(17)
In the case of the object region, not only the probability distribution, but also the delta value of the bounding box is predicted, which is used to tune the predicted object region more accurately. To generate the scene graph at a later stage, the detected objects are expressed as nodes of the scene graph and the relationship between the two detected objects is indicated by the edges of the scene graph. Here, each edge is connected from the subject node to the object node. 3.6. Region Captioning. To create captions for partial regions of images, C2SGNet uses LSTM, which is an RNN method. The specific caption generation process is illustrated in Figure 8. First, to generate captions from the LSTM, the hidden state ℎ0 of the LSTM is initialized using 𝑓𝑐𝑎𝑝 and 𝑐𝑐𝑎𝑝 , which are extracted from the previous stage. Then, the word feature ℎ𝑖 is extracted by inputting the word token to the LSTM. Here, ℎ𝑖 is input to the fully connected layer and used to predict the word probability distribution. The word having the highest value in the probability distribution is selected as the newly created word 𝑙𝑐,𝑖 and is input to the LSTM through the embedding layer, as shown in (18) and (19). This process is repeated until the LSTM generates the word token,
Mathematical Problems in Engineering
7 riding
frel argmax
Relationship Feature
FC Layer
woman Probability Distribution
crel Relationship Region Rrel
Relationship Context Feature
Relationships
riding
wearing
horse
helmet
woman
(dx, dy, dw, dh)
FC Layer
horse
Bbox Delta
fobj Object Feature
FC Layer
argmax
Object Region Robj
Probability Distribution
Scene Graph Objects
Figure 7: Scene graph generation network.
Word Probability Distribution
Region Caption “A woman is riding a horse.”
FC Layer fcap Caption Feature ccap Caption Region Rcap
ℎt
Argmax
LSTM
One-Hot Encoding
xt Word Embedding
Caption Context Feature
Figure 8: Region captioning network.
and region captions are generated until the repetition finishes. 𝑒𝑖 = Embed (𝑊𝑒 , 𝑙𝑐,𝑖 )
(18)
ℎ𝑖 = LSTM𝑖 (𝑒𝑖 , ℎ𝑖−1 )
(19)
𝑙𝑐,𝑖 = arg max (𝑊𝑐 ⋅ ℎ𝑖 )
(20)
4. Performance Evaluation 4.1. Dataset. In this study, the Visual Genome benchmark dataset was used for the experiment to evaluate the performance of the proposed C2SGNet. The Visual Genome dataset has definitions of various objects and relationships for each image it contains, and includes natural language captions for partial image regions. For appropriate model training, a partial set of the Visual Genome dataset proposed by Li et al. [14] was used in this experiment. For this dataset, 150 object types and 50 relationship types with high frequencies in the Visual Genome dataset were selected and very small object regions were removed. Among the images in the acquired dataset, 70,998 were used as training data and 25,000 were taken as test data. 4.2. Model Training. Before the experiment, CS2GNet was implemented using PyTorch, which is the Python deep
learning library in the Ubuntu 16.04 LTS environment. The model training and experiment were performed in a hardware environment with an installed GeForce GTX1080 Ti GPU card. In the approach presented in this study, the model is trained in two steps for greater efficacy. In the first step, only the two RPNs used for proposal of the object region and caption region are trained in advance. In the second step, the total network including the two pretrained RPNs is trained. First, to train the two RPNs, the smooth L1 loss function 𝐿 𝑙𝑜𝑐 and the cross entropy loss function 𝐿 𝑐𝑒 of Faster R-CNN [16] are implemented as follows: 1 2 { {2𝑥 , 𝑠𝑚𝑜𝑜𝑡ℎ 𝐿1 (𝑥) = { 1 { |𝑥| − , { 2 𝐿 𝑙𝑜𝑐 (̃𝑏, 𝑏) =
∑
𝑖𝑓 |𝑥| < 1
𝑠𝑚𝑜𝑜𝑡ℎ 𝐿1 (̃𝑏𝑖 − 𝑏𝑖 )
𝑖∈{𝑥,𝑦,𝑤,ℎ}
(21)
otherwise (22)
𝑘
̃ 𝑦) = ∑𝑦𝑡 log 𝑦̃𝑡 𝐿 𝑐𝑒 (𝑦,
(23)
𝑡=0
Consequently, the loss functions of the two RPNs, 𝐿 𝑜𝑏𝑗 𝑅𝑃𝑁 and 𝐿 𝑐𝑎𝑝 𝑅𝑃𝑁, are independently trained and both have the
8
Mathematical Problems in Engineering Table 1: Model performance with and without context information. SGGen
Model Baseline Baseline + RCN Baseline + CCN Baseline + RCN + CCN
R@50 10.71 12.21 10.90 12.66
R@100 12.96 14.57 13.12 14.85
following structure: ̃ 𝑦) + 𝐿 𝑙𝑜𝑐 (̃𝑏, 𝑏) 𝐿 𝑅𝑃𝑁 = 𝐿 𝑐𝑒 (𝑦,
(24)
Note that 𝑦̃ and ̃𝑏 in (24) indicate the region score and bounding box value predicted for the object, respectively, while 𝑦 and 𝑏 indicate the sign of the region in the actual dataset and the bonding box value, respectively. A region is regarded as positive if the IoU value between the predicted and real regions is higher than 0.7, and as negative if this value is lower than 0.3. The other regions are excluded from training. In the second step, each layer of C2SGNet has different loss functions. In the case of the object detection layer, the loss function consists of the smooth L1 loss function for the delta value of the bounding box and the cross entropy loss function for the object classification result, as shown in (25). The relationship detection layer has a cross entropy loss function for the classification result, as shown in (26). The loss function of the caption generation layer is the sum of the cross entropy loss values for the generated words, as shown in (27). 𝐿 𝑜𝑏𝑗 = 𝐿 𝑐𝑒 (̃ 𝑦𝑜𝑏𝑗 , 𝑦𝑜𝑏𝑗 ) + 𝐿 𝑙𝑜𝑐 (𝑏̃ 𝑑𝑒𝑙𝑡𝑎 , 𝑏𝑑𝑒𝑙𝑡𝑎 )
(25)
𝐿 𝑟𝑒𝑙 = 𝐿 𝑐𝑒 (̃ 𝑦𝑟𝑒𝑙 , 𝑦𝑟𝑒𝑙 )
(26)
𝑠𝑡𝑒𝑝
𝐿 𝑐𝑎𝑝 = ∑ 𝐿 𝑐𝑒 (𝑦̃ 𝑐𝑎𝑝,𝑖 , 𝑦𝑐𝑎𝑝,𝑖 )
(27)
𝑖=0
The total loss function of C2SGNet, which is defined as the sum of the loss values of the two RPNs and the loss value of each layer, is expressed as follows: 𝐿 𝑡𝑜𝑡𝑎𝑙 = 𝐿 𝑜𝑏𝑗 𝑅𝑃𝑁 + 𝐿 𝑐𝑎𝑝 𝑅𝑃𝑁 + 𝐿 𝑜𝑏𝑗 + 𝐿 𝑟𝑒𝑙 + 𝐿 𝑐𝑎𝑝
(28)
In the experiment conducted in this study, the Adam optimization algorithm was used to minimize the above loss function. The initial learning rate was set to 0.01 and the learning rate decay method was used, which multiplies the existing learning rate by 0.1 whenever one epoch finishes. 4.3. Metric. To evaluate the scene graph generation performance and caption generation performance of the proposed model, the SGGen and Meteor mAP rating scales were used [14, 28]. SGGen measures the recall of triples comprising the scene graph; that is, it measures the number of positive triples that can be found in a given image. In SGGen, a triple is determined as positive if the object pair and relationship comprising the triple match the positive values and the two
Meteor mAP 5.30 5.61 5.62 5.71
detected object regions have an IoU of 0.5 or higher with the positive object region. Furthermore, Meteor mAP, which is an extension of the single-caption Meteor rating scale [29], is a scale for evaluating multiple captions generated from one image. To calculate Meteor mAP, only the captions having a Meteor rating above a certain value are determined as positive. Meteor mAP then represents the mean ratio of the captions determined as positive among the generated captions. 4.4. Experiments. The first experiment performed in this study analyzed the effects of the RCN and CCN, i.e., the proposed context information extraction networks, on the scene graph generation and captioning performance using the SGGen and Meteor mAP scales. For scene graph generation in particular, SGGen values for the top 50 (R@50) and 100 (R@100) results were measured. Table 1 lists the evaluation results depending on usage of the RCN and/or CCN. The baseline was the C2SGNet model structure excluding both the RCN and CCN. As apparent from the experiment results listed in Table 1, the model employing both the RCN and CCN exhibited the highest performance for both scene graph generation and captioning. Furthermore, higher performance was achieved for the cases using context information through application of the RCN or CCN compared to the baseline. As regards comparison of the RCN and CCN, the RCN yielded better performance improvement than the CCN for scene graph generation, but the opposite was observed for caption generation. This seems to be because the RCN delivers the context information to the relationship detection process, which is a core element of the scene graph procedures, whereas the CCN delivers it to the caption generation process. The second experiment compared the performances of the proposed C2SGNet model and the existing state-of-theart models. As apparent from the experiment results listed in Table 2, the proposed C2SGNet model exhibited better performance compared to the existing models for both scene graph generation and captioning. This experiment result confirms the excellence of the proposed C2SGNet model, which can effectively employ context information. Figure 9 presents the qualitative evaluation results of the C2SGNet model. The left column shows the input images and the objects detected by the model. The results in the right column consist of the scene graphs and image captions generated by the model. The results for Figures 9(a) and 9(b) are examples of appropriate scene graph and image caption generation for the given image, whereas the result for
Mathematical Problems in Engineering
9
Table 2: Performance comparison with state-of-the-art models. SGGen
Model
R@50 0.08 7.09 10.72 12.66
DenseCap [28] LP [23] ISGG [20] MSDN [14] C2SGNet
Meteor mAP 4.41 5.39 5.71
R@100 0.14 9.91 14.22 14.85
Input Image & Detected Objects
Scene Graph
player
Region Caption
wearing
shirt
wearing
pant
wearing
shoe
a baseball player swinging a bat a man wearing a black helmet a baseball player on a field a black helmet on a man the man is wearing a black shirt white letters on the wall a man wearing a black and white hat green and white wall behind the man a man wearing a helmet people watching the game of tennis match a man wearing a helmet the man is wearing white shoes the catcher is wearing black and white shoes
wearing helmet on man
wearing
helmet
line
on
field
(a)
Input Image & Detected Objects
Scene Graph
Region Caption a field of green grass zebra standing in the grass the grass is tall and dry trees in the background the grass is tall and green zebra grazing in the grass head of a zebra trees in the background the sky is blue and clear a tree in a field green leaves on the tree a zebra in the field the head of a zebra
of tail having zebra
having head of
behind having
stripe
tree
(b)
Input Image & Detected Objects
Scene Graph on hat wearing pant on shirt
behind wearing fence
Region Caption a baseball player swinging a bat a baseball player on a field a man playing baseball the pants are white in color a boy wearing a blue shirt a tall chain link fence the man is wearing a black glove a chain link fence behind the man a fence in the background a man wearing a helmet a man playing baseball a man wearing a white shirt a fence in the background the man is wearing a baseball glove
(c)
Figure 9: Scene graph generation and region captioning using CS2GNet.
10 Figure 9(c) is an example of an inappropriate outcome. Examination of the results for Figures 9(a) and 9(b) confirms that the proposed model correctly detected even detailed object regions. Furthermore, the generated scene graphs show that the relationships between objects were also predicted properly. The region captions show that various expressions were generated depending on the image complexity. In the case of Figure 9(c), although various partial objects in the image were found, the person, who was the key element of the image, was not detected. As a result, the main triple representing the image could not be generated. This reveals the limitation that the scene graph generation is greatly dependent on the object detection performance. Furthermore, examination of the scene graph shows that inappropriate triples such as were created. This suggests that the model was trained to predict relationships with large emphasis on the spatial relationships between object pairs.
5. Conclusion In this paper, we propose a method to solve high-level image understanding problem using existing low-level image understanding model. This method can be used to solve problems that demand high-level image understanding such as referring expression comprehension, image retrieval, and visual question answering. This paper suggested the C2SGNET deep neural network model, which can simultaneously generate scene graphs and natural language captions from input images for high-level image understanding. This model uses features related to each task as context information, based on the characteristic that scene graphs and natural language captions can be generated from objects and the relationships between objects. For an effective prediction result and model training, these two tasks are structured into three layers: the object detection, relationship detection, and caption generation layers. The results are predicted through four steps: candidate region proposal, region feature extraction, context feature extraction, and scene graph generation and captioning. In particular, Bi-LSTM, which is a bidirectional RNN, is used to effectively extract context features. In this study, to evaluate the performance of the proposed model, experiments were conducted using the Visual Genome dataset. The experiment results confirmed that context information is helpful for performance improvement. Furthermore, a performance comparison with existing models confirmed the high performance of C2SGNet. However, the proposed model has a limitation that the context information of each layer is obtained only from the lower layer, but not from the higher layer. Future research will be proceeded to overcome the limitation and make full use of the entire context information.
Data Availability The data used to support the findings of this study are available from the corresponding author upon request.
Mathematical Problems in Engineering
Conflicts of Interest The authors declare that there are no conflicts of interest regarding the publication of this paper.
Acknowledgments This work was supported by the Institute for Information & Communications Technology Promotion (IITP), grant funded by the Korean Government (MSIT) [Grant no. 2018-0-00677], “Development of Robot Hand Manipulation Intelligence to Learn Methods and Procedures for Handling Various Objects with Tactile Robot Hands.” Also, this work was supported by Kyonggi University’s Graduate Research Assistantship 2018.
References [1] Y. Guo, Y. Liu, A. Oerlemans, S. Lao, S. Wu, and M. S. Lew, “Deep learning for visual understanding: a review,” Neurocomputing, vol. 187, pp. 27–48, 2016. [2] S. Antol, A. Agrawal, J. Lu et al., “VQA: Visual Question Answering,” in in Proceedings of IEEE International Conference on Computer Vision (ICCV17), vol. 31, p. 4, 2017. [3] K. Kafle and C. Kanan, “Visual question answering: Datasets, algorithms, and future challenges,” Computer Vision and Image Understanding, vol. 163, pp. 3–20, 2017. [4] Q. Wu, D. Teney, P. Wang, C. Shen, A. Dick, and A. van den Hengel, “Visual question answering: A survey of methods and datasets,” Computer Vision and Image Understanding, vol. 163, pp. 21–40, 2017. [5] L. Yu, P. Poirson, S. Yang, A. C. Berg, and T. L. Berg, “Modeling Context in Referring Expressions,” in Computer Vision – ECCV 2016, vol. 9906 of Lecture Notes in Computer Science, pp. 69–85, Springer International Publishing, Cham, 2016. [6] P. Wiriyathammabhum, D. Summers-Stay, C. Ferm¨uller, and Y. Aloimonos, “Computer Vision and Natural Language Processing,” ACM Computing Surveys, vol. 49, no. 4, pp. 1–44, 2017. [7] M. Y. Yang, W. Liao, H. Ackermann, and B. Rosenhahn, “On support relations and semantic scene graphs,” ISPRS Journal of Photogrammetry and Remote Sensing, vol. 131, pp. 15–25, 2017. [8] P. Kinghorn, L. Zhang, and L. Shao, “A region-based image caption generator with refined descriptions,” Neurocomputing, vol. 272, pp. 416–424, 2018. [9] W. Wang and H. Hu, “Multimodal object description network for dense captioning,” IEEE Electronics Letters, vol. 53, no. 15, pp. 1041-1042, 2017. [10] A. Karpathy and L. Fei-Fei, “Deep visual-semantic alignments for generating image descriptions,” IEEE Transactions on Pattern Analysis and Machine Intelligence, vol. 39, no. 4, pp. 664– 676, 2014. [11] S. Aditya, Y. Yang, C. Baral, Y. Aloimonos, and C. Ferm¨uller, “Image Understanding using vision and reasoning through Scene Description Graph,” Computer Vision and Image Understanding, 2017. [12] D. Teney, L. Liu, A. van den, and Hengel., “Graph-Structured Representations for Visual Question Answering,” in in Proceedings of IEEE Conference on Computer Vision and Pattern Recognition (CVPR17, p. 1, 2017.
Mathematical Problems in Engineering [13] J. Johnson, A. Gupta, and F.-F. Li, “Image Generation from Scene Graphs,” in Proceedings of the IEEE Conference on Computer Vision and Pattern Recognition (CVPR18), 2018. [14] Y. Li, W. Ouyang, B. Zhou, K. Wang, and X. Wang, “Scene Graph Generation from Objects, Phrases and Region Captions,” in Proceedings of the 2017 IEEE International Conference on Computer Vision (ICCV), pp. 1270–1279, Venice, October 2017. [15] R. Krishna, Y. Zhu, O. Groth et al., “Visual genome: connecting language and vision using crowdsourced dense image annotations,” International Journal of Computer Vision, vol. 123, no. 1, pp. 32–73, 2017. [16] S. Ren, K. He, R. Girshick, and J. Sun, “Faster R-CNN: towards real-time object detection with region proposal networks,” in Advances in Neural Information Processing Systems, pp. 91–99, 2015. [17] B. Dai, Y. Zhang, and D. Lin, “Detecting visual relationships with deep relational networks,” in Proceedings of the 30th IEEE Conference on Computer Vision and Pattern Recognition, CVPR 2017, pp. 3298–3308, USA, July 2017. [18] R. Zellers, M. Yatskar, and S. Thomson, “Neural Motifs: Scene Graph Parsing with Global Context,” in Proceedings of the IEEE Conference on Computer Vision and Pattern Recognition (CVPR18, pp. 5831–5840, 2018. [19] X. Chen, L.-J. Li, and F.-F. Li, “Iterative Visual Reasoning Beyond Convolutions,” in Proceedings of the IEEE Conference on Computer Vision and Pattern Recognition (CVPR18, pp. 7239– 7248, 2018. [20] D. Xu, Y. Zhu, C. B. Choy, and L. Fei-Fei, “Scene Graph Generation by Iterative Message Passing,” in Proceedings of the 2017 IEEE Conference on Computer Vision and Pattern Recognition (CVPR), pp. 3097–3106, Honolulu, HI, July 2017. [21] H. Hu, J. Gu, and Z. Zhang, “Relation Networks for Object Detection,” in Proceedings of the IEEE Conference on Computer Vision and Pattern Recognition (CVPR18, pp. 3588–3597, 2018. [22] S. J. Hwang, S. N. Ravi, and Z. Tao, “Factorize and RegularizeRobust Visual Relationship Learning,” in Proceedings of the IEEE Conference on Computer Vision and Pattern Recognition (CVPR18, pp. 1014–1023, 2018. [23] C. Lu, R. Krishna, M. Bernstein, and L. Fei-Fei, “Visual Relationship Detection with Language Priors,” in Proceedings of the European Conference on Computer Vision (ECCV’15), pp. 852–869, 2015. [24] W. Liao, L. Shuai, and B. Rosenhahn, “Natural Language Guided Visual Relationship Detection,” https://arxiv.org/abs/ 1711.06032. [25] H. Zhang, Z. Kyaw, S. Chang, and T. Chua, “Visual translation embedding network for visual relation detection,” in Proceedings of the 2017 IEEE Conference on Computer Vision and Pattern Recognition (CVPR), pp. 3107–3115, Honolulu, HI, July 2017. [26] A. Newell and J. Deng, “Pixels to Graphs by Associative Embedding,” in Proceedings of the in Proceedings of the Neural Information Processing Systems (NIPS17, pp. 2168–2177, 2017. [27] S. Bai and S. An, “A survey on automatic image caption generation,” Neurocomputing, vol. 311, pp. 291–304, 2018. [28] J. Johnson, A. Karpathy, and L. Fei-Fei, “Densecap: fully convolutional localization networks for dense captioning,” in Proceedings of the 2016 IEEE Conference on Computer Vision and Pattern Recognition, CVPR 2016, pp. 4565–4574, USA, July 2016. [29] S. Banerjee and A. Lavie, “METEOR: An Automatic Metric for MT Evaluation with Improved Correlation with Human Judgments,” in Proceedings of the ACL Workshop on Intrinsic and
11 Extrinsic Evaluation Measures for Machine Translation and/or Summarization, pp. 65–72, 2005.
Advances in
Operations Research Hindawi www.hindawi.com
Volume 2018
Advances in
Decision Sciences Hindawi www.hindawi.com
Volume 2018
Journal of
Applied Mathematics Hindawi www.hindawi.com
Volume 2018
The Scientific World Journal Hindawi Publishing Corporation http://www.hindawi.com www.hindawi.com
Volume 2018 2013
Journal of
Probability and Statistics Hindawi www.hindawi.com
Volume 2018
International Journal of Mathematics and Mathematical Sciences
Journal of
Optimization Hindawi www.hindawi.com
Hindawi www.hindawi.com
Volume 2018
Volume 2018
Submit your manuscripts at www.hindawi.com International Journal of
Engineering Mathematics Hindawi www.hindawi.com
International Journal of
Analysis
Journal of
Complex Analysis Hindawi www.hindawi.com
Volume 2018
International Journal of
Stochastic Analysis Hindawi www.hindawi.com
Hindawi www.hindawi.com
Volume 2018
Volume 2018
Advances in
Numerical Analysis Hindawi www.hindawi.com
Volume 2018
Journal of
Hindawi www.hindawi.com
Volume 2018
Journal of
Mathematics Hindawi www.hindawi.com
Mathematical Problems in Engineering
Function Spaces Volume 2018
Hindawi www.hindawi.com
Volume 2018
International Journal of
Differential Equations Hindawi www.hindawi.com
Volume 2018
Abstract and Applied Analysis Hindawi www.hindawi.com
Volume 2018
Discrete Dynamics in Nature and Society Hindawi www.hindawi.com
Volume 2018
Advances in
Mathematical Physics Volume 2018
Hindawi www.hindawi.com
Volume 2018