J Neurophysiol 104: 902–910, 2010. First published May 26, 2010; doi:10.1152/jn.01014.2009.
Deficits in Action Selection Based on Numerical Information After Inactivation of the Posterior Parietal Cortex in Monkeys Hiromasa Sawamura,1,2 Keisetsu Shima,1 and Jun Tanji1,3 1
Department of Physiology, Tohoku University School of Medicine, Sendai; 2Department of Ophthalmology, Tokyo University School of Medicine; and 3Brain Science Research Institute, Tamagawa University, Tokyo, Japan Submitted 19 November 2009; accepted in fianal form 21 May 2010
Sawamura H, Shima K, Tanji J. Deficits in action selection based on numerical information after inactivation of the posterior parietal cortex in monkeys. J Neurophysiol 104: 902–910, 2010. First published May 26, 2010; doi:10.1152/jn.01014.2009. A previous study identified neuronal activity in area 5 of the monkey posterior parietal cortex that reflects the numerosity of a series of self-performed actions. It is not known, however, whether area 5 is crucially involved in the selection of an action based on numerical information or, instead, merely reflects numerosity-related signals that originate in other brain regions. We transiently and focally inactivated area 5 to test its functional contributions to numerosity-based action selection. Two monkeys were trained to either push or turn a handle in response to a visual trigger signal. The selection of the action was solely based on numerical information from a series of actions performed by the monkey: select A five times, select B five times, and then return to A in a cyclical fashion. When muscimol was applied to a portion of area 5 in which the activity in the numerosity-selective cells was recorded, the error rate in the selection task increased significantly. This transient neural inactivation also caused omission errors that were not observed before the muscimol injection. A control task showed that the errors were not caused by motor deficits or impaired ability to select between two possible actions. Our results indicate that area 5 is crucial for selecting actions on the basis of numerical information about a series of actions performed by the tested individual. INTRODUCTION
Cortical area 5 in the superior parietal lobule has traditionally been thought to integrate somatosensory information (Duffy and Burchfiel 1971; Hyvärinen 1982; Sakata et al. 1973) and to provide sensorimotor guidance for motor behaviors (Ashe and Georgopoulos 1994; Ferraina and Bianchi 1994; Kalaska et al. 2003). Area 5 has also been implicated in motor selection or goal-directed control of motor behavior, including visuomotor guidance (Crammond and Kalaska 1989; Kalaska 1996). Furthermore, neuronal activity in area 5 represents certain spatiotemporal information that is required to achieve intended actions; this information includes kinematic attributes of motor outputs (Hamel-Pâquet et al. 2006; Kalaska et al. 1990), haptic information that is retained for seconds before motor selection is executed (Koch and Fuster 1989), centrally generated representations of the goals or metrics of intended movements (Kalaska 1996), and the location of potential motor targets (Kalaska and Crammond 1995). On the other hand, we examined neuronal activity in area 5 (Sawamura et al. 2002) while monkeys were required to perform one of two movements (push or turn a handle). In that Address for reprint requests and other correspondence: J. Tanji, Tamagawa University, Brain Science Research Institute, 6-1-6, Tamagawa Gakuen, Machida, Tokyo, 194-8610, Japan (E-mail:
[email protected]). 902
study, the selection of the correct movement was based solely on a numerically defined sequence of self-executed motions— for instance, select movement A five times, followed by movement B five times, and then return to movement A in a cyclic manner. We found that neuronal activity in area 5 reflected the numerosity of the executed movement. The representation of numerical information in the parietal cortex was first identified in humans (Cohen Kadosh et al. 2007; Dehaene et al. 1999; Eger et al. 2003; Naccache and Dehaene 2001; Piazza et al. 2004; Pinel et al. 2004). Numerosity representation of visual objects has also been observed in the posterior parietal cortex (the fundus of the intraparietal sulcus; Nieder and Miller 2004; Nieder et al. 2006) and the lateral intraparietal area (Roitman et al. 2007) in subhuman primates. In the study by Nieder and Miller (2004), monkeys were required to enumerate a set of visual objects presented on a screen and then perform a delayed match task based on the numerosity. In contrast, in our previous study, the numerosity of movements performed by the individuals themselves had to be determined and remembered. Therefore cortical area 5 representation of the number of self-movements may be crucial for selecting the correct movement. If this hypothesis is correct, inactivation of area 5 will impair performance in motor tasks that require motor selection based on numerical information describing a series of selfmovements. In the present study, we found that the monkeys exhibited signs of difficulty in performing a numerosity-based motor task after transient, chemical inactivation of area 5. METHODS
Subjects Two male Japanese monkeys (Macaca fuscata, 6 and 8 kg) served as the subjects in this study. These monkeys were also used in a previously reported study (Sawamura et al. 2002). All animal care and experimental procedures were conducted in accordance with the National Institutes of Health Guide for the Care and Use of Laboratory Animals, and the Guidance for Institutional Animal Care and Use published by our institute.
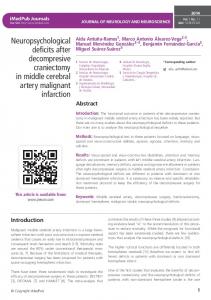
Behavioral procedures The behavioral task we used in this study is presented schematically in Fig. 1A. The monkeys were trained to hold a handle using their right arm in a fixed position. One second later, a low tone signaled the beginning of the waiting period, after which a visual movement trigger signal was presented with a light-emitting diode. The monkeys had to choose to perform one of two movements: TURN or PUSH the handle. After performing the correct movement, the monkey was rewarded with a drop of fruit juice after a 0.5-s delay. The correct movement was unchanged for a block of five trials, such that the
0022-3077/10 Copyright © 2010 The American Physiological Society
www.jn.org
NUMERICAL-PROCESSING DEFICITS AFTER AREA 5 INACTIVATION
903
A Time course of trials Wait 75s 1.4 1 4 − 7.5
Start
E h ttrial Each i l
ITI
Go
Movement
Reward
L Low T Tone
Time Ti
B
3 4 5 1
1 2
Trial blocks (20−46 s) (20−
3
2
TURN
4
5
1 2 3 4 5 TURN
PUSH
Definition of correct & error trial blocks m1
Correct
m2
w1
w2
w1
m4
w3
m1 Premature Prematureshift
m3
m2 w2
m5
w4
w5
m3
m4
w3
w4
M Movement t shift hift w1 m5
Movement shift
w5
w5
w1
FIG. 1. Explanation of behavioral task and the sequence of events in correct and error blocks. A: a diagram showing behavioral events constituting each trial (top) and the sequence of occurrences of trials requiring either TURN or PUSH in each block of 5 trials (bottom). B: the definition of a correct trial block and each of error blocks as depicted in the sequences of successive trials. Monkeys were rewarded after the execution of each correct movement (m1–m5) following each of the waiting periods (w1–w5). If the monkeys made a premature movement shift in response to the 5th wait signal (w5) or earlier, they were not rewarded. In that case, an error signal was given. No reward was given after the 6th movement (m6) in the late-shift block, which prompted the animals to shift to an alternative movement.
Error signal m1 Late-shift
w1 1
m2 w2 2
m3 w3 3
m4 w4 4
m5 w5 5
m6 w1 1
w1 1
monkeys were required to serially execute the same movement. After performing each block of five trials, the monkeys had to choose to perform an alternative movement without external instructions and repeat that movement during the next block of five trials. To prevent the monkeys from selecting the movement based on the length of the waiting period, the waiting period varied unpredictably from 1.4 to 7.5 s. As a result, the total time for one block of trials varied in the range of 20–46 s. Premature selection of the alternative movement before completing a block of five trials was defined as a “premature-shift error” (Fig. 1B) and resulted in an auditory error signal. Thus the monkeys had to select and perform the correct movement until the block of five trials
A
Movement shift
was completed correctly. “Late-shift errors” occurred when the monkeys failed to switch to the alternative movement and repeated the same movement six times. After these errors, the monkeys were not rewarded following the last trial, which prompted the subjects to perform the alternative movement in the next trial. “Limit-over errors” occurred when the subject did not perform the required movement within 4 s of the movement-trigger signal, at which point the trial ended and the next trial started; the monkeys continued performing the correct movement until a block of five trials was completed. The success rate was calculated as the ratio of the number of correct blocks divided by the number of total blocks.
B
C
D
E
40 imp/s
30 imp/s
20 imp/s
20 imp/s
1st
Neuronal response
2nd
3rd
4th
30 imp/s
5th 0.5 s : Trial start
: Movement trigger
FIG. 2. Examples of numerosity-selective activity from cells recorded in area 5. The cells displayed in columns A to E exhibited selectivity to the 1st, 2nd, 3rd, 4th, and 5th trials, respectively, during a correct block of either the PUSH (A and D) or TURN (B, C, and E) movements. Cellular activity is displayed as spike density histograms constructed from the data obtained in 10 trials, using 50-ms bins. The activity histograms are significantly tuned to a particular numerosity of a trial (black). Activity was aligned with the onset (triangles at left) or with the end (arrows at right) of the waiting period, depicted along the abscissa. Each unit along the ordinate represents 20, 30, or 40 spikes/s as indicated. Scale bar: 500 ms.
J Neurophysiol • VOL
104 • AUGUST 2010 •
www.jn.org
H. SAWAMURA, K. SHIMA, AND J. TANJI
At a stage when the monkeys were proficient in the trained behavioral task, we examined the effect of the length of the cumulative waiting time during each trial block on the success rate of the behavioral performance. For this purpose we examined the relationship between the time interval from the beginning of the first wait signal to the end of the fifth waiting time and the correct performance rate. We found that the two variables were not correlated (P ⬎ 0.1 by linear regression analysis) in either of the two monkeys. This analysis made it unlikely that the monkeys used time as a cue to trial position.
Data analysis We analyzed cellular activity during the waiting period and perimovement period (200 ms preceding and 250 ms following the onset of either PUSH or TURN movement). We judged a cell as task-related if its activity during either the waiting period or the perimovement period showed significantly higher discharge rates (P ⬍ 0.05, Mann– Whitney U test) from that during the control period (500 ms before the onset of the waiting time). Subsequently, we performed a two-way ANOVA for each of the task-related activities, looking at two factors: ordinal number of trials in each block for a particular movement (first through fifth) and the type of movement (PUSH or TURN). When the cells showed the main effect of ordinal number of trials or interaction between the ordinal number and type of movement, the activity was classified as ordinal number selective. Where appropriate, individual data classed as number-selective activity were compared directly using Tukey’s test (for details, see Sawamura et al. 2002). Throughout the pre- and postinjection periods, success and error rates, reaction times (RTs), and movement times (MTs) were measured. The RT was defined as the interval between the appearance of the movement trigger signal and the onset of movement (the time when the handle moved out of the hold range) in the correct direction for the required task. The MT was defined as the interval from the onset of movement until the required motor target was attained. These variables were statistically analyzed using appropriate statistical tests as described in the following text (ANOVA).
Movement selection in an auditory cue task In a control experiment, we used an auditory stimulus to instruct one of the subjects to select and execute one of two movements and performed this experiment with the monkey subjected to the muscimol inactivation protocol. A high tone signal (1 kHz, 300 ms) was presented at the beginning of the waiting period to signal the subject to perform the alternative movement (the movement that was different from a previously performed movement), irrespective of the numerosity of the trials in the block. The trial containing the auditory signal was redefined as the first trial in a new block and the subject began a new block of five trials. RESULTS
After training, the daily success rate for task performance by both monkeys was ⬎76%. Single-cell activity was recorded from three hemispheres in two monkeys. There were 548 task-related cells in monkey A recorded bilaterally and 364 cells in monkey B recorded unilaterally (contralaterally to the performing limb). They exhibited significantly different discharge rates (P ⬍ 0.05, Mann–Whitney U test) during the waiting period compared with the control period (500 ms before the onset of the waiting period). Among these cells, 181 cells from monkey A (33%) and 117 cells from monkey B (32%) showed activities that reflected the numerosity of a series of self-movements. That is, two-way ANOVA revealed
A
1.0
0.8
Normalized activity
904
Muscimol administration
0.6
0.4 1 st 2 nd 3 rd 4 th 5 th
0.2
J Neurophysiol • VOL
0 1
B 50
Percentage of cells
After completing the behavioral training, single-cell activity was recorded from the parietal cortex using standard electrophysiological techniques (Sawamura et al. 2002; Shima and Tanji 1998a). Subsequently, a small area of the cortex was transiently inactivated using 5 g/L muscimol (Sigma), a ␥-aminobutyric acid receptor agonist, dissolved in 0.1 M phosphate buffer (pH 7.4). The details for preparing muscimol and the injection technique have been described previously (Shima and Tanji 1998b). Muscimol was injected at a rate of 0.1 L/min through a pair of sharpened stainless steel tubes (ID, 150 m; OD, 300 m). A millimeter scale was visible on the surface of the injection tube at the time of insertion to determine the depth of penetration into the dura. An Elgiloy microelectrode (50- to 80-m shaft diameter) was attached to the side of the injection tube such that its tip was within 0.5 mm of the tip of the injection tube. The microelectrode allowed us to monitor the approximate depth at which the injection tubes penetrated the cortex and to detect when the muscimol silenced neuronal activity in the area. The injections were made at a depth of 2.5 mm from the surface in the banks of the intraparietal sulcus (IPS) and in the adjacent convexity, but not in the white matter. In each daily session, the injection tube was inserted into the desired hemisphere(s) and behavioral data were collected for 30 min (preinjection period). Subsequently, 3 L of muscimol solution or 0.1 M phosphate buffer was injected through the tube into the cerebral cortex for 30 min. After completing the injection, behavioral data were collected for 90 min.
2
3 4 Ordinal number of trials
5
%
40 30 20 10 0 1
2
3
4
5
Preferred ordinal numbers FIG. 3. A: response properties of cells with exclusive selectivity to one of the 5 numerical positions. Mean values of normalized activity, calculated for each category of cells judged to be selectively active during one of the 1st to 5th waiting periods, are plotted against the ordinal number of trials. Activity is normalized relative to the maximal activity at most favorable number of trials. Vertical bars denote SEs. B: distributions of preferred ordinal numbers for the waiting periods, calculated for all cells that exhibited selective activity during one or more of 5 waiting periods.
104 • AUGUST 2010 •
www.jn.org
NUMERICAL-PROCESSING DEFICITS AFTER AREA 5 INACTIVATION
numerosity selectivity was distributed among all of the five numerical positions, although most frequent for the first (27%). The numerosity-selective cells were concentrated in the anterior bank of the IPS and in its anteriorly adjacent convexity. On the other hand, we detected fewer numerosity-selective cells in the bank or the convexity posterior to the IPS. The distribution of the numerosity-selective cells (including both cells showing selectivity during only one of the five numerical positions and cells with selectivity during more than one period) is displayed in Fig. 4. The sizes of the filled circles indicate the number of cells exhibiting numerosity-selective activity at each penetration position. The focal area was 5 mm wide, spreading anteriorly from the IPS. Each penetration reached ⬍4 mm from the surface when the selective cells were observed. Deeper penetrations revealed an abrupt decrease in the number of cells showing task-related activity. Numerosityselective cells were situated primarily in the convexity and not in the banks of the IPS. We also examined somatosensory responses of the cells in this region. Prominent responses were obtained by touching or stroking the skin, pressing on muscles, or manipulating limb joints, characteristic of responses in the superior parietal lobule (Iwamura 2000; Sakata et al. 1973). At
that these 298 cells showed the main effect of ordinal number of trials or interaction between the ordinal number and type of movement. Subsequent analysis of the 298 cells revealed that 51% of the numerosity-selective cells showed activity during more than one of the five waiting periods in a block of trials. On the other hand, 49% of the cells displayed this selectivity during only one of the five potential numerical positions in a block. Examples of this exclusive relationship to a numerical position are presented in Fig. 2. The increased activities of the cells were observed at the onset of the waiting period (triangles in Fig. 2, C and E) or at the end of the waiting period (i.e., at the onset of the movement trigger signal; arrows in Fig. 2, A, B, and D). Two-way ANOVA (movement and numerosity as factors: P ⬍ 0.05) and pairwise Tukey’s tests (P ⬍ 0.05) revealed that each cell depicted in the panels from A to E was tuned to the first, second, third, fourth, and fifth trial in the task block, respectively. The tuning function for cells with such exclusive selectivity to one of the five numerical positions is presented in Fig. 3A (n ⫽ 146). In the next analysis, we examined the proportions of numerosity selectivity as a function of numerical position for all of the numerosity-selective cells (n ⫽ 298). As displayed with the histogram in Fig. 3B, the
A
Ipsilateral
Contralateral CS
CS
IPS
IPS
IPS
IPS
STS
STS
dorsal
dorsal rostral
B
rostral 2 mm
2 mm
Contralateral CS
IPS
IPS STS
FIG. 4. Cortical maps indicating sites of recorded cells and injections in both hemispheres of one monkey (A) and in one hemisphere of the other (B). A lateral view of each hemisphere is displayed in the top of each panel and the regions marked with dotted circles in each hemisphere are enlarged in the bottom of each panel. The sizes of the filled circles indicate the number of numerosity-selective cells recorded at each site. Numerosity-selective cells were not found at sites marked with horizontal bars. Red circles and bars indicate sites affected and not affected by muscimol injections, respectively. Blue circles denote injection sites of vehicle only. Contralateral hemisphere refers to the hemisphere located contralateral to the taskperforming limb. CS, central sulcus; IPS, intraparietal sulcus; STS, superior temporal sulcus.
number of cells 0 1 2-3 >4
Muscimol : effect (+) dorsal rostral
905
Muscimol : effect (-) Phosphate buffer
2 mm
J Neurophysiol • VOL
104 • AUGUST 2010 •
www.jn.org
906
H. SAWAMURA, K. SHIMA, AND J. TANJI
recording sites corresponding to the muscimol-injection region, receptive fields were primarily found in the forearm, upper arm, shoulder, and less frequently in the back. In addition to these response properties, subsequent histologic analysis indicated that the recorded task-related cells were in area 5 (Sawamura et al. 2002). To transiently inactivate this area, muscimol was injected into six sites bilaterally in monkey A (red circles or bars in Fig. 4) and into four sites contralaterally in monkey B. All of the injection sites overlapped with the region in which the numerosity-selective cells were concentrated. We used the following criteria to determine whether the muscimol was effective. First, the success rate during the preinjection period had to be ⬎76%. Second, the success rate during at least one of the 30-min evaluation intervals during the postinjection period had to be significantly lower than the rate observed during the preinjection period for that session (P ⬍ 0.01, Fisher’s exact test). If the behavioral data from an injection session fulfilled these criteria, the injection was determined to be effective. Muscimol was found to be effective at five of six sites receiving bilateral injections and at three of four sites receiving a unilateral injection (red circles in Fig. 4). Subsequent analysis of the injection effects was performed using data obtained at these sites. The effects of the injections at the other sites on task performance were weak and were not statistically significant (red horizontal bars). We also injected muscimol into the inferior parietal cortex at four sites bilaterally and three sites unilaterally. None of these injections significantly affected task performance (red horizontal bars in Fig. 4; P ⬎ 0.5, Fisher’s exact test). We analyzed the time course of the injection effects by plotting time-dependent changes in the success rates after the injections. The mean success rates obtained during each 30min evaluation period after bilateral injections are displayed in Fig. 5 (solid line). The success rate during the preinjection period was ⬎75% and decreased to ⬍60% during the postinjection period (P ⬍ 0.01, Fisher’s exact test). This effect lasted for ⬎90 min. A similar effect was observed with unilateral 100
Success rate (%)
80
60
40
Muscimol (Bilateral) Muscimol (Unilateral) Phosphate Buffer
0 0
30
60
90
120
Time after muscimol injection (min) FIG. 5. The time course of the mean success rate every 30 min with bilateral injections (solid line) and unilateral injections of muscimol (interrupted line). * indicates points at which the success rate was significantly lower than that observed during the preinjection period (P ⬍ 0.01, Fisher’s exact test). The dotted line denotes results obtained with vehicle injections. “0” on the abscissa indicates the onset of injection. Error bars indicate SD. Numbers in the abscissa indicate the center of the time period of 30 min during which the success rate was calculated.
J Neurophysiol • VOL
injections (interrupted line). In contrast to the bilateral injections, however, the success rate with unilateral injections tended to recover 60 min after the injection. To assess the duration of effect of a unilateral injection of muscimol, we calculated the success rate during each 10-min interval from the onset of the injection. The success rate was significantly lower (P ⬍ 0.05, Fisher’s exact test) in the period from 30 to 60 min after injection onset, whereas the decrease was not significant during the period from 60 to 120 min after injection onset (P ⬎ 0.1, Fisher’s exact test). To examine the possibility of nonspecific effects of a topical injection of fluid into the cortex during a behavioral task, we injected the same volume of vehicle solution at three sites bilaterally and two sites unilaterally near the sites of the muscimol injections (blue circles in Fig. 4). The results are shown with a dotted line in Fig. 5. The success rates remained ⬎75% throughout the sessions, indicating that the administration of vehicle did not affect task performance (P ⬎ 0.5, Fisher’s exact test). This control study confirmed that the effects on task performance were due to chemical inactivation of area 5. We then performed a more detailed assessment of the time course of errors after muscimol injections. To visualize the time courses across successive trial blocks after injections, we calculated the cumulative number of error blocks (blocks in which errors occurred) relative to the number of error blocks that occurred during the corresponding blocks after vehicle injection. In Fig. 6, we plotted the cumulative error blocks against the number of blocks after the injection along the abscissa. The data after the bilateral injection (Fig. 6A) revealed that 38 to 62 blocks postinjection of muscimol, the number of error blocks exceeded the mean ⫹ 3SDs of the number of error blocks observed following vehicle injections (dotted line in Fig. 6), indicating that errors increased about 30 min after the onset of injection. Thereafter, the error blocks continued to increase during the 120-min postinjection epoch of data analysis. After the unilateral injection (Fig. 6B), the error blocks increased at similar postinjection epochs, although the increase reached a plateau at 100 –150 blocks after the injection onset. We also examined different types of errors. Both monkeys committed premature-shift errors and late-shift errors. These types of errors increased during the postinjection period such that the ratio of premature-shift errors versus late-shift errors did not differ from that observed during preinjection or vehicle-injection periods (Fig. 7; P ⬎ 0.5, Fisher’s exact test). This finding made it unlikely that the monkeys adopted vastly different strategies for selecting movements based on the numerosity of the actions. On the other hand, we observed some error types exclusively after the muscimol injections. First, both monkeys committed “limit-over errors,” which constituted 23% of the total postinjection errors (11% of the entire trial blocks during the postinjection period). In the limit-over error trials, the subjects failed to initiate either movement within 4 s of the movement-trigger signal. In 42% of these cases, the limit-over trial was the second or third trial within a trial block, whereas 58% occurred during the fourth or fifth trial. The subjects did not commit limit-over errors during vehicle injections. Second, ⬎10% of the premature-shift errors by both subjects were committed early in the trial block (at the second or third trials in a block). This is noteworthy because
104 • AUGUST 2010 •
www.jn.org
NUMERICAL-PROCESSING DEFICITS AFTER AREA 5 INACTIVATION
907
Relative number of accumulated error blocks (Muscimol - Vehicle)
A Bilateral injection 40
Case 1 Case 2 Case 3 Case 4 Case 5
20
-10 -50
0
50
100
FIG. 6. The time course of the cumulative number of error blocks relative to the number of error blocks that occurred during the corresponding blocks with vehicle injections. Each colored line represents an effective muscimol injection. The black dotted lines indicate ⫾ 3 SDs for the cumulative sum of error blocks with vehicle injections. The numbers displayed below the abscissa indicate the number of blocks after injection onset. A: data for each of 5 successive muscimol injections (cases 1–5) into the bilateral area 5. B: data for each of 3 unilateral injections (cases 1–3) that was effective.
150
Onset of injection
Task progress (number of blocks after injection)
Relative number of accumulated error blocks (Muscimol - Vehicle)
B Unilateral injection 40
Case 1 Case 2 Case 3
20
-10 -50
0
50
100
150
Onset of injection
Task progress (number of blocks after injection)
during the preinjection periods, such early errors did not occur, neither during trials after vehicle injections. We performed a control experiment to examine whether the subject was able to select and perform the proper movement Pre-injection of muscimol
Postinjection of muscimol
Phosphate buffer
20%
10%
0% premature shift
late shift
limit over
FIG. 7. The distribution of error types observed during the preinjection period (left), during the postinjection period (middle), and with vehicle (phosphate buffer) injections (right). The percentage of occurrence of errors belonging to each of the 3 categories is taken in the ordinate. The epoch of 30 –120 min after the injection onset was used to generate the data in this figure.
J Neurophysiol • VOL
based on any external signal, despite focal inactivation of area 5. Under the control conditions, the monkey was required to respond to an auditory signal by always selecting a different movement from the previously performed action. The success rate after muscimol injections was 96.3% (n ⫽ 27), which was similar to that observed with vehicle injection (93.3%, n ⫽ 30; P ⬎ 0.5, Fisher’s exact test). This finding indicated that the monkey was able to select and perform a movement based on an external cue. We then compared MTs for the behavioral task during the preinjection and postinjection periods. The MTs during the two periods did not differ significantly (P ⬎ 0.1, Mann–Whitney U test; Table 1). We also analyzed RTs during the preinjection and postinjection periods. For the monkey receiving bilateral injections, the RTs during the postinjection period were significantly longer than those during the preinjection period (P ⬍ 0.001, Mann–Whitney U test; Table 1). In a similar comparison, RTs after vehicle injection (282.9 ms for the PUSH task and 265.2 ms for the TURN task) were not markedly altered (P ⬎ 0.1, Mann–Whitney U test). We then performed a
104 • AUGUST 2010 •
www.jn.org
908 TABLE
H. SAWAMURA, K. SHIMA, AND J. TANJI
1. Comparison of movement times and reaction times Movement Time for the TURN Task
Movement Time for the PUSH Task
Monkey
Preinjection
Postinjection
Preinjection
Postinjection
With bilateral injections With unilateral injections
29.2 ⫾ 0.22 27.4 ⫾ 0.38
30.6 ⫾ 0.19 26.6 ⫾ 0.26
46.3 ⫾ 0.26 51.8 ⫾ 0.60
45.7 ⫾ 0.17 50.7 ⫾ 0.41
Reaction Time for the TURN Task
Reaction Time for the PUSH Task
Monkey
Preinjection
Postinjection
Preinjection
Postinjection
With bilateral injections With unilateral injections
266.5 ⫾ 2.9 256.5 ⫾ 2.2
381.0 ⫾ 8.8* 251.8 ⫾ 1.2
281.3 ⫾ 1.8 278.1 ⫾ 2.5
401.3 ⫾ 7.5* 276.5 ⫾ 1.4
Values are means ⫾ SE, times are in milliseconds. *Indicates statistical significance (P ⬍ 0.01, Mann–Whitney U test).
detailed analysis of the RTs during the postinjection period to identify systematic alterations as the monkey progressed through the five trials in a block (Fig. 8). RTs became longer as the number of trials increased (P ⬍ 0.001, ANOVA). In particular, RTs for the fourth and fifth PUSH trials were significantly longer than those observed in the first, second, and third PUSH trials. Similarly, a progressive increase was also observed in the RTs as the monkey progressed through the TURN trials, particularly when the RTs from the third, fourth, and fifth trials were compared with the RTs from the first and second trials. During the preinjection period for both movements, RTs did not increase significantly as the trials progressed (P ⬎ 0.5, ANOVA). For the control experiment, we analyzed RTs in trials performed with an auditory cue. The postinjection RTs were 285 ms for the PUSH trials and 267 ms for TURN trials, which were not significantly different from the data obtained during the preinjection period (P ⬎ 0.2, Mann–Whitney U test).
These findings indicate that area 5 is necessary for the selection of a movement based on numerical information about a series of actions. Although cortical area 5 of the posterior parietal cortex has traditionally been viewed as an association cortex that is involved in integrating somatosensory information (Hyvärinen 1982; Sakata et al. 1973), this area also plays an important role in sensorial guidance of motor behavior (Kalaska 1996). Perception and introspective awareness of body form and posture provide the basis for execution and monitoring of movements. Moreover, a variety of sensory information that is useful for guiding and/or adjusting movements is thought to be encoded in cortical area 5. Neuronal activity in this area is strongly coupled to the position of the arm and the direction of reaching movements (Kalaska et al. 1983, 1990; Lacquaniti et al. 1995; Scott et al. 1997). During the planning and execution of reaching movements, area 5 cells have been shown to encode movement kinematics, but not dynamics or kinetics (Crammond and Kalaska 1989; Hamel-Pâquet et al. 2006; Kalaska et al. 1990). When a subject was required to remember a sample object form to select the correct reach target, the information for haptic recognition of the object form was represented among area 5 cells (Koch and Fuster 1989). In another study, when a correct reach target was defined using a visual cue, area 5 cells reflected the appropriate direction of reach, suggesting a role for this area in visuomotor analysis during the guidance of arm movements (Kalaska and Crammond 1995). Thus the involvement of area 5 in somatomotor and/or visuomotor guidance of movements has been well established (Kalaska et al. 2003).
DISCUSSION
In this study, we found that focal inactivation of monkey area 5 with muscimol increased the error rate in a task that required the subjects to select and perform a movement based on the numerosity of a series of movements performed by individuals themselves. The lack of change in the monkeys’ MT during the postinjection period and the ability of the monkey to select and perform a given movement in response to an auditory cue despite muscimol injections suggested that the observed impairment was not due to difficulties in executing limb movements or in selecting between two movements. Reaction time for PUSH
ms
ms
600
Reaction time for TURN
: pre-injection FIG. 8. The reaction times (RTs) for each of 5 trials performed before (white bar) or after (gray bar) muscimol injections into the area 5 of monkey A performing the PUSH (left) or TURN (right) movement. * indicates statistically significant differences between trials (**P ⬍ 0.01 and *P ⬍ 0.05, post hoc Tukey’s test). Error bars indicate SE.
: postinjection 400
200
0
1st 2nd 3rd 4th 5th
1st 2nd 3rd 4th 5th
1
st
2
nd
3
rd
4
th
5
th
1
J Neurophysiol • VOL
st
2
nd
3
rd
4
th
5
th
104 • AUGUST 2010 •
www.jn.org
NUMERICAL-PROCESSING DEFICITS AFTER AREA 5 INACTIVATION
On the other hand, some evidence indicates that numerical information is also represented in the posterior parietal cortex. Both lesion and functional imaging studies suggest that numerical processing is supported by neural activity near the intraparietal sulcus in humans (Dehaene and Cohen 1997; Fias et al. 2003; Piazza et al. 2007; Simon et al. 2002). In monkeys, neurons primarily in the ventral intraparietal cortex (Nieder et al. 2004, 2006) and the lateral intraparietal area (Roitman et al. 2007) were shown to respond selectively to a specific number of elements when an array of visual objects was presented; both areas receive prominent inputs from visual association areas (Colby et al. 1993; Gamberini et al. 2009). In contrast, when monkeys were required to select a movement based on the numerosity of a series of self-actions, neurons in area 5, rather than area 7, exhibited numerosity selectivity to the movements (Sawamura et al. 2002). In that study, monkeys were trained to perform a behavioral task that required them to generate and retain information about the number of movements performed by monitoring the execution of individual movements. Under this condition, most of the numerosityselective activities were also selective for the movement performed (push or turn). In the present study, using the same animals and behavioral paradigm used in our previous study, we found that the monkeys committed errors when performing the numerosity-based behavioral task after focal inactivation of area 5. Two additional observations from the current study are worth mentioning here. First, after the focal inactivation, errors in selecting the correct movement increased significantly during the fourth and fifth trials in the block, but not during the first or second trial. Second, the RT was significantly longer during the fourth and fifth trials, but not during the first or second trial. These findings indicate that the inactivation impaired task performance, particularly when the requirement for accumulating and making use of numerical information was enhanced. Furthermore, the occurrence of “limit over” errors seems to suggest that the monkeys could not use the numerical information stored in memory (working memory). An alternative interpretation could be that muscimol injection caused memory impairment. There remains a possibility that chemical inactivation of area 5 gave rise to the degradation of the memory trace concerning the ordinal number of sensorimotor events. It is important to make a distinction between cortical areas required for the correct numerical ordering of motor behavior and areas involved in discriminating visual quantity of objects. Nieder et al. (2006) demonstrated that cells tracking the ordinal position of a sample and the cells tracking the cardinal value of a sample are overlapping, but are distinct populations within the posterior parietal cortex. It seems even more unlikely that area 5 cells tracking the ordinal position of an arm movement in a series would have much in common with cells discriminating visual arrays based on cardinality. Moreover, we have no intention of claiming that area 5 cells are involved in computing abstract numerical information. What we propose here is that the numerosity-selective neuronal activity provides useful information when selecting a forthcoming movement, suggesting a role for area 5 in providing numerical information during limb movements performed by the individuals themselves. This property may underlie primitive representations of numerosity that are common to subhuman primates and human infants (Dehaene 2009; Hauser J Neurophysiol • VOL
909
et al. 1996; Wynn 1992), which may develop into a mature understanding of numerical information in human adults with highly organized cortical networks (Dehaene et al. 1999; Eger et al. 2003; Piazza et al. 2004, 2007; Schuman and Kanwisher 2004). On the other hand, when numerical information in the posterior parietal cortex is needed, the ample anatomical connections to frontal motor areas (Matelli et al. 1998) could provide information that is required for selecting the appropriate action (Cisek and Kalaska 2005; Hoshi and Tanji 2006). ACKNOWLEDGMENTS
We thank Dr. M. Takada and Dr. E. Hoshi for valuable comments on the early version of this manuscript and M. Kurama and Y. Takahashi for technical assistance. GRANTS
This work was supported by Ministry of Education, Culture, Sports, Science and Technology of Japan Grants 19790162 and 20019011 to H. Sawamura and 16067101, 17021004, and 19300110 to J. Tanji. DISCLOSURES
No conflicts of interest, financial or otherwise, are declared by the author(s). REFERENCES
Ashe J, Georgopoulos AP. Movement parameters and neural activity in motor cortex and area 5. Cereb Cortex 4: 590 – 600, 1994. Cisek P, Kalaska JF. Neural correlates of reaching decisions in dorsal premotor cortex: specification of multiple direction choices and final selection of action. Neuron 45: 801– 814, 2005. Cohen Kadosh R, Cohen Kadosh K, Kaas A, Henik A, Goebel R. Notationdependent and -independent representations of numbers in the parietal lobes. Neuron 53: 307–314, 2007. Colby CL, Duhamel JR, Goldberg ME. Ventral intraparietal area of the macaque: anatomic location and visual response properties. J Neurophysiol 69: 902–914, 1993. Crammond DJ, Kalaska JF. Neuronal activity in primate parietal cortex area 5 varies with intended movement direction during an instructed-delay period. Exp Brain Res 76: 458 – 462, 1989. Dehaene S. Origins of mathematical intuitions: the case of arithmetic. Ann NY Acad Sci 1156: 232–259, 2009. Dehaene S, Cohen L. Cerebral pathways for calculation: double dissociation between rote verbal and quantitative knowledge of arithmetic. Cortex 33: 219 –250, 1997. Dehaene S, Spelke E, Pinel P, Stanescu R, Tsivkin S. Sources of mathematical thinking: behavioral and brain-imaging evidence. Science 284: 970 –974, 1999. Duffy FH, Burchfiel JL. Somatosensory system: organizational hierarchy from single units in monkey area 5. Science 172: 273–275, 1971. Eger E, Sterzer P, Russ MO, Giraud AL, Kleinschmidt A. A supramodal number representation in human intraparietal cortex. Neuron 37: 719 –725, 2003. Ferraina S, Bianchi L. Posterior parietal cortex: functional properties of neurons in area 5 during an instructed-delay reaching task within different parts of space. Exp Brain Res 99: 175–178, 1994. Fias W, Lammertyn J, Reynvoet B, Dupont P, Orban GA. Parietal representation of symbolic and nonsymbolic magnitude. J Cogn Neurosci 15: 47–56, 2003. Gamberini M, Passarelli L, Fattori P, Zucchelli M, Bakola S, Luppino G, Galletti C. Cortical connections of the visuomotor parietooccipital area V6Ad of the macaque monkey. J Comp Neurol 513: 622– 642, 2009. Hamel-Pâquet C, Sergio LE, Kalaska JF. Parietal area 5 activity does not reflect the differential time course of motor output kinetics during armreaching and isometric-force tasks. J Neurophysiol 95: 3353–3370, 2006. Hauser MD, MacNeilage P, Ware M. Numerical representations in primates. Proc Natl Acad Sci USA 93: 1514 –1517, 1996. Hoshi E, Tanji J. Differential involvement of neurons in the dorsal and ventral premotor cortex during processing of visual signals for action planning. J Neurophysiol 95: 3596 –3616, 2006.
104 • AUGUST 2010 •
www.jn.org
910
H. SAWAMURA, K. SHIMA, AND J. TANJI
Hyvärinen J. Posterior parietal lobe of the primate brain. Physiol Rev 62: 1060 –1129, 1982. Iwamura Y. Bilateral receptive field neurons and callosal connections in the somatosensory cortex. Philos Trans R Soc Lond B Biol Sci 355: 267–273, 2000. Kalaska JF. Parietal cortex area 5 and visuomotor behavior. Can J Physiol Pharmacol 74: 483– 498, 1996. Kalaska JF, Caminiti R, Georgopoulos AP. Cortical mechanisms related to the direction of two-dimensional arm movements: relations in parietal area 5 and comparison with motor cortex. Exp Brain Res 51: 247–260, 1983. Kalaska JF, Cisek P, Gosselin-Kessiby N. Mechanisms of selection and guidance of reaching movements in the parietal lobe. Adv Neurol 93: 97–119, 2003. Kalaska JF, Cohen DA, Prud’homme M, Hyde ML. Parietal area 5 neuronal activity encodes movement kinematics, not movement dynamics. Exp Brain Res 80: 351–364, 1990. Kalaska JF, Crammond DJ. Deciding not to GO: neuronal correlates of response selection in a GO/NOGO task in primate premotor and parietal cortex. Cereb Cortex 5: 410 – 428, 1995. Koch KW, Fuster JM. Unit activity in monkey parietal cortex related to haptic perception and temporary memory. Exp Brain Res 76: 292–306, 1989. Lacquaniti F, Guigon E, Bianchi L, Ferraina S, Caminiti R. Representing spatial information for limb movement: role of area 5 in the monkey. Cereb Cortex 5: 391– 409, 1995. Matelli M, Govoni P, Galletti C, Kutz DF, Luppino G. Superior area 6 afferents from the superior parietal lobule in the macaque monkey. J Comp Neurol 402: 327–352, 1998. Naccache L, Dehaene S. The priming method: imaging unconscious repetition priming reveals an abstract representation of number in the parietal lobes. Cereb Cortex 11: 966 –974, 2001. Nieder A, Diester I, Tudusciuc O. Temporal and spatial enumeration processes in the primate parietal cortex. Science 313: 1431–1435, 2006.
J Neurophysiol • VOL
Nieder A, Miller EK. A parieto-frontal network for visual numerical information in the monkey. Proc Natl Acad Sci USA 101: 7457–7462, 2004. Piazza M, Izard V, Pinel P, Le Bihan D, Dehaene S. Tuning curves for approximate numerosity in the human intraparietal sulcus. Neuron 44: 547–555, 2004. Piazza M, Pinel P, Le Bihan D, Dehaene S. A magnitude code common to numerosities and number symbols in human intraparietal cortex. Neuron 53: 293–305, 2007. Pinel P, Piazza M, Le Bihan D, Dehaene S. Distributed and overlapping cerebral representations of number, size, and luminance during comparative judgments. Neuron 41: 983–993, 2004. Roitman JD, Brannon EM, Platt ML. Monotonic coding of numerosity in macaque lateral intraparietal area. PLoS Biol 5: 1672–1682, 2007. Sakata H, Takaoka Y, Kawarasaki A, Shibutani H. Somatosensory properties of neurons in the superior parietal cortex (area 5) of the rhesus monkey. Brain Res 64: 85–102, 1973. Sawamura H, Shima K, Tanji J. Numerical representation for action in the parietal cortex of the monkey. Nature 415: 918 –922, 2002. Scott SH, Sergio LE, Kalaska JF. Reaching movements with similar hand paths but different arm orientations. II. Activity of individual cells in dorsal premotor cortex and parietal area 5. J Neurophysiol 78: 2413–2426, 1997. Shima K, Tanji J. Role for cingulate motor area cells in voluntary movement selection based on reward. Science 282: 1335–1338, 1998a. Shima K, Tanji J. Both supplementary and presupplementary motor areas are crucial for the temporal organization of multiple movements. J Neurophysiol 80: 3247–3260, 1998b. Shuman M, Kanwisher N. Numerical magnitude in the human parietal lobe; tests of representational generality and domain specificity. Neuron 44: 557–569, 2004. Simon O, Mangin JF, Cohen L, Le Bihan D, Dehaene S. Topographical layout of hand, eye, calculation, and language-related areas in the human parietal lobe. Neuron 33: 475– 487, 2002. Wynn K. Addition and subtraction by human infants. Nature 358: 749 –750, 1992.
104 • AUGUST 2010 •
www.jn.org