Defining elasticities for PMP models by estimating marginal cost functions based on FADN Data - the case of Swiss dairy production
Gabriele Mack and Stefan Mann Agroscope Reckenholz Tänikon Research Station ART Tänikon, CH-8356 Ettenhausen, Switzerland
[email protected]
Paper prepared for presentation at the 107th EAAE Seminar "Modelling of Agricultural and Rural Development Policies". Sevilla, Spain, January 29th -February 1st, 2008
Copyright 2007 by Gabriele Mack and Stefan Mann. All rights reserved. Readers may make verbatim copies of this document for non-commercial purposes by any means, provided that this copyright notice appears on all such copies.
Abstract The Swiss agricultural sectoral information and forecasting system (SILAS) is based on the PMP standard approach. The marginal cost functions are estimated by exogenous elasticities. Due to the lack of empirical data the elasticities were set for all activities to unity. Based on total milk production costs of FADN farms, regional supply functions were estimated. The results are used to adjust the marginal cost functions of organic and non-organic dairy cow activities in the model SILAS to the empirically estimated functions. The results show that the marginal cost functions in the sectoral model are in general a bit steeper than in the FADN estimations, when elasticities by the value one are applied. Major differences between organic and non-organic milk production could not be observed. Adjusting the slope of the marginal cost functions to the empirically estimated ones leads to slightly different forecast results. Mainly the number of organic cows is higher in the FADN adjusted scenario than in the reference scenario without any adjustments. Key words: Marginal cost function, milk production costs, PMP-based sectoral model
1. Introduction and objectives Howitt (2005) proposes the use of 'crop and factor specific prior estimates of factor demand elasticities to define the maximum entropy support values' for production functions. The practice of modelling, however, often suffers from missing information about factor prices and sometimes ending up estimating elasticities as unity. Wieck and Heckelei (2007) show how to estimate marginal product functions for dairy production functions. The Swiss agricultural sectoral information and forecasting system (SILAS) is based on the Positive Mathematical Programming (PMP) standard approach. The marginal cost functions are estimated by exogenous elasticities. Due to the lack of empirical data, linear functional forms were assumed for all plant and animal as well as for organic and non-organic production activities. Furthermore the elasticities were set for all activities to unity, because no empirically based elasticities for Switzerland are known. By comparing previous results of models analysing the development of organic and nonorganic milk production in Switzerland it is noticeable that especially organic production activities were underestimated. The problem of forecasting organic production activities in PMP-based models, which are characterized by a low production degree and high marginal costs, is well known and described in several publications (Offermann, 2003). Therefore Offermann (2003) proposes to modify the PMP-approach by calibrating the PMP-terms of organic production activities. In this study supply functions for milk production are estimated by using data from the Swiss Farm Accountancy Data Network (FADN) of three single years (1999, 2001, 2004). Organic and nonorganic milk production in the Swiss mountain and lowland region are chosen as entity. The supply functions for milk production describe the regional marginal cost functions. The results are used to improve the marginal cost functions of organic and non-organic dairy cow activities in the PMP-based Swiss model SILAS by adjusting them to the empirically estimated marginal cost functions.
2
In chapter 2.1, the estimation of the marginal cost functions based on FADN data is described. Chapter 2.2 is focussing on the Swiss agricultural sector model SILAS and the objective function. The third chapter shows empirical results on marginal costs in Switzerland for milk production. Furthermore, model results are shown for an improved data base. Finally the method is discussed with special emphasis on the impact to the model results.
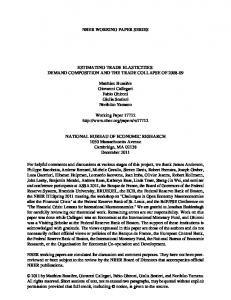
2. Methods 2.1 Estimation of marginal cost functions by using FADN data Milk supply functions for a whole region or a country can be estimated by assuming the following behaviour as described in Mann (2007). The dairy farm with the lowest production costs in a region (e.g. 0.6 CHF/kg) is producing 100 000 kg of milk, if the milk price is 0.6 CHF per kg. When the milk price rises by 0.1 CHF per kg, other farms with production costs of 0.7 CHF per kg will start producing milk on top of the existing production level. It is easily understandable that also the first farm will offer the milk at a price of 0.7 CHF per kg (Figure 1). Aggregating all dairy farms by increasing production costs the regional supply function can be derived. The supply function also describes the marginal cost function of milk production. 1 Milk price in CHF/kg
0.9 0.8 0.7 0.6 0.5 0.4 0.3 0.2 0.1 0 100 000
200 000
300 000
Regional milk production (kg)
Figure 1. Estimating regional milk supply functions by single farms To estimate marginal cost functions for dairy cows, FADN records of single farms are used. Due to the fact that most of the farms in Switzerland have a very low degree of specialisation, all FADN farms with dairy husbandry have been selected. In the year 2004 the Swiss FADN included 1558 milk producing farms in the mountain and lowland regions (Table 1). 211 farms were producing organic milk. In addition, for every single farm type in the FADN the total number of farms in Switzerland is known. Therefore the FADN data can be extrapolated to the regional level. In the year 2004 all milk producing farms in the FADN represented 21 358 farms in total (Table 1). The number of cows in the FADN was 29 206. This number represents in total 396 834 cows in both regions.
3
Farms producing ..... milk in ...... region organic
organic
non-organic
non-organic
mountain
lowland
mountain
lowland
Number of farms in FADN
147
64
357
990
Number of cows in FADN
2'059
1'299
5149
20'699
11'462
8'209
31'218
146'957
2'059
919
5581
12'797
30'272
17'284
79'200
270'178
169'459
107'000
479'196
1'867'959
Milk production in FADN (t) Total number of farms in Switzerland Total number of cows Total milk production (t)
Table 1. Number of dairy farms in the Swiss FADN and total number of farms in Switzerland in the year 2004 To define marginal cost functions for Swiss dairy farms, estimations about the total costs for milk production are required, including mixed farms. In the Swiss FADN farm records expenses for concentrates, veterinary services and veterinary products, artificial insemination, cattle insurance and cost for milk quota are available per single dairy cow. In contrast, labour costs, building and machinery costs are only available as a whole for each farm. This reflects the well known problem of how to split fixed costs in agriculture into single product lines (Fusfeld, 1972; Durgiai et al., 2005). We approach this problem by using different methods for labour and machinery costs. Regarding labour costs, the research group “Labour Economics” of Agroscope Reckenholz-Tänikon Research Station (ART) provides detailed labour requirements for nearly all farm products under typical Swiss conditions. With these figures, ‘Standard Labour Requirements’ for each farm were calculated based on the farm’s production portfolio, both for single products (SLR) and for the total farm (Farm Labour Requirements - FLR). The latter figure was compared with the total labour requirement (TLR) (both family and hired labour) of the farm as documented in its records so that L = TLR / FLR. Real labour requirements for single product lines (R) were subsequently estimated by R = L * SLR On a single-farm-level, it thus became possible to set labour requirements into relation both to the number of cows and to the amount of milk produced. In order to get from a minute per cow (kilogram) estimation to a monetary estimation, a rate of 24 CHF per hour was applied which is usually taken as a comparable wage to other sectors (Schnyder et al., 2003). Regarding building and machinery costs, standardized data based on average investment costs for Swiss farms were used. Five different herd sizes were considered in the calculations (Gazzarin and Hilty, 2002). The annual costs were derived by assuming an average useful life for buildings and 4
machinery in Switzerland and average interest rates. Therefore farm-size is considered as an important driving force for milk production costs. An overview of data sources to estimate marginal cost functions is given in Table 2. Data
Unit
Source
Concentrates
CHF/cow
FADN
Veterinary and veterinary products
CHF/cow
FADN
Artificial insemination
CHF/cow
FADN
Cattle insurance
CHF/cow
FADN
Cost for milk quota
CHF/cow
FADN
Machinery leasing and other costs
CHF/cow
FADN
Labour costs
CHF/cow
Building and machinery costs
CHF/cow
Number of cows
Heads/farm
Own calculations; Derived by combining FADN data and standard labour requirements Average annual cost per cow for a standardized building and equipment FADN
Milk production
kg/farm
FADN
Total number of a single FADN farm in Switzerland
Number of farms
AGRSOSCOPE ART
Table 2. Data sources to estimate marginal cost functions Regional marginal cost functions for organic and non-organic milk production in the Swiss lowland and mountain regions (CHF/cow; CHF/kg milk) are derived stepwise: 1) average costs per cow or per kg milk are calculated for every single FADN record. 2) the farm records are sorted by ascending average costs per region and production type. 3) for each FADN farm record the corresponding number of cows or the amount of milk production in the whole region was calculated. As a result, supply functions or regional marginal costs functions (MC) can be displayed by ascending number of cows or by ascending milk production in each region. MC = f ( x)
(Equation 1)
The functions were defined by assuming a linear form for each region [r] and production activity [j]. MCjr = ajr + bjr* xjr
(Equation 2)
The estimations were compared with the linear marginal cost functions in corresponding regions obtained from the PMP-based model SILAS. 2.2 The Swiss agricultural sector model SILAS 5
2.2.1 General description and objective function Agroscope Reckenholz Tänikon Research Station ART has developed and maintained the Swiss agricultural sectoral information and forecasting system (SILAS) on behalf of the Swiss Federal Office of Agriculture since 1996. The model is used as a decision support system in connection with budget funds planning for Switzerland’s agricultural sector. The system is also used to analyse the effects of new agricultural policy measures on regional and sectoral production, factor input and income in agriculture. The model SILAS is related to regionally differentiated process analysis models as developed by Henrichsmeyer et al. (1996). The model approach is characterised by modelling so-called “regional farms”, modelling all the interactions in production, input, production factor creation and production factor use. In the model, the sector is limited to the concept of agricultural accounting (cf. Jacobs, 1998). The Swiss SILAS model is based on regional farms which are assigned to eight production zones defined by increasing production difficulties and living conditions. This enables very accurate modelling of the Swiss direct payment system, which is characterised by graduated direct payment approaches and contribution restrictions based on defined agricultural regions. Furthermore, the relatively homogeneous production potential of single areas can be reflected in the model in a very realistic form, as most of the statistical data are available on a regional level. Various production inputs are optimised endogenously by the model, bearing in mind animal and plant physiological constraints: - input of concentrates and roughage in animal husbandry - preparation of roughage as hay, silage or fresh grass - application of fertilisers (mineral and organic) - labour-input comprising family members and non-family members Accounting equations at regional or sectoral level ensure domestic utilisation of all agricultural intermediate products. As Switzerland’s agricultural sector is cut off from the surrounding EU market for agricultural intermediate products, trade relations with other countries are not defined in the model. The optimisation is carried out according to the Positive Mathematical Programming (PMP) method (Howitt, 1995). The PMP-terms α and β are estimated by linear production costs, which include costs for veterinary services and products related to dairy cows, artificial insemination, cattle insurance, cost for milk quota and machinery leasing as well as other cost (Equation 3). To estimate the PMP-terms, exogenous elasticities are applied (Gocht, 2005) which, in the absence of exact values for Swiss agriculture, were defined as unity. Costs for labour, feeding, machinery, building and energy are included in the cost function by additional linear elements (Equation 3). Labour costs depend on the production activity’s requirements
6
for family and non-family labour. For family labour, opportunity costs of 12 to 8 CHF / h are assumed, for non-family labour, average salaries for agricultural employees. Constraints on the labour requirements and family labour capacity are included in the model to assure that labour requirements are fulfilled. Fodder costs depend on the feed intake and the cost of feeding stuff. For every animal daily fodder costs are minimized under the constraint of nutrition requirements. Regional machinery, building and energy costs are also minimized considering activity specific requirements. The mathematical model is:
Max Z = ∑ piz y zi + ∑ d jz x jz − ∑ lcz mcz − ∑ rqz s qz − ∑ wnz f nz iz
jz
cz
qz
− ∑ vkz u kz − ∑ α jz x jz − ∑ 0.5 x jz β jz x jz kz
jz
jz
nz
(Equation 3)
under the condition
∑ a jtz x jz ≤ btz j
yiz , x jz , u kz , mcz , s qz , f nz ≥ [0] Z = Objective function z = 1...8 (number of zones) p = Product price vector d = vector of direct payments y = vector of buying and selling activities x =vector of production activities (arable and livestock) u = vector of investment activities, v = vector of investment cost, k: type of investments l = vector of fodder costs; m: vector of feed intake; c: type of feeding stuff r = vector of labour costs; s: vector of labour requirements, q: type of labour (family or non-family labour) w = vector of energy costs; f: vector of energy requirements; n: type of energy input (electricity, Diesel fuel) a = coefficient matrix of requirements b = vector of resource available α = linear PMP-term β = quadratic PMP-term j = 1...n (number of production activities) i = 1...m (number of selling and purchase activities k = 1...r (number of investment activities)
Marginal cost functions (MC) for single production activities xjz represent the first derivative of the cost function in respect to x.
MC ( x )
zj
= α
jz
+ β
jz
x
jz
(Equation 4)
It is noticeable that the first derivative does not include feeding, building, nor machinery or labour costs, as long as they do not relate directly to the production activities. In order to make the marginal cost functions comparable with the empirically estimated FADN-functions, missing cost elements (CHF/cow) were assessed from the model results of the base year run. The results were integrated into the marginal function as absolute terms. The calculations base on the simplified assumption, that
7
feeding, building, machinery and labour costs do not change when the production level increases or decreases.
2.2.2 Data base The basic data for the regional input and output coefficients for arable land and livestock activities derive from the Swiss FADN and labour and technical standard data. As part of data preparation, a consistency check is carried out on all the regional coefficients against values from statistics for the sector (cf. Jacobs, 1998). Labour, feeding, machinery, building and energy costs per cow are calculated after the base year optimisation run. Agricultural administrative experts were consulted at specific intervals with regard to product and factor price changes. This procedure was adopted because to a great extent pricing of the principal Swiss products is affected by market support and tariff policy measures. Variables related to the development of technical progress are forecasted by trend extrapolation.
2.3 Adjusting the PMP-based marginal cost functions of the sectoral model SILAS to the FADN results The PMP-based marginal cost functions of the model in the base year were fitted to the empirically derived FADN functions by adjusting the slope β to the FADN results (b). Due to the calibration obligation in the base year, the PMP-term α is completely determined when the slope is known. The FADN functions were estimated only for the Swiss mountain and the lowland regions [r], while the model functions are related to production zones, which are smaller than the regions. Nevertheless, all production zones can be assigned to a defined region. Under the assumption that the marginal costs of a whole region are quite similar to the marginal costs of the zones within a region, the slope β can be adjusted to the FADN results:
β jz = brj
Equation 5
α jz = β jz ∗ xo jz − λ jz
Equation 6
z ∈r α = intercept of the marginal cost function β = slope of the marginal cost function xo = production level in the base year λ = dual value of calibration restrictions z = 1...8 (number of production zones) r = 1,2 (number of regions)
j = 1...n (number of production activities)
8
The impact on the model was tested by forecasting the number of organic and non-organic cows in the period starting 2005 until the year 2015. Two scenarios were defined: 1) Reference scenario: The marginal cost functions’ slope was defined by setting the elasticities to unity. 2) FADN scenario: The marginal cost functions’ slope of dairy cows was adjusted to the FADN estimations. In both scenarios political changes according to the Swiss agricultural policy 2011 were assumed (Mack and Flury, 2006). This means for milk production that the milk quota will be removed after 2009 and direct payments for dairy cows are paid to compensate the expected milk price reduction. The marginal cost functions for dairy cows were calibrated by including additional milk quota cost as suggested by Jansson and Britz (2002). The costs for milk quota were derived from FADN-data.
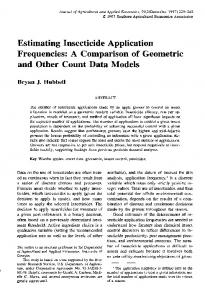
3. Results Based on total milk production costs of FADN farms, regional supply functions are estimated. The total costs include feeding, labour, building and machinery costs. The average milk production costs are much higher in the Swiss mountain region (1.50 CHF/kg) than in the lowland region (1.00 CHF/kg) due to higher labour costs. In the mountain region the FADN farm with the lowest total milk production costs of all FADN dairy farms showed 0.62 CHF/kg milk in 2004, while the highest costs by FADN farm were 5.30 CHF/kg. In the Swiss lowland region the FADN-farms with the lowest costs calculated 0.43 CHF/kg, while, at the most, the costs added up to 3.45 CHF/kg milk in the year 2004. Regional milk supply functions for the Swiss lowland and mountain region derived from aggregating milk production costs of all dairy farms in the year 2004 are given in Figure 2A. If comparable wages for labour in non-agricultural sectors (24 CHF/h) are assumed, in most cases the total production costs were higher than the milk price, which was 0.79 CHF/kg in 2004 (Figure 2A). Therefore it can be concluded that Swiss dairy farmers hardly realize the comparative wage of 24 CHF/h. To compensate higher labour costs in the Swiss mountain region, the farmers get additional direct payments. If lower labour costs are assumed, the milk production costs decrease strongly. Regional supply functions for milk production in the year 2004 by decreasing labour costs are given in Figure 2B. Supply functions for organic milk production in the Swiss mountain regions are given in Figure 2C. Since 1999 organic milk production increased by more than 50 %, although average production costs remained almost constant. For non-organic milk production the figures are almost the same. When estimating a linear functional form for the FADN based marginal costs, it has to be taken into consideration that the production costs of the FADN farms with the 10% highest costs are rather underestimated (Figure 2D).
9
5 Lowland region
4 3 2 1 0
C
500 1000 1500 2000 Milk production in Switzerland in 2004 (Mio. kg)
1999 2001
2004
3 2 1
Mountain region
5
Wage: 24 CHF/h
4 3
Lowland region
Wage: 12 CHF/h
2 Wage: 8 CHF/h
1 0 0
D
6
4
6
2500
Milk supply functions for organic farming
5
Milk supply functions by decreasing comparable wages for labour Production costs CHF/kg
6
0
Production costs CHF/kg
B
Milk supply functions based on comparable wages for labour (24 CHF/h) Mountain region
Production costs CHF/kg
Production costs CHF/kg
A
500 1000 1500 2000 Milk production in Switzerland in 2004 (Mio. kg)
2500
Linear trend estimations for milk supply functions 6 5 2001 4
2004
3 2 1 0
0 0
50 100 150 Organic milk production in the mountain region (Mio. kg)
200
0
50 100 150 Organic milk production in the mountain region (Mio. kg)
200
Figure 2: Regional supply functions for Swiss milk production estimated by using FADN data. To compare empirically estimated marginal costs of Swiss FADN farms with the marginal cost functions derived from the PMP method in the sectoral model SILAS, it is necessary •
that supply functions refer to livestock level (number of cows) rather than to absolute milk production, because the marginal costs functions in the activity based sector model SILAS are directly reflected by the number of cows.
•
that for both methods an equal level for labour costs (12 CHF/h in the lowland region and 8 CHF/h in the Swiss mountain region) is considered.
•
to assume a linear functional form for empirically estimated marginal costs when using FADN-farms.
The PMP-based marginal cost functions of the model are fitted to the FADN results by adjusting the slope to equal values. Figure 3 gives two examples how marginal cost functions of the model SILAS are adjusted to the FADN functions: a better adjustment can be achieved by changing the slope of the SILAS marginal costs function (Zone 2) in the lowland region, while the SILAS function of Zone 1 for organic farming can completely be adjusted to the FADN function.
10
B 16'000 SILAS Zone 2 12'000 FADN
8'000 4'000
SILAS Zone 2 FADN adjusted
0 0
100'000
200'000
Number of cows producing non-organic milk (lowland region)
300'000
Costs of milk production [CHF/cow]
Costs of milk production [CHF/cow]
A
16'000 12'000 SILAS Zone 1 8'000 FADN 4'000 SILAS Zone 1 FADN adjusted 0 0
5'000
10'000
15'000
20'000
Number of cows producing organic milk (lowland region)
Figure 3: Marginal cost functions for dairy cows derived from the model SILAS and from FADN data In Table 2 the empirical estimated functional form by FADN and the marginal cost functions of the model are given (before and after adjustment). Obviously, in both regions and production types adjustments to the FADN functional form are made. Adjustments are not more intense in organic production than non-organic production.
FADN SILAS Z1* SILAS Z2* FADN SILAS Z1* SILAS Z2* FADN SILAS Z7* SILAS Z8* FADN SILAS Z7* SILAS Z8*
Organic milk production in lowland region y = 0.2292x + 2521.5 R2 = 0.9104 y = 0.302x+2250 SILAS Z1 -FADN y = 0.229x+2554 y = 0.207x+2922 SILAS Z2 -FADN y = 0.229+2881 Non-organic milk production in lowland region y = 0.0132x + 2961.7 R2 = 0.902 y = 0.0203x + 675 SILAS Z1 -FADN y = 0.0132x + 1373 y = 0.04683x + 703 SILAS Z2 -FADN y = 0.0132x + 2173 Organic milk production in mountain region y = 0.1078x + 2778.9 R2 = 0.9514 y = 0.13949x + 3051 SILAS Z7 -FADN y = 0.1078x + 3350 y = 0.23442x + 3105 SILAS Z8 -FADN y = 0.1078x + 3527 Non-organic milk production in mountain region y = 0.0486x + 2697.9 R2 = 0.7574 y = 0.04837x + 2818 SILAS Z7 -FADN y = 0.0486x + 2814 y = 0.12829x + 3105 SILAS Z8 -FADN y = 0.0486x + 3321
*Marginal cost functions of the model SILAS based on elasticity = 1.
Table 2: Marginal cost function for dairy cows after adjustment to empirically estimated FADN functions The results were tested by forecasting the number of organic and non-organic cows from 2005 until the year 2015. The reference scenario (Ref-Sc), which is defined by PMP-based marginal cost functions based on elasticities by unity, is compared with the FADN scenario (FADN-Sc), in which the FADN adjusted marginal cost functions are applied. The development of values in the past and the model results are given in Figure 4 and Figure 5. Due to the milk quota, the total number of dairy cows was decreasing from 1996 to 2004 by 17 % in the lowland region and by 13 % in the mountain region.
11
In the same period the number of organic dairy cows strongly increased by 72 % in the lowland region and by 165 % in the mountain region. The forecast shows that the removal of the milk quota in 2009 does not lead to an increase in the number of dairy cows in the lowland region. Therefore it is concluded that the milk price reduction can only partly be compensated by direct payments for dairy cows. According to the model results a decrease in organic milk production is expected in the lowland region after the removal of the milk quota regime. Also, the adjustment of the marginal cost functions in the lowland region to the FADN functions does not lead to different model results apart from the number of organic dairy cows, which slightly increases in the FADN scenario.
Number of cows (% of 1996=100 %)
Lowland region 400% Statistical records
Ref-Sc
FADN-Sc
350% 300% 250% 200% 150% 100% 50%
19 1996 1997 1998 2099 2001 2002 2003 04 20 2005 2006 2007 2008 2009 2010 2011 2012 2013 2014 15 20 2005 2006 2007 2008 2009 2010 2011 2012 2013 2014 15
0%
Organic farming
Non-organic farming
Total
Mountain region 400% Statistical records
Ref-Sc
FADN-Sc
350% 300% 250% 200% 150% 100% 50% 0% 19 1996 1997 1998 2099 2001 2002 2003 04 20 2005 2006 2007 2008 2009 2010 2011 2012 2013 2014 15 20 2005 2006 2007 2008 2009 2010 2011 2012 2013 2014 15
Number of cows (% from 1996=100 %)
Figure 4: Forecasting the number of dairy cows in the Swiss lowland region for two different scenarios
Organic farming
Non-organic farming
Total
Figure 5: Forecasting the number of dairy cows in the Swiss mountain region for two different scenarios
12
However, the forecasts for the Swiss mountain region are completely different. The removal of the milk quota leads to an increase in dairy cows in the mountain region. For organic milk production a strong increase is expected after removal of the milk quota regime. The adjustment of the marginal cost functions in the mountain region to the FADN functions leads to significantly higher organic farming, while total milk production is slightly increasing.
4. Discussion Based on total milk production costs of FADN farms, regional supply functions for milk production are estimated. The results showed that the level and the distribution of total production costs is highly determined by the assumptions for labour costs. If comparable wages to non-agricultural sectors are applied, the production costs of most farms are much higher than the milk price. The estimations revealed that the total milk production costs could extremely rise up to 5.3 CHF/kg in the Swiss mountain region. On the other hand Wieck and Heckelei (2007) estimated marginal cost functions for various European regions, which showed only small increases. The rather big increase is caused by the fact that in this study not only specialised dairy farms are included in the sample, but also mixed small farms, whose production costs are above-average. Linear marginal cost functions for milk production of FADN farms were compared with those calculated by the PMP-based sectoral model SILAS. The results showed that the marginal cost functions in the sectoral model are in general steeper than the FADN estimations, if elasticities by the value one are applied. Major differences between organic and non-organic milk production could not be observed. Adjusting the slope of the marginal cost functions leads to only gradually different forecast results. Mainly the number of organic cows is higher in the FADN adjusted scenario than in the reference scenario without any adjustments. The rather small differences can be explained by two reasons. On the one hand the number of dairy cows is mainly driven by scarce production resources (labour, land) in the sectoral model. On the other hand the number of cows is highly influenced by the development of the costs for fodder, labour, machinery, building and energy. Due to the model design these elements are not affected by changing the slope of the marginal cost functions. It has to be tested if adjustments for other animal production activities, which are less influenced by scarce production resources, show similar results.
13
References Durgiai, B., Blättler, T., and Müller, R. (2005). Angepasste Vollweidehaltung – Ökonomie und Mensch. In: Bericht über die österreichische Fachtagung für biologische Landwirtschaft. Raumberg: Höhere Bundeslehr- und Forschungsanstalt. Ferjani, A., Mack, G. (2002). Auswirkungen der Agrarpolitik 2007 – Modellrechnungen für den Agrarsektor mit Hilfe des Prognosesystems SILAS. Tänikon: FAT. Fusfeld, D.R. (1972). Economics. Lexington: Heath. Gazzarin, C. and Hilty, R. (2002). Stallsysteme für Milchvieh: Vergleich der Bauinvestitionen. FAT Berichte Nr. 586, 2002. Eidgenössische Forschungsanstalt für Agrarwirtschaft und Landtechnik (ART), Tänikon, CH-8356 Ettenhausen. Gocht, A. (2005). Assessment of simulation behavior of different mathematical programming approaches. 89. EAAE Seminar: Modelling Agricultural Policies: State of the Art and new Challenges. 3-5 February 2005 – Parma. Henrichsmeyer, W., Isermeyer, F., Neander, E., Manegold, D. (Hrsg.) (1996). Weiterentwicklung des gesamtdeutschen Agrarsektormodells RAUMIS96, Endbericht, Bonn/Braunschweig. Howitt, R.E. (1995). Positive Mathematical Programming. American Journal of Agricultural Economics 77, 329-342. Howitt, R.E. (2005). PMP based production models – development and integration. Presentation at the XIth EAAE Congress, 24 August 2005, Copenhagen. Jacobs, A. (1998). Paralleler Einsatz von Regionen- und Betriebsgruppenmodellen in der Agrarsektoranalyse. In: BMELF (Hrsg.), Angewandte Wissenschaft, Reihe A, Heft 470, Landwirtschaftsverlag, Münster-Hiltrup. Jansson, T. and Britz, W. (2002). Experiences of using a quadratic programming model to simulate removal of milk quotas. 10th EAAE congress, organised session on milk quotas, August 28 - 31, 2002, Zaragoza (Spain). Mack, G., Schaack, D., and Mann, S. (2006). Die Schweiz in der EU? Modellrechnungen zu den Konsequenzen einer Mitgliedschaft für den Schweizer Agrarsektor. In: Unternehmen im Agrarbereich vor neuen Herausforderungen. Münster: Landwirtschaftsverlag. Mack, G. and Flury, C. (2006). Auswirkungen der AP2011. Modellrechnungen für den Agrarsektor mit Hilfe des Prognosesystems SILAS. Im Auftrag des Bundesamts für Landwirtschaft. http://www.blw.admin.ch/themen/00005/00044/index.html?lang=de. Mann, S. (2007). Ressourcen und Strukturen. Eine Einführung in die Volkswirtschaft. Sauerländer Verlage AG. Oberentfelden. Offermann, F. (2003). Quantitative Analyse der sektoralen Auswirkungen einer Ausdehnung des ökologischen Landbaus in der EU. Shaker Verlag, Aachen. Schnyder, A., Weber, M., Dumondel, M. and Lehmann, B. (2003). MPSL: Monitoring Tool Performance Schweizer Landwirtschaft. Schlussbericht. Zürich: ETH. Wieck, C., Heckelei, T. (2007). Determinants, differentiation, and development of short-term marginal costs in dairy production: an empirical analysis for selected regions of the EU. Agricultural Economics 36 (2) 203-220.
14