RESEARCH ARTICLE
Defining heatwave thresholds using an inductive machine learning approach Juhyeon Park ID, Jeongseob Kim ID* School of Urban and Environmental Engineering, Ulsan National Institute of Science and Technology, Ulsan, South Korea *
[email protected]
a1111111111 a1111111111 a1111111111 a1111111111 a1111111111
OPEN ACCESS Citation: Park J, Kim J (2018) Defining heatwave thresholds using an inductive machine learning approach. PLoS ONE 13(11): e0206872. https:// doi.org/10.1371/journal.pone.0206872 Editor: Jahan Fahimi, University of California San Francisco, UNITED STATES Received: June 7, 2018 Accepted: October 22, 2018 Published: November 7, 2018
Abstract Establishing appropriate heatwave thresholds is important in reducing adverse human health consequences as it enables a more effective heatwave warning system and response plan. This paper defined such thresholds by focusing on the non-linear relationship between heatwave outcomes and meteorological variables as part of an inductive approach. Daily data on emergency department visitors who were diagnosed with heat illnesses and information on 19 meteorological variables were obtained for the years 2011 to 2016 from relevant government agencies. A Multivariate Adaptive Regression Splines (MARS) analysis was performed to explore points (referred to as “knots”) where the behaviour of the variables rapidly changed. For all emergency department visitors, two thresholds (a maximum daily temperature � 32.58˚C for 2 consecutive days and a heat index � 79.64) were selected based on the dramatic rise of morbidity at these points. Nonetheless, visitors, who included children and outside workers diagnosed in the early summer season, were reported as being sensitive to heatwaves at lower thresholds. The average daytime temperature (from noon to 6 PM) was determined to represent an alternative threshold for heatwaves. The findings have implications for exploring complex heatwave-morbidity relationships and for developing appropriate intervention strategies to prevent and mitigate the health impact of heatwaves.
Copyright: © 2018 Park, Kim. This is an open access article distributed under the terms of the Creative Commons Attribution License, which permits unrestricted use, distribution, and reproduction in any medium, provided the original author and source are credited. Data Availability Statement: An anonymized data used for the analysis in this article will be made available to researchers upon request through Korea Centers for Disease Control & Prevention (KCDC). The request can be made by contacting the Officer for heat-related illness surveillance system operated by KCDC (http://www.cdc.go.kr/ CDC/eng/main.jsp). The data for meteorological variables are available at http://sts.kma.go.kr/jsp/ home/contents/statistics/newStatisticsSearch.do? menu=SFC&MNU=MNU. The census data is obtained for Statistics Korea (http://kostat.go.kr/).
Introduction An extended period of abnormally hot weather (commonly referred to as a heatwave) can cause adverse human health effects. As the frequency, duration and intensity of extreme heat events are predicted to increase due to climate change [1], many countries have implemented heatwave warning systems and response plans to reduce the human health consequences. Defining a “heatwave” is one key factor in effectively mitigating the impacts of extreme heat events. Certain meteorological thresholds (i.e., two or more consecutive days at a maximum temperature above a certain value) are used for evaluating heatwave extremes and triggering warning systems [2, 3]. Some action plans to protect vulnerable groups have also been designed based on such thresholds.
PLOS ONE | https://doi.org/10.1371/journal.pone.0206872 November 7, 2018
1 / 11
Heatwave thresholds by machine learning approach
Funding: This work was supported by the Basic Research Fund (1.180046.01) of UNIST (Ulsan National Institute of Science & Technology). Competing interests: The authors have declared that no competing interests exist.
To establish appropriate heatwave thresholds, many studies have focused on statistically significant increases in relative risk and/or odds ratios under different definitions related primarily to intensity (i.e., maximum daily temperature) and/or duration (i.e., how many days exceed a certain temperature) of temperature [4–12]. A new heat index combining temperature and humidity with apparent temperature is also under consideration to replace existing definitions by comparing odds ratios with heatwave outcomes [13–15]. Previous approaches use deductive reasoning, making assumptions first and then seeking validation using heatwave outcomes. This study focuses inductively on the non-linear relationship between meteorological variables and heatwave outcomes such as those that take a J, U, or V-shape [16–18]. While a few studies have given attention to the non-linear curve [19, 20], none have investigated a tipping point where human health effects rapidly change, which should be closely related to the definition of a heatwave. This concept has been neglected mainly because classical statistical techniques such as Ordinary Least Square (OLS) methods cannot capture such the tipping point because the linearity and normality assumptions may not be satisfied in the model. In this paper, we suggest an alternative approach to directly reveal thresholds using Multivariate Adaptive Regression Splines (MARS). This machine learning technique is suitable for capturing curves in predicted outcomes to allow for non-linearity. This approach has been used to develop the heatwave definition by focusing on the relationship between 1) the frequency of emergency department visits identified as heat related and 2) several meteorological factors.
Materials and methods Study area and dataset We focused on the summer season in the Seoul metropolitan area of Korea, which includes Seoul, Incheon, and Gyeonggi-do, with a population of 25 million in 2015, representing 49.5% of the country’s population. As the Korean Peninsula lies within the East Asian monsoon belt, summer generally falls between June and August, with the hottest month being August when the mean temperature is about 24–26˚C. Our dataset included summertime heat-related morbidity rates from 2011–2016 (totaling 521 days from June to August), recorded at 74 public health centers across the region. In other words, there were 38,554 observations considered (74 centers � 521 days). Daily meteorological factors were obtained from the nearest weather station (determined according to the latitudie and longitude of each public health center and each weather station) (Fig 1). The 105 weather stations covered the whole Seoul metropolitan area with an average inter-station distance of 8.7 km and an average of 3.26 km (SD = 2.51 km) from public health centers.
Data Daily data on emergency department visitors diagnosed with heat illnesses was obtained from a heat-related illness surveillance system operated by the Korea Centers for Disease Control and Prevention (KCDC) for a total of 586 days during the summer periods from 2011 to 2016: 65 days in 2011 (7/1-9/9), 98 days in 2012 (6/1-9/6), 98 days in 2013 (6/1-9/7), 98 days in 2014 (6/1-9/6), 105 days in 2015 (5/24-9/5) and 122 days in 2016 (5/23-9/21). All cases were initially reported by local emergency medical centers and then collected by the 74 public health centers. The Heat-related illnesses are defined according to the International Classification of Diseases, 10th Revision, T67, “Effects of Heat and Light,” which includes such categories as heat stroke, heat cramps, heat syncope, and heat exhaustion. We extracted the data from June to August
PLOS ONE | https://doi.org/10.1371/journal.pone.0206872 November 7, 2018
2 / 11
Heatwave thresholds by machine learning approach
Fig 1. Study area and dataset [Data Source: [21–23]]. https://doi.org/10.1371/journal.pone.0206872.g001
from the remaining days because there was a significant amount of missing information for visitors who arrived during the early (May) and late stages (September) of surveillance. The data included date of visit, sex, age, place of occurence and diagnosis results. This information was categorized by month, place of occurrence, and heatwave vulnerability profile of visitor (age, gender and diagnosis results) (Table 1). To standardize the variables, we divided by the population of the county where each public health center was located (mean = 303,011, SD = 143,257 for the whole population). The population was calculated using the average of 2010 and 2015 census data were obtained from Statistics Korea. Meteorological data (considering 19 factors) from the same time periods was obtained from the Korea Meteorological Administration (Table 2). We adopted the common definition
Table 1. Description of heatwave morbidity. (Subcategory) Name
Description
HWwhole Age
Gender Diagnosis�
Number of heat-related emergency department visits each day HWyoung
HWwhole under 18 years old
87 (5.9)
HWadult
HWwhole 18 to 65 years old
1,014 (69.1)
HWolder
HWwhole over 65 years old
HWmale
Male HWwhole Female HWwhole
HWdisch
HWwhole discharged from a hospital
489 (33.3)
HWwhole entered a hospital
875 (59.6)
HWwhole occurred in June or July
551 (37.5)
HWjunjul HWaug
Place of occurrence�
367 (25.0) 1,161 (79.1)
HWfemale HWhospital Month of occurrence�
Count (%) 1,468 (100.0)
307 (20.9)
HWwhole occurred in August
917 (62.5)
HWin
HWwhole occurred indoors
344 (23.4)
HWout
HWwhole occurred outdoors
1,102 (75.1)
Note: The variables divided by the population of the county where each public health center was located. There is missing information of diagnosis, month and place of occurrence.
�
https://doi.org/10.1371/journal.pone.0206872.t001
PLOS ONE | https://doi.org/10.1371/journal.pone.0206872 November 7, 2018
3 / 11
Heatwave thresholds by machine learning approach
Table 2. Description of meteorological factors. Variable
Description
Mean ±std. dev.
Min
Max
Tmini
Minimum temperature of day i
21.13±2.96
5.00
29.80
Tavgi
Average temperature of day i
24.83±2.51
14.40
32.90
Tavg1218i
Average daytime (noon to 6 PM) temperature of day i
27.68±2.99
13.77
36.44
AvgTavg1218Lag1i
Average Tavg1218 of day i-1 to i
27.67±2.65
16.22
36.22
AvgTavg1218Lag2i
Average Tavg1218 of day i-2 to i
27.67±2.47
17.51
35.95
AvgTavg1218Lag3i
Average Tavg1218 of day i-3 to i
27.66±2.36
17.34
35.76
Tmaxi
Maximum temperature of day i
29.5±3.03
16.30
38.90
AvgTmaxLag1i
Average Tmax of day i-1 to i
29.5±2.7
18.15
38.80
AvgTmaxLag2i
Average Tmax of day i-2 to i
29.49±2.52
19.33
38.47
AvgTmaxLag3i
Average Tmax of day i-3 to i
29.48±2.41
19.25
38.13
TmaxGapi
Tmaxi—Tmaxi-1
0.42±0.21
0.00
4.10
TavgGapi
Tavgi—Tavgi-1
0.19±0.07
-0.10
0.55
Whumi
Relative humidity of day i
75.23±13.07
28.90
100.00
Wpci
Precipitation of day i
8.09±23.38
0.00
449.50
Wwindi
Average wind speed of day i
1.57±0.84
0.00
38.70
WsolMAXi
Maximum amount of solar radiation of day i
2.09±0.82
0.00
3.98
WsolVOLi
Total amount of solar radiation of day i
14.26±6.63
0.00
28.94
Nindex1i
Heat index of day i [26]
74.1±3.9
57.94
85.10
Nindex2i
Discomfort index of day i [27]
79.1±6.86
56.86
107.88
https://doi.org/10.1371/journal.pone.0206872.t002
of a heatwave as being a heat event during which a certain temperature threshold is surpassed on a given day (Tmin, Tavg, and Tmax) or over consecutive days (AvgTmaxLag1, AvgTmaxLag2, and AvgTmaxLag3) [24, 25]. Daytime temperature (from noon to 6 PM) and its lagged value were included as alternative heatwave thresholds (Tavg1218 along with AvgTavg1218Lag1, AvgTavg1218Lag2, and AvgTavg1218Lag3). We employed two indices, estimated using combined daily mean temperature and relative humidity to enable a focus on methodological variables, which are simple and not combined. The first index was suggested by the US National Weather Service (NWS), originally developed by Steadman [26] as shown in Eq 1: NIndex1 ¼
42:379 þ 2:04901523 � T þ 10:14333127 � RH 0:22475541 � T � RH 0:00683783 � T2 0:05481717 � RH2 0:00122874 � T2 � RH þ 0:00085282 � T � RH2 0:00000199 � T2 � RH2 ð1Þ
where Nindex1 is the heat index in ˚F, T is the temperature in ˚F and RH is relative humidity. Two adjustments were considered when calculating Nindex1 (https://www.wpc.ncep.noaa. gov/heat_index/details_hi.html). Second, a discomfort index (Nindex2) was also established, calculated using the formula by Thom [27] as follows: NIndex2 ¼ 1:8 � Tc
ð1
0:01RHÞðTc
14:3Þ þ 32
ð2Þ
where Tc is the temperature in ˚C and RH is relative humidity. The maximum value from hourly measurements of the indices was also considered but not adopted because there was multicollinearity with the maximum temperature variables.
Modelling technique The MARS method implemented in the “Earth” package for R 3.4.1 was used to investigate the non-linear relationship between heatwave outcomes and meteorological variables. MARS is a
PLOS ONE | https://doi.org/10.1371/journal.pone.0206872 November 7, 2018
4 / 11
Heatwave thresholds by machine learning approach
spline regression model introduced in 1991 [28] to focus on specific sub-regions of a relationship between covariates and response variables. A knot point t, where the behavior of the function changes, marks the end of one region and the beginning of another, forming basis functions: (x-t)+ and (t-x)+. Firstly, MARS generates a model with an excessive number of knots. Those that contribute least to the overall fit by forward and backward selection are eliminated. A basis function is used to search for the number of knots and their locations, representing the relationships between predictor variables (x) and the outcome variable (y): Pk y ¼ ^f ðxÞ ¼ b0 þ i¼1 bi hi ðxÞ ð3Þ where β0 is an intercpet, βi is the coefficient estimated by minimizing the sum-of-squares, and hi(x) is a weighted sum of basic functions. Initially, The MARS searches all possible basis functions and their corresponding knots using a forward algorithm. Starting with a model consisting of intercept terms, β0, a larger number of basis functions are added, reducing sum-of-squares residual error as much as possible. However, MARS can be overfit due to a large number of basic functions. To mitigate this problem, a backward phase improves the model by iteratively deleting less significant terms until a final version is reached with the lowest generalized cross validation (GCV). In the model building process, predictors and knot locations that contribute significantly are automatically selected. Additionally, the response variable (y) is defined as a continuous variable because count data cannot be a response variable for the MARS [29, 30].
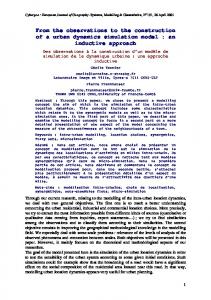
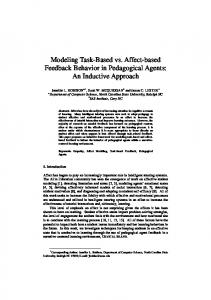
Results Initially, we focused on developing a MARS model based on common meteorological factors (not including Tavg1218 variables) to explore the definition of a heatwave. The mathematical equation resulting from the MARS model for all emergency department visitors diagnosed with heat illnesses can be expressed as HWwhole ¼ 0:08 0:009 � maxð0; 32:95 AvgTmaxLag1Þ þ 0:179 � maxðAvgTmaxLag1 32:95; 0Þ þ 0:019 � maxðNindex1 79:65; 0Þ ð4Þ Among all the meteorological variables, AvgTmaxLag1 and Nindex1 were included in the equation and others were removed to refine the model fitting process. The knots for AvgTmaxLag1 and Nindex1 were 32.95 and 79.65, respectively, and the term “max” can be defined thus: max(j, k) is equal to j if j is larger than k, otherwise it equals k. A positive sign for a function indicates that the relevant meteorological variable increases the probability of a paitient being diagnosed with heat illiness, while a negative sign indicates the relevant variable decreases this probability. Eq 4 can be explained as follows: AvgTmaxLag1 has little impact on HWwhole when AvgTmaxLag1 is lower than 32.95, while its effect rapidly increases from 32.95. Nindex1 also influences HWwhole after its value becomes larger than 79.65. Fig 2 is a plot of the predicted HWwhole as AvgTmaxLag1 and Nindex1 vary. Moreover, we allowed a second-order interaction term, excluding two combined indexes (Nindex1 and Nindex2). Eq 5 can be formulated, which includes the combination of i) TavgWhum and ii) AvgTmaxLag1-Whum (Fig 3). It denoted that the impact of the temeprature is emerged through the interaction with the humidity in a day. HWwhole ¼ 0:028 þ 0:051 � maxðTavg 25:1; 0Þ þ 1:157 � maxðAvgTmaxLag1 þ 0:010 � maxðTavg 25:1; 0Þ � maxðWhum 81:3; 0Þ þ 0:030 � maxðAvgTmaxLag1 32:85; 0Þ � maxð0; 57:5 Whum 81:3Þ
PLOS ONE | https://doi.org/10.1371/journal.pone.0206872 November 7, 2018
32:95; 0Þ ð5Þ
5 / 11
Heatwave thresholds by machine learning approach
Fig 2. Graphical representation of the MARS model. https://doi.org/10.1371/journal.pone.0206872.g002
Table 3 shows the first and second most important factors, with knots from other MARS models for each subcategorized heatwave outcome and daytime temperature variables. To focus on identifying the locations of knots where the function value was found to vary, we reported each knot and skipped coefficient values. The interpretation for other models was similar to the prior MARS model, which targeted all emergency department visitors diagnosed with heat illnesses, because we verified that the coefficients of all functions in the form
Fig 3. Graphical representation of interaction terms from the MARS. https://doi.org/10.1371/journal.pone.0206872.g003
PLOS ONE | https://doi.org/10.1371/journal.pone.0206872 November 7, 2018
6 / 11
Heatwave thresholds by machine learning approach
Table 3. Importance of the MARS model and related knots. (Subcategory) Outcome
Importance #1
Importance #2
Variable
Knot
Variable
Knot
AvgTmaxLag1
32.95
Nindex1
79.65
HWyoung
AvgTmaxLag3
30.68
-
-
HWadult
AvgTmaxLag1
31.80
Nindex2
80.48
(Not including Tavg1218 variables) HWwhole Age
HWolder
AvgTmaxLag1
33.40
-
-
Gender
HWmale
AvgTmaxLag1
32.15
Nindex1
78.43
HWfemale
AvgTmaxLag1
33.10
Tavg
30.5
Diagnosis
HWnothosp
AvgTmaxLag1
32.80
Nindex2
76.75
HWhosp
AvgTmaxLag1
33.45
Nindex2
79.42
Month of occurrence
HWjunjul
Tmax
29.80
Nindex2
80.65
HWaug
AvgTmaxLag1
33.35
Nindex1
HWin
Tavg
30.00
Nindex2
78.40
HWout
AvgTmaxLag1
31.25
Nindex2
80.66
AvgTavg1218Lag1
30.59
Nindex2
80.22
Place of occurrence (Including Tavg1218 variables) HWwhole
https://doi.org/10.1371/journal.pone.0206872.t003
“max(x-t, 0)” were positive, as for AvgTmaxLag1 and Nindex1 in Eq 4. For example, there is a knot “30.68” of AvgTmaxLag3 in the model for young heat-related visitors (HWyoung). It can be said that the effect of AvgTmaxLag3 played a role in increasing the frequency of visits by young people when it was larger than the knot (30.68).
Discussion This study developed a definition for the heatwave using a machine learning technique, MARS, to describe the fundamental relationship between i) the daily frequency of emergency department visits associated with heat illness, and ii) 19 meteorological factors. MARS enabled non-linear relationships to be rendered and automatically defined breaking points (knots) among separate sub-groups. Knots where the behaviour of functions dramatically changed were used to define a heatwave. Table 4. Number of summer days that meet existing and alternative criteria based on Station 108 in Seoul. Year
Number of summer daysHYPERLINK a
Existing criteriab
Alternative criteria 1c
Alternative criteria 2d
Alternative criteria 3e 28
2011
92
0
5
27
2012
92
10
13
46
46
2013
92
0
4
50
51
2014
92
4
6
37
37
2015
92
3
7
40
41
2016
92
19
29
47
47
Total
552
36
64
247
250
a
June to October Maximum temperature exceeds 33˚C for two consecutive days
b c
Average maximum temperature for two straight days (AvgTmaxLag1) � 32.58
d
NWS heat index (Nindex) � 79.64 AvgTmaxLag1 � 32.58 OR Nindex � 79.64
e
https://doi.org/10.1371/journal.pone.0206872.t004
PLOS ONE | https://doi.org/10.1371/journal.pone.0206872 November 7, 2018
7 / 11
Heatwave thresholds by machine learning approach
For all emergency department visitors diagnosed with heat illnesses, the related average maximum temperature for 2 consecutive days was greater than 32.58˚C and a heat index higher than 79.64 was selected as a threshold based on knots where heatwave morbidity started to rise dramatically. This approach to defining thresholds is similar to existing methods as follows: 1) the Korea Meteorological Administration issues a heatwave warning when the maximum temperature exceeds 33˚C for two straight days, while 2) the National Weather Service (NWS) gives a “Caution” notice for possible fatigue from prolonged exposure and/or physical activity when the heat index exceeds 80. We calculated the number of summer days that meet the existing and alternative criteria based on Station 108, which is representative of Seoul (Table 4). Compared to the current criteria, the number of heat wave days increased three to four times when the two criteria in this study were adopted. When we allowed second-order interactions, combinations of temperature and humidity were included in the model as important variables, even though South Korea only uses a maximum temperature for initiating a heat warning. It suggests that revised criterions and/or more procdure (i.e., attetion, alarm, emegerncy) should be considered for the early warning system. Heat-related outcomes varied depending on visitors’ profiles, similar to findings from previous studies on heat-related mortality and morbidity. Children were reported as being more sensitive to heatwaves [31, 32] as the number of emergency room visitors under 18 years of age entering due to heat illiness was dramatically higher than for other age brackets, even at a lower threshold. While the elderly are also generally considered vulnerable to heatwaves [4, 33–35], an opposite pattern was observed (relatively fewer emergency room visitors even at a higher threshold). As two-thirds of deaths from heatwaves are indeed among the elderly, heatrelated mortality was not included in this model: a factor which will be included in future works where more in-depth consideration can be completed. In gender-specific results, males were found to be more likely to visit the emergency room due to heat-related morbidity at a lower threshold compared with females. At a glance, this does not seem consistent with previous studies, which have identified women as facing higher risk or shown no difference by gender [36–39]. The results of this study might explained by males having greater exposure to heat through male-dominated occupations that place individuals in positions vulnerable to heat waves, for example, as construction workers. For diagnosis, it could be helpful to design multistage heatwave warning systems according to the threshold for each group, giving sensitivity to differences in demographic occurrences of severe illness and hospital admission. Our results suggest that heatwave prevention systems and response plans should be designed according to time and place. There is a difference of about 2–3˚C in the trigger point for early summer (June to July) for outside workers, a conclusion supported in previous work [40, 41]. In other words, a lower threshold should be set to improve response plans for specific demographics, such that outside workers should take a 10-minute break every hour, as the Korea Occupational Safety and Health Agency recommends. Additionally, in contrast to the basis for existing thresholds (i.e., daily maximum temperature), this study discovered that average daytime (noon to 6 PM) temperature was determined to represent an alternative threshold for heatwaves as reflecting heat exposures when it is hot during the day. With this in mind, other meteorological factors should be explored as other heatwave thresholds. Some limitations were encountered during this study. Relying on fixed monitoring stations may misrepresent true individual-level exposures, so additional analyses such as an object analysis of monitoring should be conducted for the meteorological variables considered here. Other heatwave outcomes such as heat-related mortality should also be considered.
PLOS ONE | https://doi.org/10.1371/journal.pone.0206872 November 7, 2018
8 / 11
Heatwave thresholds by machine learning approach
Conclusions This study investigated heatwave thresholds based on daily data for heat-related morbidity and meteorological variables. Thresholds were inductively determined using MARS models to explore non-linear relationships. For all emergency department visitors diagnosed with heat illnesses, the thresholds identified in this research were similar to existing values used to trigger heatwave warming systems. These thresholds varied depending on visitors’ profiles and the place and time of each occurrence. Average daytime temerpature was selected as an alternative factor informing heatwave thresholds. Our findings can help improve understanding of the effect of heatwaves on human health and be used to design more effective heatwave warning systems.
Acknowledgments This work was supported by the Basic Research Fund (1.180046.01) of UNIST (Ulsan National Institute of Science & Technology).
Author Contributions Conceptualization: Jeongseob Kim. Data curation: Juhyeon Park. Formal analysis: Juhyeon Park. Project administration: Jeongseob Kim. Supervision: Jeongseob Kim. Writing – original draft: Juhyeon Park. Writing – review & editing: Jeongseob Kim.
References 1.
Solomon S. Climate change 2007-the physical science basis: Working group I contribution to the fourth assessment report of the IPCC: Cambridge university press; 2007.
2.
Lowe D, Ebi KL, Forsberg B. Heatwave early warning systems and adaptation advice to reduce human health consequences of heatwaves. International journal of environmental research and public health. 2011; 8(12):4623–48. https://doi.org/10.3390/ijerph8124623 PMID: 22408593
3.
Toloo G, FitzGerald G, Aitken P, Verrall K, Tong S. Evaluating the effectiveness of heat warning systems: systematic review of epidemiological evidence. International journal of public health. 2013; 58 (5):667–81. https://doi.org/10.1007/s00038-013-0465-2 PMID: 23564031
4.
Åstro¨m DO, Bertil F, Joacim R. Heat wave impact on morbidity and mortality in the elderly population: a review of recent studies. Maturitas. 2011; 69(2):99–105. https://doi.org/10.1016/j.maturitas.2011.03. 008 PMID: 21477954
5.
Azhar GS, Mavalankar D, Nori-Sarma A, Rajiva A, Dutta P, Jaiswal A, et al. Heat-related mortality in India: Excess all-cause mortality associated with the 2010 Ahmedabad heat wave. PLoS One. 2014; 9 (3):e91831. https://doi.org/10.1371/journal.pone.0091831 PMID: 24633076
6.
Hajat S, Kosatky T. Heat-related mortality: a review and exploration of heterogeneity. Journal of Epidemiology & Community Health. 2010; 64(9):753–60.
7.
Li M, Gu S, Bi P, Yang J, Liu Q. Heat waves and morbidity: current knowledge and further direction-a comprehensive literature review. International journal of environmental research and public health. 2015; 12(5):5256–83. https://doi.org/10.3390/ijerph120505256 PMID: 25993103
8.
Luo Y, Zhang Y, Liu T, Rutherford S, Xu Y, Xu X, et al. Lagged effect of diurnal temperature range on mortality in a subtropical megacity of China. PloS one. 2013; 8(2):e55280. https://doi.org/10.1371/ journal.pone.0055280 PMID: 23405130
PLOS ONE | https://doi.org/10.1371/journal.pone.0206872 November 7, 2018
9 / 11
Heatwave thresholds by machine learning approach
9.
Pascal M, Wagner V, Le Tertre A, Laaidi K, Honore´ C, Be´nichou F, et al. Definition of temperature thresholds: the example of the French heat wave warning system. International journal of biometeorology. 2013; 57(1):21–9. https://doi.org/10.1007/s00484-012-0530-1 PMID: 22361805
10.
Tong S, Wang XY, Barnett AG. Assessment of heat-related health impacts in Brisbane, Australia: comparison of different heatwave definitions. PloS one. 2010; 5(8):e12155. https://doi.org/10.1371/journal. pone.0012155 PMID: 20730050
11.
Wang XY, Guo Y, FitzGerald G, Aitken P, Tippett V, Chen D, et al. The impacts of heatwaves on mortality differ with different study periods: a multi-city time series investigation. PloS one. 2015; 10(7): e0134233. https://doi.org/10.1371/journal.pone.0134233 PMID: 26217945
12.
Xu Z, FitzGerald G, Guo Y, Jalaludin B, Tong S. Impact of heatwave on mortality under different heatwave definitions: a systematic review and meta-analysis. Environment international. 2016; 89:193–203. https://doi.org/10.1016/j.envint.2016.02.007 PMID: 26878285
13.
Analitis A, Michelozzi P, D’Ippoliti D, de’Donato F, Menne B, Matthies F, et al. Effects of heat waves on mortality: effect modification and confounding by air pollutants. Epidemiology. 2014; 25(1):15–22. https://doi.org/10.1097/EDE.0b013e31828ac01b PMID: 24162013
14.
Yip FY, Flanders WD, Wolkin A, Engelthaler D, Humble W, Neri A, et al. The impact of excess heat events in Maricopa County, Arizona: 2000–2005. International journal of biometeorology. 2008; 52 (8):765–72. https://doi.org/10.1007/s00484-008-0169-0 PMID: 18607646
15.
Kent ST, McClure LA, Zaitchik BF, Smith TT, Gohlke JM. Heat waves and health outcomes in Alabama (USA): the importance of heat wave definition. Environmental health perspectives. 2014; 122(2):151. https://doi.org/10.1289/ehp.1307262 PMID: 24273236
16.
Tong S, Wang XY, Yu W, Chen D, Wang X. The impact of heatwaves on mortality in Australia: a multicity study. BMJ open. 2014; 4(2):e003579. https://doi.org/10.1136/bmjopen-2013-003579 PMID: 24549159
17.
Åstro¨m C, Ebi KL, Langner J, Forsberg B. Developing a heatwave early warning system for Sweden: evaluating sensitivity of different epidemiological modelling approaches to forecast temperatures. International journal of environmental research and public health. 2014; 12(1):254–67. https://doi.org/10. 3390/ijerph120100254 PMID: 25546283
18.
Michelozzi P, De Sario M, Accetta G, de’Donato F, Kirchmayer U, D’Ovidio M, et al. Temperature and summer mortality: geographical and temporal variations in four Italian cities. Journal of Epidemiology & Community Health. 2006; 60(5):417–23.
19.
Åstro¨m DO, Åstro¨m C, Rekker K, Indermitte E, Orru H. High summer temperatures and mortality in Estonia. PloS one. 2016; 11(5):e0155045. https://doi.org/10.1371/journal.pone.0155045 PMID: 27167851
20.
Hajat S, Armstrong B, Baccini M, Biggeri A, Bisanti L, Russo A, et al. Impact of high temperatures on mortality: is there an added heat wave effect? Epidemiology. 2006; 17(6):632–8. https://doi.org/10. 1097/01.ede.0000239688.70829.63 PMID: 17003686
21.
Seoul Metropolitan Government. Location of Public health centers in Seoul; 2017 [cited 2017 20 May]. https://opengov.seoul.go.kr/public/5763946.
22.
Ministry of Security and Public Administration. Road Name Address Information System; 2017 [cited 2017 20 May]. http://www.juso.go.kr.
23.
Korea Meterological Administration. National climate data service system; 2017 [cited 2017 20 May]. http://sts.kma.go.kr/jsp/home/contents/main/main.do.
24.
Koppe C, Sari Kovats R, Menne B, Jendritzky G, Wetterdienst D, Organization WH. Heat-waves: risks and responses. 2004.
25.
McGregor GR, Bessemoulin P, Ebi KL, Menne B. Heatwaves and health: guidance on warning-system development: World Meteorological Organization Geneva, Switzerland; 2015.
26.
Steadman RG. The assessment of sultriness. Part I: A temperature-humidity index based on human physiology and clothing science. Journal of Applied Meteorology. 1979; 18(7):861–73.
27.
Thom EC. The discomfort index. Weatherwise. 1959; 12(2):57–61.
28.
Friedman JH. Multivariate adaptive regression splines. The annals of statistics. 1991:1–67.
29.
Chang L-Y. Exploring contributory factors to highway accidents: A nonparametric multivariate adaptive regression spline approach. Journal of Transportation Safety & Security. 2017; 9(4):419–38. https://doi. org/10.4271/2016-01-1439
30.
Abdel-Aty M, Haleem K. Analyzing angle crashes at unsignalized intersections using machine learning techniques. Accident Analysis & Prevention. 2011; 43(1):461–70.
31.
Xu Z, Sheffield PE, Su H, Wang X, Bi Y, Tong S. The impact of heat waves on children’s health: a systematic review. International journal of biometeorology. 2014; 58(2):239–47. https://doi.org/10.1007/ s00484-013-0655-x PMID: 23525899
PLOS ONE | https://doi.org/10.1371/journal.pone.0206872 November 7, 2018
10 / 11
Heatwave thresholds by machine learning approach
32.
Gronlund CJ. Racial and socioeconomic disparities in heat-related health effects and their mechanisms: a review. Current epidemiology reports. 2014; 1(3):165–73. https://doi.org/10.1007/s40471-014-0014-4 PMID: 25512891
33.
Abrahamson V, Wolf J, Lorenzoni I, Fenn B, Kovats S, Wilkinson P, et al. Perceptions of heatwave risks to health: interview-based study of older people in London and Norwich, UK. Journal of Public Health. 2008; 31(1):119–26. https://doi.org/10.1093/pubmed/fdn102 PMID: 19052099
34.
Hansen A, Bi P, Nitschke M, Pisaniello D, Newbury J, Kitson A. Older persons and heat-susceptibility: the role of health promotion in a changing climate. Health promotion journal of Australia. 2011; 22 (4):17–20.
35.
Flynn A, McGreevy C, Mulkerrin E. Why do older patients die in a heatwave? Qjm. 2005; 98(3):227–9. https://doi.org/10.1093/qjmed/hci025 PMID: 15728404
36.
Basu R, Ostro BD. A multicounty analysis identifying the populations vulnerable to mortality associated with high ambient temperature in California. American journal of epidemiology. 2008; 168(6):632–7. https://doi.org/10.1093/aje/kwn170 PMID: 18663214
37.
Sun X, Sun Q, Zhou X, Li X, Yang M, Yu A, et al. Heat wave impact on mortality in Pudong New Area, China in 2013. 2014; 493:789–94. https://doi.org/10.1016/j.scitotenv.2014.06.042 PMID: 25000574
38.
Zhang Y, Feng R, Wu R, Zhong P, Tan X, Wu K, et al. Global climate change: impact of heat waves under different definitions on daily mortality in Wuhan, China. 2017; 2(1):10.
39.
Zhang Y, Yu C, Bao J, Li XJSr. Impact of temperature on mortality in Hubei, China: a multi-county time series analysis. 2017; 7:45093.
40.
Xiang J, Bi P, Pisaniello D, Hansen A. The impact of heatwaves on workers’ health and safety in Adelaide, South Australia. Environmental research. 2014; 133:90–5. https://doi.org/10.1016/j.envres.2014. 04.042 PMID: 24906072
41.
Mastrangelo G, Fedeli U, Visentin C, Milan G, Fadda E, Spolaore P. Pattern and determinants of hospitalization during heat waves: an ecologic study. BMC Public Health. 2007; 7(1):200.
PLOS ONE | https://doi.org/10.1371/journal.pone.0206872 November 7, 2018
11 / 11