Mohammed M. Al Qaraghuli1*, Soumya Palliyil1, Gillian Broadbent2, David C. Cullen3, ...... Bordoli L, Kiefer F, Arnold K, Benkert P, Battey J, Schwede T. Protein.
Al Qaraghuli et al. BMC Biotechnology (2015) 15:99 DOI 10.1186/s12896-015-0217-x
RESEARCH ARTICLE
Open Access
Defining the complementarities between antibodies and haptens to refine our understanding and aid the prediction of a successful binding interaction Mohammed M. Al Qaraghuli1*, Soumya Palliyil1, Gillian Broadbent2, David C. Cullen3, Keith A. Charlton2 and Andrew J. Porter1
Abstract Background: Low molecular weight haptens (cd "Desktop\(file name)”], [ >\Program Files (x86)\The Scripps Research Institute\Vina\vina.exe" –help], [>\Program Files (x86)\The Scripps Research Institute\Vina\vina.exe" –config conf.txt –log log.txt]. Upon completion of the docking process, the models were exported, viewed and analyzed by PyMOL (academic version 1.3).
Results Library construction, bio-panning, and characterization
For each immunized sheep, lymphocytes were used as the genetic source for scFv. Sheep sera samples were routinely examined during the immunization process, and the selection of material for library construction made based on the best measured responses. Sequences of the different antibody fragment libraries confirmed a full diversity within the CDR loops. Each of the libraries was considered highly diverse, containing at least 107108 unique clones. The panning strategies employed to select phage-binders included a series of steps to encourage the enrichment and selection of the more sensitive and specific clones [31]. Whilst this is not an exact science, care was taken where possible to follow a similar
Al Qaraghuli et al. BMC Biotechnology (2015) 15:99
Page 5 of 14
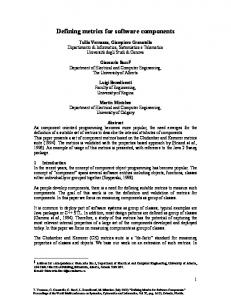
selection strategy for each hapten class (increasing stringency though reduction in antigen concentration and the swapping of protein conjugates to minimize the selection of carrier protein specific clones etc.). The selection process was stopped when clones of the same sequence began to appear at a level of great than 30 % of positive clones analyzed. Typically this was after 3–4 rounds of selection and bio-panning. Binding and competition ELISAs of monoclonal phage were used to identify unique clonal panels specific for SQA, POR, HSL, or COP (Table 1). The isolated scFv phage clones were converted into a scAb (single chain antibody) format, and the sensitivities of purified soluble antibody fragments to free haptens were determined by competition ELISA (Table 2). The “naïve” or simple chemical structure of SQA was recognized with only micromolar sensitivity (IC50). An increase in the structural rigidity of the hydrophobic and poly-cyclic second antigen COP did not really improve this moderate IC50 sensitivity beyond
the micromolar range. However, clone POR B11 was able to detect the rigid but polar POR with an IC50 value of 270 nM. The strongest molecular recognitions were seen for HSL molecules, which comprise a hydrophobic tail attached to a hydrophilic lactone ring. Several antiHSL antibodies displayed super-sensitive interactions with clone HSL 1 having an IC50 in the picomolar range (500 pM). Sequences analysis
Sequences were compared for clones from the pre and post-selection (panning) and are summarized in Table 1. Sequences were analyzed by examining canonical structures, CDR lengths, and amino acid distribution. CDR length and canonical structures
CDR lengths determination of each individual library has revealed clear conservation in CDRs H1, H2, and L2 (Table 3). In addition, there was moderate diversity in
Table 2 Binding sensitivities of the selected antibodies Target
Molecular weight (Da)
3-OXO-C12-HSL
297.39
SQA
POR
COP
422.81
478.67
372.67
Structure
Isolated clones
IC50 (μM)
1
0.0005
2
0.0015
3
0.0025
4
0.0005
5
0.0025
6
0.0004
A5
2
B3
7.5
F1
#
F9
4.5
E7
#
E10
2.2
D11
1
A7
2
B11
0.27
E12
30
F12
15
H3
60
28
#
A5
#
A8
#
F3
#
G12
#
Summary of the binding sensitivities of the analyzed clones together with the chemical structures of their corresponding antigens. #: IC50 values were not successfully detected
Al Qaraghuli et al. BMC Biotechnology (2015) 15:99
Page 6 of 14
Table 3 CDR length distribution of the pre and post-selection sequences A Library 1
CDR length (percentage of representation within the pre-selection sequences) CDR H1
CDR H2
CDR H3
CDR L1
CDR L2
CDR L3
5 (100)
16 (97)
14 (14.5)
14 (65)
7 (100)
10 (62.5)
18 (2)
13 (11.8)
11 (20)
11 (28.8)
12 (10)
13 (14)
9 (2.5)
11 (8.18) Library 2
5 (96.1)
16 (98.7)
11 (18)
14 (67)
6 (2.6)
15 (1.3)
14 (16)
13 (20)
11 (30)
13 (12)
11 (13.3)
12 (13.3)
7 (1.3)
7 (100)
9 (1.3) Library 3
5 (100)
16 (100)
10 (56.7)
9 (0)
13 (16)
14 (52.6)
7 (100)
10 (67.4)
14 (15)
13 (24.2)
11 (21.1)
15 (13)
11 (20)
12 (7.4)
12 (8.7) B
CDR length (percentage of representation within the post-selection clones) CDR H1
CDR H2
CDR H3
CDR L1
CDR L2
CDR L3
Library 1
5 (100)
16 (100)
12 (89)
14 (89)
7 (100)
11 (89)
11 (11)
11 (11)
Library 2
5 (100)
16 (100)
11 (50)
13 (75)
7 (100)
9 (50)
9 (25)
14 (25)
10 (11)
10 (50)
13 (25) Library 3
5 (100)
16 (100)
12 (100)
13 (100)
7 (100)
11 (100)
The most prevalent CDRs lengths (number of amino acids) within each library in (A) Pre-selection clones and (B) Post-selection clones. The percentage of each specific CDR length within (A) the entire library population or (B) post-selection clones is in parenthesis
the lengths of CDR L1, and high variability in CDRs H3 and L3. The length of CDRs H1, H2, and L2 were identical for all the post-selection clones isolated from the three libraries, irrespective of binding specificity. In contrast, CDR H3 and L3 (post-selection) lengths could be clustered into two groups: (i) antibodies that were developed against COP (library two) having generally shorter CDR H3 and L3 when compared to (ii) the antibodies developed against SQA, POR, and HSL (from libraries one and three, respectively). In general terms, the selection process has introduced bias into the CDR lengths recovered with CDRs H3, L1, and L3 having lengths in post-selection clones that were represented at low frequency in the pre-selection repertoires. Canonical classification was performed utilizing a strict Chothia SDR template, on all the CDRs except CDR H3. The pre-selection sequences from all three libraries comprised heavy chain sequences dominated by a 1–1 canonical combination for CDR's H1 and H2 (Table 4). Typically, these classes corresponded to CDR lengths of 10 (CDR H1) and 9 (CDR H2) amino acids. There was moderate but not unexpected variability in the classification of lambda light chains within preselection sequences. A significant contribution to the overall library variability was from a canonical class
combination 6-1-X for CDRs L1-L2-L3. CDR L1 class 6 represents a 14 amino acid loop length, while class 1 (7 amino acids loop) is the only identified group for CDR L2 in the literature [7, 41]. Class X is used here to indicate that no canonical class has been reported previously with a similar loop length. The three sampled antibody libraries were analyzed statistically using a chi square goodness of fit test (X2) (IBM SPSS 21) to evaluate whether the canonical class representation was equal within each antibody library. However, the null hypothesis was rejected (p value ≤ 0.001), and therefore, there was domination of specific canonical classes within each library. It is impossible to conclude whether this bias was present as a result of the different immunizations or as an artifact from the library cloning process. Clones (post-biopanning) included only lambda light chains, with a clear antigen specific canonical combination bias seen for each target. In contrast, the heavy chains CDRs H1-H2 were all classified as 1–1 (Table 4); a canonical class combination that dominated all the three libraries’ pre-selection sequences. The post-selection lambda chains were from canonical classes of CDRs L1 and L3 that were present in low abundance within the preselection sequences, and reflected the CDR length trends described previously. CDR L1 of the highly sensitive
Al Qaraghuli et al. BMC Biotechnology (2015) 15:99
Table 4 Canonical combinations of the pre and post-selection sequences A
Canonical combination (percentage of representation within the pre-selection sequences) CDRs H1-H2
Library 1 1-1 (97.3)
CDRs L1-L2-L3 6-1-X (51.3)
2-4 (1)
2-1-5 (11.2)
1-4 (1)
6-1-5 (11.2) 2-1-X (10)
Library 2 1-1 (94.8)
6-1-X (46.7)
2-1 (2.6)
6-1-5 (20)
3-1 (1.3)
5-1-X (16.6) 5-1-4 (−)
Library 3 1-1 (100)
6-1-X (45.3) 5-1-X (14.7) 2-1-X (17.7) 5-1-5 (5.26)
B
Canonical combination (percentage of representation within the post-selection clones) CDRs H1-H2
Library 1 1-1 (100)
CDRs L1-L2-L3 6-1-5 (88.9) 2-1-X (11.1)
Library 2 1-1 (100)
6-1-X (25) 5-1-4 (50) 5-1-X (25)
Library 3 1-1 (100)
5-1-5 (100)
The canonical classes were determined using Strict Chothia SDR template [7, 9, 53, 63]. Data presented represent the most prevalent canonical combinations within each library in (A) Pre-selection clones and (B) Postselection clones. X: indicates no currently recognized canonical class with the same loop length. The percentage of specific canonical combination within the entire library population of the analyzed pre (A) and post (B)-selection sequences are in parenthesis
post-selection clones was grouped within class 5 or 6. These sensitive clones included CDR H3 with 9 (class 4) or 11 (class 5) amino acids. In addition, CDR L3 class X was evident in post-selection clones that have not shown high binding sensitivities, like SQA (E7) and COP clones (A5, A8, F3, and G12). Amino acid distribution
Analyses of the pre-selection sequences confirmed the high level of amino acid site conservation in the FW regions and remarkable variability within the CDR loops (Fig. 1). The majority (~80 %) of the FW positions were well conserved (variability