Arch Toxicol (2017) 91:839–864 DOI 10.1007/s00204-016-1741-8
IN VITRO SYSTEMS
Definition of transcriptome‑based indices for quantitative characterization of chemically disturbed stem cell development: introduction of the STOP‑Toxukn and STOP‑Toxukk tests Vaibhav Shinde1 · Lisa Hoelting2,3 · Sureshkumar Perumal Srinivasan1 · Johannes Meisig6,7 · Kesavan Meganathan1 · Smita Jagtap1 · Marianna Grinberg4 · Julia Liebing5 · Nils Bluethgen6,7 · Jörg Rahnenführer4 · Eugen Rempel4,8 · Regina Stoeber5 · Stefan Schildknecht2 · Sunniva Förster2 · Patricio Godoy5 · Christoph van Thriel5 · John Antonydas Gaspar1 · Jürgen Hescheler1 · Tanja Waldmann2 · Jan G. Hengstler5 · Marcel Leist2 · Agapios Sachinidis1 Received: 19 February 2016 / Accepted: 4 May 2016 / Published online: 17 May 2016 © The Author(s) 2016. This article is published with open access at Springerlink.com
Abstract Stem cell-based in vitro test systems can recapitulate specific phases of human development. In the UKK test system, human pluripotent stem cells (hPSCs) randomly differentiate into cells of the three germ layers and their derivatives. In the UKN1 test system, hPSCs differentiate into early neural precursor cells. During the normal differentiation period (14 days) of the UKK system, 570 genes [849 probe sets (PSs)] were regulated >fivefold; in the UKN1 system (6 days), 879 genes (1238 PSs) were regulated. We refer to these genes as ‘developmental genes’. In the present study, we used genome-wide expression
Vaibhav Shinde and Lisa Hoelting have contributed equally to this work. Electronic supplementary material The online version of this article (doi:10.1007/s00204-016-1741-8) contains supplementary material, which is available to authorized users.
data of 12 test substances in the UKK and UKN1 test systems to understand the basic principles of how chemicals interfere with the spontaneous transcriptional development in both test systems. The set of test compounds included six histone deacetylase inhibitors (HDACis), six mercurycontaining compounds (‘mercurials’) and thalidomide. All compounds were tested at the maximum non-cytotoxic concentration, while valproic acid and thalidomide were additionally tested over a wide range of concentrations. In total, 242 genes (252 PSs) in the UKK test system and 793 genes (1092 PSs) in the UKN1 test system were deregulated by the 12 test compounds. We identified sets of ‘diagnostic genes’ appropriate for the identification of the influence of HDACis or mercurials. Test compounds that interfered with the expression of developmental genes usually antagonized their spontaneous development, meaning that up-regulated developmental genes were suppressed and developmental
* Jan G. Hengstler
[email protected]
4
Department of Statistics, TU Dortmund University, Dortmund, Germany
* Marcel Leist marcel.leist@uni‑konstanz.de
5
Leibniz Research Centre for Working Environment and Human Factors at the Technical, University of Dortmund (IfADo), Ardeystrasse 67, 44139 Dortmund, Germany
6
Institute of Pathology, Charité Universitätsmedizin, 10117 Berlin, Germany
7
Integrative Research Institute for the Life Sciences, Institute for Theoretical Biology, Humboldt Universität, 10115 Berlin, Germany
8
Centre for Organismal Studies, Heidelberg University, 69120 Heidelberg, Germany
* Agapios Sachinidis a.sachinidis@uni‑koeln.de 1
Institute of Neurophysiology and Centre for Molecular Medicine Cologne (CMMC), University of Cologne (UKK), Robert‑Koch‑Str. 39, 50931 Cologne, Germany
2
Doerenkamp‑Zbinden Chair for In Vitro Toxicology and Biomedicine, University of Konstanz, Box: M657, 78457 Constance, Germany
3
Konstanz Graduate School Chemical Biology KORS‑CB, University of Konstanz, 78457 Constance, Germany
13
840
genes whose expression normally decreases were induced. The fraction of compromised developmental genes varied widely between the test compounds, and it reached up to 60 %. To quantitatively describe disturbed development on a genome-wide basis, we recommend a concept of two indices, ‘developmental potency’ (Dp) and ‘developmental index’ (Di), whereby Dp is the fraction of all developmental genes that are up- or down-regulated by a test compound, and Di is the ratio of overrepresentation of developmental genes among all genes deregulated by a test compound. The use of Di makes hazard identification more sensitive because some compounds compromise the expression of only a relatively small number of genes but have a high propensity to deregulate developmental genes specifically, resulting in a low Dp but a high Di. In conclusion, the concept based on the indices Dp and Di offers the possibility to quantitatively express the propensity of test compounds to interfere with normal development. Keywords Human stem cells · Transcriptome · Genomics biomarkers · Developmental toxicity · In vitro test systems
Introduction Developmental toxicity testing represents a particularly challenging field of toxicology because the currently applied animal tests, such as second-generation reproduction or developmental neurotoxicity studies, are cost as well as labour intensive and require high numbers of animals (Adler et al. 2011; Forsby and Blaauboer 2007; Leist et al. 2008, 2013). In addition, developmental toxicity animal studies are not entirely relevant to the human situation. Therefore, the currently available testing capacities for studying the high number of developmental toxicants are not sufficient (Hengstler et al. 2006; Reif 2014a; Zimmer et al. 2014). A relatively high fraction of almost 20 % of newly approved drugs in Europe were reported to have post-approval issues, and between 2009 and 2011, five drugs had to be withdrawn from the market (Mol et al. 2013). Moreover, the chemical industry has been confronted with the European regulation on Registration, Evaluation, Authorisation and Restriction of Chemicals (REACH) initiative to provide more detailed toxicological data (Hengstler et al. 2006). Therefore, large efforts have been made to develop human stem cell-based in vitro test systems (Hengstler et al. 2006; Meganathan et al. 2015; Shinde et al. 2015; Weng et al. 2014). These in vitro systems recapitulate the critical phases of development, during which they are exposed to test compounds (Krug et al. 2013). Meanwhile, these systems have been applied in numerous studies to identify and characterize developmental toxicants (Balmer et al. 2014; Meganathan et al. 2012, 2015; Sisnaiske et al. 2014; Zimmer et al. 2014).
13
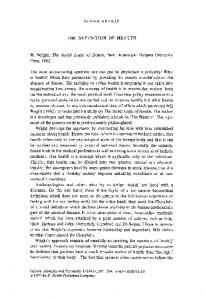
Arch Toxicol (2017) 91:839–864 Fig. 1 Data structure of transcriptome changes triggered by histone▸ deacetylase inhibitors (HDACis) and mercurials in two human stem cell systems differentiating towards all three germ layers (UKK) and neuroectoderms (UKN1). a Stem cells were either differentiated towards all three germ layers (UKK) for 14 days (DoD 14) or towards neuroectoderms (UKN1) over 6 days of differentiation (DoD 6), as indicated. b The highest non-cytotoxic concentration, corresponding to EC10, of all test compounds was determined in a viability assay. This ‘benchmark concentration’ (BMC) was used for obtaining transcriptome data of HDACis and mercurial exposure. The BMCs were calculated based on the concentration–response curves of three independent experiments. c The data structure of all transcriptome data sets was dimensionality-reduced and presented in the form of a 2D principle component analysis (PCA) diagram. The PCA illustrates a relatively large distance between human embryonic stem cells (hESCs) and differentiated cells at DoD 14 in the UKK system (UKK control) and at DoD 6 in the UKN1 system (UKN1 control). d Isocitrate dehydrogenase (ICDH) was incubated for 20 min with mercurials at the indicated concentrations. Isocitrate and NADP+ were added to determine the ICDH activity photometrically by measuring the reduction of NADP+ to NADPH. The ICDH activity is represented as a percentage relative to untreated control enzyme (dashed line). Glutathione reductase (GSR) was incubated for 20 min with the respective mercurials at the indicated concentrations. GSR activity was determined photometrically and is represented as a percentage relative to untreated control enzyme (solid line). The BMCs of the respective mercurials (used in this study for microarray analysis) are indicated by a red line (UKK) and a blue line (UKN1); data are shown as the mean ± SD; n = 3. e, f PCA analysis (using the 50 most regulated genes, defined by the lowest FDR-corrected p value) was performed separately for the two systems, including the 12 toxicants (n = 4) plus the untreated control (n ≥ 8) investigated in them (colour figure online)
Genome-wide expression studies have been performed to classify developmental toxicants (Rempel et al. 2015), and an eight-gene classifier has been shown to distinguish compounds acting as histone deacetylase inhibitors (HDACis) from a heterogeneous group of ‘mercurials’. Moreover, concentration-dependent, genome-wide expression studies in such stem cell-based systems have revealed concentration progression principles that allow the differentiation of (1) tolerated concentrations, where no gene expression changes are induced, (2) teratogenic concentrations ranges, where critical developmental genes are deregulated but no cytotoxicity occurs and (3) cytotoxic concentrations (Waldmann et al. 2014). A specific feature of stem cell-based developmental in vitro tests is that they represent dynamic systems. During the test period, when stem cells differentiate, for example, to cells of the three germ layers, some hundreds of genes are up- or down-regulated (‘developmental genes’), while expression of the majority of the approximately 22.000 genes of human cells remains unaltered (‘static genes’). Although much progress has been achieved in the field of developmental in vitro tests in the past decade (Reif 2014b; Stober 2014), a comprehensive analysis differentiating the influence of chemicals on ‘developmental’ versus ‘static’ genes and their role in developmental toxicity in
Arch Toxicol (2017) 91:839–864
841
A
Legend: Medium change:
Rock inhibitor (Y-27632): ROCK
Replating:
SB 431542: SB
Toxicant exposure:
B
Day of analysis:
Day of differentiation: DoD
C BMC [nM]
HDACis
UKN1
UKK
UKK
UKN1
MeHg
1500
1000
TSA
HgCl2
120
836
VPA
29
10
Thimerosal 1300
429
SAHA
582
140
HgBr2
408
630
Belinostat
580
98
PMA
253
27
Panobinostat
8.4
4
PCMB
5800
3900
1900
208
2000000 600000
Entinostat
UKN1 control
50 0
PC2 (10%)
BMC [nM]
Mecurials
-50
UKK control
UKN1 treated
-150 -250
HESC
-350
-150 -100
-50
0
50
100 150
PC1 (24%) 120 100 80 60 40 20 0
UKK
UKN1
*
GSR
*
0 0.1
1
ICDH
* * * *
* *
10
UKN1
100 80 60 40 20 0 0 0.01
100
[% of control ± SD]
Enzyme activity
MeHg [µM] 100 80 60 40 20 0
UKN1
0 0.01
0.1
UKK
* * *
1
* * * *
120 100 80 60 40 20 0
10
HgCl2 [µM]
10
Entinostat Panobinostat
VPA
1
HgBr2 [µM]
0 0.01
*
0.1
* *
1
PMA [µM]
MeHg
TSA SAHA
Thimerosal
-10
HgCl2
0 PC1 (29%)
10
humans has not yet been performed. To achieve more progress in this field, we used two recently introduced in vitro systems of human developmental toxicity: the UKK (Universitätsklinikum Köln) test system, which recapitulates
* * * *
UKK
* * 0 0.1
*
* * *
* 1
10
* * * *
100
Thimerosal [µM]
120 100 80 60 40 20 0
10
UKN1
UKK
UKN1
* *
* * * *
* * 0 0.01
0.1
1
PCMB [µM]
10
UKN1 10 TSA
HgBr2 PCMB PMA
100 80 60 40 20 0
10
UKN1
*
Control
-10
* * * *
*
Belinostat
-20
0.1
* * *
F
0
-20
* *
UKK
UKK
E
PC2 (18%)
* *
*
UKK
*
PC2 (20%)
[% of control ± SD]
Enzyme activity
D
0
VPA
Entinostat SAHA Panobinostat
HgCl2
MeHg
-10
PCMB
-20 -30
Belinostat Thimerosal Control
PMA
-25
-20
HgBr2
-10 0 PC1 (34%)
10
the development of human embryonic stem cells (hESCs), or alternatively, of other pluripotent stem cells (hPSCs), to the three germ layers and their derivatives during a 14-day differentiation process, and the UKN1 (University
13
842
of Konstanz) test system, which represents a 6-day process of hESCs/hPSCs differentiating into neural precursors (Fig. 1a; Krug et al. 2013). We focused on genome-wide expression data of six ‘mercurials’, a relatively heterogeneously acting group of chemicals containing mercury in their molecules, and we compared their effects to those of six histone deacetylase inhibitors, representing a relatively homogeneous group of compounds with a similar mechanism of action. We report that the influence on developmental as well as static genes is highly compound specific. Moreover, different developmental processes, such as the induction of the germ layer or different somatic cells, or specific neural induction, show differential susceptibility to individual test compounds. In the present study, we introduce two basic developmental indices to characterize the potency of developmental toxicants: (1) developmental potency (Dp), which represents the fraction of developmental genes among all genes whose expression is influenced by a test compound, and (2) developmental index (Di), which describes the degree to which developmental genes are overrepresented among all genes deregulated by a test compound. These parameters can easily and precisely be determined and represent a sound starting point for a more detailed understanding of the disturbed development of differentiating stem cells. Overall, the tests are based on stem cell and omics technologies and have a high predictive potency for discriminating between general and developmental toxicity. Accordingly, we have named the UKK test system as the STOP-Toxukk test and the UKN1 system as the STOP-Toxukn test (STOP, Stem cell-based Teratogenic Omics Prediction).
Materials and methods Materials Gelatin, putrescine, selenium, progesterone, apotransferrin, glucose and insulin were obtained from Sigma (Steinheim, Germany). Accutase was obtained from PAA (Pasching, Austria). FGF-2 (basic fibroblast growth factor), noggin and sonic hedgehog were obtained from R&D Systems (Minneapolis, MN, USA). Y-27632, SB-43154 and dorsomorphin dihydrochloride were obtained from Tocris Bioscience (Bristol, UK). MatrigelTM was obtained from BD Biosciences (Massachusetts, USA). All cell culture reagents were obtained from Gibco/Invitrogen (Darmstadt, Germany), unless otherwise specified. The following chemicals (HDACis and mercurials) were obtained from Sigma unless otherwise specified. The vehicles used are also mentioned with the compounds: (HDACis) valproic acid (VPA, P4543; water); trichostatin (TSA, T1952; DMSO); vorinostat (SAHA, SML 0061; DMSO); belinostat (PXD101,
13
Arch Toxicol (2017) 91:839–864
S1085, Selleckchem; DMSO); panobinostat (LBH589, S1030, Selleckchem; DMSO); entinostat (MS-275, Cay13284-25; Biomol; DMSO); (mercurials) methylmercury (MeHg, 442,534; 10 % ethanol); thimerosal (THM, T4687; water); mercury(II)chloride (HgCl2, 203,777; water); mercury(II)bromide (HgBr2, 437859, water); 4-chloromercuribenzoic acid (PCMB, C5913-5G; water); and phenylmercuric acetate (PMA, P27127-25G). Human embryonic stem cells The human pluripotent stem cell line H9 (Thomson et al. 1998) was obtained as a WA09 line from WiCell (Madison, WI, USA). The importation of the cells and the subsequent experiments were authorized (Robert Koch Institute, Berlin, Germany) under licence # 170-79-1-4-27 for the UKN1 system and licence # 1710-79-1-4-34 for the UKK system. H9 cells were cultured on irradiated mouse embryonic fibroblasts (MEFs) in H9 culture medium, as previously described (Jagtap et al. 2011; Krug et al. 2013; Shinde et al. 2015). Random differentiation of hESCs to germ layer cell types and their derivatives (UKK test system) To remove MEFs, H9 cells from the maintenance culture were transferred on hESC-qualified matrix (BD Biosciences, California, USA)-coated, 60-mm tissue culture plates (Nunc, Langenselbold, Germany) in TESR1 medium (StemCell Technologies) and were maintained for 5 days prior to differentiation. The random differentiation into embryoid bodies (EBs) representing multiple lineages was performed as described previously (Meganathan et al. 2012). In brief, cell clumps were obtained by cutting and scraping the cells with a passage tool (StemPro EZPassage™ Disposable, Invitrogen) and a cell scraper. On day 0, 80 clumps were seeded in each well of a pluronic-coated, v-bottom plate in 100 µl of random differentiation (RD) medium (DMEM-F12 medium with 20 % KO serum replacement, 1 % non-essential amino acids, penicillin (100 units/ml), streptomycin (100 µg/ml) and 0.1 mM β-mercaptoethanol) containing chemical or vehicle, and the plate was then incubated (37 °C, 5 % CO2) for 4 days. The EBs were collected on day 4 and were transferred onto a 100-mm bacteriological plate in 15 ml of RD medium containing the chemical or vehicle. The medium was replenished every alternate day until day 14 of differentiation. Neuroepithelial differentiation (UKN1 test system) H9 cells were cultured according to standard protocols and were differentiated into neuroepithelial progenitors (NEPs) as previously described (Balmer et al. 2014; Krug et al. 2013; Shinde et al. 2015) and as shown in Fig. 1. The
Arch Toxicol (2017) 91:839–864
differentiation of the H9 cells towards NEPs was based on a dual SMAD inhibition (Chambers et al. 2009) using a combination of 35 µM noggin and 600 nM dorsomorphin together with 10 µM SB-431642. This was used to prevent BMP and TGF signalling and thus achieve a highly selective neuroectodermal lineage commitment. Cells were handled and manipulated as previously described in the supplemental methods (Balmer et al. 2014). Benchmark concentration (BMC) determination The BMC is defined here as the concentration at which at least 90 % of the cells survive (BMC10). For both test systems, the BMC10 was determined for six HDACis and six mercurial compounds by performing resazurin cell viability assays exactly as previously described (Krug et al. 2013; Stiegler et al. 2011). In the UKK system, the H9 cells were differentiated as described above and were treated from DoD 4 to DoD 14. In the UKN1 test system, the cells were treated from DoD 0 to DoD 6. Both test systems were treated during the indicated time periods with concentrations ranging from non-cytotoxic to cytotoxic. The analysis was performed on DoD 14 (UKK) and DoD 6 (UKN1). The experiments have been performed with five technical and three biological replicates. On the day of analysis, cells were incubated with 10 µg/ml resazurin for 1–1.5 h at 37 °C and 5 % CO2. To determine the background fluorescence of resazurin itself, a control with only resazurin in medium was included. Resorufin was measured at a wavelength of 560Ex/590Em with a fluorescence reader. The mean background fluorescence of resazurin was subtracted from all experimental data. Further data processing to identify BMC of chemicals was done as mentioned below. Data from each experiment were normalized to their respective vehicle controls (set as 100 %). The data were then displayed in semi-logarithmic plots. Data points were connected by a nonlinear regression sigmoidal dose–response curve fit. These curves were averaged, and BMC10 was then determined graphically as the data point on the average curve corresponding to 90 % viability value, or as the last real data point left of this value. The BMC10 concentrations of the compounds were considered for further Affymetrix-based studies with UKK and UKN1 protocol. Affymetrix‑based study details For Affymetrix-based study, six HDACis and six mercurial compounds were exposed at BMC10 concentrations from DoD 0 to DoD14 or from DoD 0 to DoD6 in UKK or UKN1 test system, respectively, along with the respective vehicle controls. The samples were collected on DoD 14 or DoD 6 for RNA isolation. The samples from four biological replicates were used for further processing.
843
Affymetrix DNA microarray analysis On DoD 14 (UKK) or DoD 6 (UKN1), medium was removed, and the cells were lysed in RNA protect solution (Qiagen). Affymetrix chip-based DNA microarray analysis (Human Genome U133 plus 2.0 arrays) was performed exactly as previously described (Krug et al. 2013; Meganathan et al. 2015). Briefly, total RNA was isolated using TRIzol and chloroform (Sigma, Steinheim, Germany) and purified with miRNeasy mini kit (Qiagen, Hilden, Germany). The quantification and quality control measurements were done using Nanodrop spectrophotometer (ND-1000, Thermo Fisher, Langenselbold, Germany). For microarray labelling 100 ng total RNA was taken as a starting material, and after amplification 12.5 µg amplified RNA was hybridized on Affymetrix Human Genome U133 Plus 2.0 arrays (Affymetrix, Santa Clara, CA, USA). For washing and staining Affymetrix HWS kit and Genechip Fluidics Station-450 were used according to the manufacturer’s instructions. After staining arrays were scanned with Affymetrix Gene-Chip Scanner-3000-7G and Affymetrix GCOS software has been used for quality control analysis. The corresponding raw CEL files of the Affymetrix chips are publicly available under GEO accession number GSE71127. Biostatistics Batch effects, non-biological experimental variation, is a commonly observed phenomenon in the area of microarray studies. They occur due to experiments that cannot be conducted all at once, for various reasons. It was important to eliminate batch effects as otherwise relevant expression changes may remain undetected. We applied the ComBat algorithm (Johnson et al. 2007) that allowed adjusting for batch effects in datasets where the batch covariate was known. It used a nonparametric, empirical Bayes approach for the estimation of an additive and a multiplicative batch effect. First, we used extrapolation strategy (RMA +) (Harbron et al. 2007) for background correction, log2 transformation and quantile normalization. Then the data were standardized with respect to mean gene expression and treatment effect. Then, the batch effects were estimated and eliminated from the standardized data by subtracting the additive effect and dividing by the multiplicative effect. Finally, the data were back-transformed, i.e. mean gene expression and treatment effect were added. Further statistical data analysis and visualization performed by uploading ComBat-corrected files into the Partek Genomics Suite (PGS) version 6.6 software (Partek, St. Louis, MO, USA). The normalized probe sets (PSs) were used for the generation of a principal component analysis (PCA) and one-way ANOVA model that was used to identify the differentially
13
844
regulated transcripts with changes of at least 1.5-fold (absolute fold change, p value ≤0.05), with Benjamini and Hochberg FDR corrections. The first 50 transcripts deregulated by each toxicant were filtered based on p value, and signals were normalized by z-score and clustered using a hierarchal cluster analysis (complete linkage method). The commonly deregulated transcripts were obtained using a Venn diagram overlap analysis (PGS). Online free software such as g:Profiler and the Database for Annotation, Visualisation and Integrated Discovery (DAVID) were used for functional annotation and gene ontology (GO) clustering of differentially expressed transcripts (p ≤ 0.05). Construction of a transcription factor network The TF network was constructed as previously described (Rempel et al. 2015). Briefly, we downloaded raw data for the microarray samples referenced in the manually curated CellNet tissue atlas (Cahan et al. 2014) and combined them with data from the UKN1 and UKK test systems (Balmer et al. 2014; Cahan et al. 2014; Krug et al. 2013; Waldmann et al. 2014). To obtain the expression matrix, the samples were normalized together using RMA implemented in the R package oligo. The co-expression network was constructed in two steps using functions from the parmigene package for R. First, the mutual information matrix was computed by applying the function knnmi.all with parameter k = 9, chosen based on an unpublished benchmarking, on the expression matrix. Then, we applied the clr function from the parmigene package, which implements the CLR algorithm. The co-expression network was subsequently restricted to genes annotated as transcription factors (TFs) in the Animal Transcription Factor Database (AnimalTFDB, [http://www.bioguo.org/AnimalTFDB/index.php]). The overlap of the genes detected by the Affymetrix array and the AnimalTFDB was 1300 genes. Links were drawn only for pairs of TFs with a score in the top 0.1 % of all co-expression scores. This yielded 1690 predicted interactions between 847 TFs. Nodes were arranged in the network according to the Fruchterman and Reingold’s forcedirected placement algorithm provided by the R package sna with the area parameter = 109.
Arch Toxicol (2017) 91:839–864
analysis was performed with the R package topGO using the classic method and the Fisher’s test statistic. We selected representative terms for each community from the top enriched terms with an unadjusted p value 1.5 and FDR-corrected p value 6 (log2 scale) at day 0 or at the day of differentiation (day 14 in the UKK system or day 6 in the UKN1 system) were considered (the number of PSs passing this criteria are shown in Suppl. Fig. S5A &B, the cut-off value has been selected based on the frequency distribution curves provided in Suppl. Fig. S5C & D); and (6) PSs were only considered when they could be assigned to genes whose function is basically understood.
Results Structure of developmental genes in differentiating stem cells In the present study, two stem cell-based test systems were used, the UKK system, where hESCs/hPSCs differentiate into cells of the three germ layers and their derivatives, and the UKN1 system, which recapitulates differentiation into early neural precursor cells (Fig. 1a). Genome-wide gene expression profiles were established from the undifferentiated hESCs and after 14 (UKK) and 6 days (UKN1) of differentiation. Additionally, hESCs of both in vitro systems were exposed to 12 test compounds at benchmark concentrations of low cytotoxicity during the differentiation periods. Among them, six mercurials and six HDACis were applied (Fig. 1b, c). All compounds were tested at their maximum non-cytotoxic concentrations, i.e. at the benchmark concentration (BMC10) resulting in a maximal viability reduction of 10 %. This biological-anchoring point has been previously found to be well suited for transcriptome analysis (Waldmann et al. 2014). Moreover, it is also well correlated with known pharmacological and toxicological molecular properties of the test compounds. For instance, the concentrations of the HDACis were all within the range known to be required for half-maximal enzyme inhibition in biochemical assays (Rempel et al. 2015). The concentrations of the mercurials were all in a similar range with respect to the inhibition of thiol-containing, redox-sensitive enzymes. Glutathione reductase (GSR) or isocitrate
845
dehydrogenase (ICDH) were chosen as target enzymes for this rough bioequivalence test, and the BMC10 test concentrations all led to partial enzyme inhibition (Fig. 1d). Notably, none of the HDACis affected the enzyme activities at the concentrations tested here. To obtain an overview over the genome-wide data, principle component analysis (PCA) plots were established. The PCA illustrates a relatively large distance between hESCs and the cells resulting after the 14-day (UKK) and 6-day (UKN1) differentiation processes (Fig. 1c). Compared with these large distances, the influence of the test compounds appears comparatively small (Fig. 1c). However, when the PSs for the PCA analysis were limited to the 50 most regulated (defined by the lowest FDR-corrected p values) of each test substance, most compounds cluster distinctly from the controls, whereby the differentiation between compound-exposed samples and their controls appears more separated in data from the UKN1 system than in data from the UKK system (Fig. 1e, f). Subsequently, we addressed genes whose expression alters spontaneously during the differentiation of stem cells. Genes that are up- or down-regulated during differentiation into the germ layers and their derivatives (UKK) or into neuronal precursor cells (UKN1) will be further referred to here as ‘developmental genes’. There were no major differences in the number of developmental up-regulated genes in the UKK and UKN1 systems, but fewer genes were down-regulated in the UKK system (Fig. 2a). The overlap of developmental genes between the UKK und UKN1 systems was relatively small (Suppl. Table 1). A relatively high fraction of developmental genes showed high fold changes (Suppl. Table 1). The number of PSs up-regulated by at least fivefold (absolute value, p 5; p < 0:05 D-genes = Developmental genes
1.0 0.8
***
**
0.6 0.4 0.2 0.0
ESC ESC UKK UKK UKN1 UKN1
categories belonging to biological processes overrepresented amongst up- and down-regulated genes (p