Degradation of liquid crystal device performance due to selective adsorption of ions S. H. Perlmutter, D. Doroski, and G. Moddela) Department of Electrical and Computer Engineering, Optoelectronic Computing Systems Center, University of Colorado, Campus Box 425, Boulder, Colorado 80309-0425
~Received 22 May 1995; accepted for publication 17 June 1996! Performance degradation in liquid crystal cells was studied by analyzing the time evolution of optical and integrated current vs voltage hysteresis curves as test cells were subjected to a dc bias. We find evidence for permanent increases in liquid crystal mobile ion populations, the primary cause of device performance degradation, and suggest this permanent increase is due to selective adsorption by the alignment layers of ions of a single charge sign combined with the presence of a neutral ionizable species in the liquid crystal. © 1996 American Institute of Physics. @S0003-6951~96!01935-3#
Both nematic liquid crystals ~NLCs! and ferroelectric liquid crystals ~FLCs! have shown great promise for use in a wide range of optical devices.1–8 However, the tendency of the performance of these devices to degrade has been a significant barrier to practical applications.8–18 The most important cause of device performance degradation is the build up of electric fields from ions within the liquid crystal itself, but it has not been clear as to why ions are so harmful. Simple models of ion behavior suggest that recombination of ions back to neutral molecules should keep ion concentrations from growing to levels where they become a significant problem. Researchers have proposed that selective adsorption of ions of only one charge sign by the alignment layers leads to the development of a sheet of ions of the other charge sign adjacent to each alignment layer.4,19 These ‘‘electric bilayers’’ create strong electric fields in the region of the alignment layers, between the adsorbed and nonadsorbed charge sheets. These fields, in turn, lead to polar surface interactions that have been found responsible for changes in the anchoring energy in NLC cells.19 In this letter we show experimentally that selective ion adsorption by the alignment layers causes performance degradation by greatly increasing mobile ion populations. With an understanding of the mechanisms of this degradation, we can then explore solutions to the problem. We investigated liquid crystal test cells by monitoring their conductivity under an applied dc bias. We determined the conductivity from integrated current versus driving voltage hysteresis curves. These were measured periodically ~typically every few minutes! by removing the dc bias and driving the cell with a single 50 m cycle triangle-wave voltage while measuring the integrated current through the cell. A component of the area of an integrated-current hysteresis curve is proportional to the current due to ion drift.20 By fitting the hysteresis curve to a computer simulation we isolated this component and determined the cell’s conductivity. The optical hysteresis of the test cells was also measured, concurrently with the integrated current. The test cells were fabricated by sandwiching the liquid a!
Electronic mail:
[email protected]
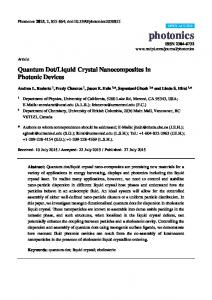
crystal between two 2.54 cm diam optical flats, the inner surfaces of which had been coated first with a thin layer of indium tin oxide ~ITO! ~;120 Å! and then, optionally, with an alignment layer material. The test cell and optics were contained in a light–tight box during testing to preclude the generation of ions from ambient light. The cell was placed between a polarizer and crossed analyzer and illuminated with a laser diode ~670 nm!, the output beam from which was expanded and collimated to fill the ;2.25 cm diam test cell area. The light transmitted through the cell and the analyzer was focused down into a photodiode detector. To determine the effect of a dc bias on the mobile ion populations, a test cell that incorporated rubbed nylon alignment layers was filled with the FLC mixture SCE13 ~E.M. Industries, Hawthorne, NY! and subjected to the pattern of dc biasing shown in Fig. 1~a!. Figure 1~b! shows the central voltage of the optical hysteresis curve as a function of time. Shifts in the central voltage are due to ionic shielding of the applied field.20 The time scale of the initial rapid shift in the central voltage whenever the bias voltage is changed is con-
FIG. 1. Effect of dc bias on voltage offset of optical hysteresis curves. ~a! The dc bias applied across a test cell incorporating rubbed nylon alignment layers and filled with the FLC SCE13. ~b! Central voltage of the optical hysteresis curve while the dc bias shown in ~a! was applied.
1182 Appl. Phys. Lett. 69 (9), 26 August 1996 0003-6951/96/69(9)/1182/3/$10.00 © 1996 American Institute of Physics Downloaded¬15¬Dec¬2006¬to¬128.138.248.77.¬Redistribution¬subject¬to¬AIP¬license¬or¬copyright,¬see¬http://apl.aip.org/apl/copyright.jsp
FIG. 2. Area of integrated-current hysteresis curve measured during the periods of 0 V dc bias shown in Fig. 1~a!. The hysteresis curves were measured in response to a 200 Hz single cycle triangle wave driving voltage that had a peak-to-peak voltage of 20 V.
sistent with redistribution of ions that are mobile at the time of the bias voltage change. The time scale of the subsequent slower shift is consistent with additional shielding from thermally generated ions accumulating at the interface.21 The voltage excursions of the central voltage of the hysteresis curve are seen to be gradually increasing with each cycle of dc biasing, indicating that the population of mobile ions is also increasing, even after the cell has been allowed to equilibrate for 6 h with zero applied bias voltage. Integrated-current hysteresis curves also provide evidence that there are permanently increasing mobile ion populations. A cell similar to the one just discussed but filled with the FLC mixture ZLI3654 ~E.M. Industries, Hawthorne, NY! was also subjected to the pattern of dc biasing shown in Fig. 1~a!. Figure 2 shows the area of the integrated current hysteresis curves, measured during the periods of zero dc voltage, plotted against time. From the increasing curve area we may deduce that the resistive component of the hysteresis is decreasing13 after each dc bias period even though we would expect ions to recombine during the 6 h periods in which the cell was biased at 0 V. The observations from Figs. 1 and 2 consistently suggest that the mobile ion population increases as a result of dc bias on the cell. Figure 3 shows evidence for the cause of the ion population increase. In Fig. 3, offset voltage in the optical hysteresis of a FLC-filled cell with no alignment layers that is
FIG. 3. Offset of the center of the optical hysteresis plotted against time for a cell with no alignment layers. The cell was filled with the FLC mixture ZLI3654. At 0 h a 2.5 V bias was applied.
biased at 2.5 V is plotted against time. Published models of ion dynamics in liquid crystal cells16,21 predict that an offset in the optical hysteresis should be observed only if the liquid crystal layer is capacitively ~as opposed to directly! coupled to the ITO electrodes, typically through an alignment layer. Otherwise, the applied voltage drops solely across the liquid crystal layer. Since there is an offset in Fig. 3, even though the tested cell had no alignment layers, there must have been capacitive coupling. Such coupling occurs if selective adsorption is present. Selective adsorption is a result of one species of ion having a negative adsorption energy on the interface while the oppositely charges species has a positive adsorption energy. Whereas the species with negative adsorption energy is attracted to the interface and is adsorbed, the species with positive adsorption energy is repelled by the interface. As a result, the latter species of ion form a Debye layer adjacent to the interface. It is this Debye layer that provides the capacitive coupling required to explain the optical hysteresis curve offset shown in Fig. 3. If ions of the adsorbing species remain near the interface, they also may form a Debye layer that contributes to capacitive coupling. However, we know of no other single phenomenon that can be responsible for both capacitive coupling and permanent increases in mobile ion populations. It has been observed previously that the magnitude of the voltage offset of optical hysteresis curves is not correlated to the capacitance of the alignment layers20 ~as determined by the alignment layer dimensions and material!. It is likely that on a time scale of hours, ions drift completely through the alignment layer material. As a result, the Debye layer discussed above forms at the interface between the alignment layer and the ITO layer. In terms of performance degradation, then, the thickness, i.e., the capacitance, of the alignment layers is irrelevant. The increase in ion populations results from the inability of the mobile nonadsorbed ions to recombine with the adsorbed ions. If the adsorption energy of both ionic species were comparable, then the two ions would adsorb symmetrically, and upon removal of the dc bias, both ions would either remain adsorbed on the alignment layers or dissociate from the alignment layers and recombine in the bulk of the cell. In either case, the population of mobile ions would not increase. With selective adsorption, as one species of ion continues to be adsorbed, additional thermally generated ions serve either to reestablish the thermal equilibrium ion concentration in the bulk or to provide additional shielding of an applied field. Even in the absence of an applied voltage, adsorption takes place; however, since the adsorption rate is proportional to the concentration of ions at the interfaces the process is significantly slower. Computer modeling indicates that application of 2.5 V across a test cell of the type used in this study increases ion concentrations at the alignment layers by as much as five orders of magnitude. We have observed experimentally that a period of days is required for adsorption to saturate when a 2.5 V bias is applied to a cell ~see Fig. 1!. Accordingly, adsorption saturation in a cell with no applied voltage would be negligible in any reasonable lifetime of the cell. If the adsorption energy is comparable to the thermal energy, kT, the process might be reversed by
Appl. Phys. Lett., Vol. 69, No. 9, 26 August 1996 Perlmutter, Doroski, and Moddel 1183 Downloaded¬15¬Dec¬2006¬to¬128.138.248.77.¬Redistribution¬subject¬to¬AIP¬license¬or¬copyright,¬see¬http://apl.aip.org/apl/copyright.jsp
heating. No measurements of the absorption energy were made; this study cannot address questions concerning the reversibility of the adsorption process. It is probable that a distribution of adsorption energies exists. A consequence of selective adsorption is that liquid crystals with higher concentrations of intrinsic ionizable species will show greater performance degradation due to ions. The results of this study suggest that an alignment layer material that does not adsorb ions ~or that does adsorb ions, but does so symmetrically! would reduce performance degradation due to ions. In addition, as the ion adsorption rate is proportional to the concentration of ions at the interface, the rate of performance degradation can be reduced by preventing the development of large ion concentrations at the interfaces through the use of a balanced driving voltage of sufficiently high frequency. The authors acknowledge support from the National Science Foundation Engineering Research Center Grant No. EEC-9015128 and by the Colorado Advanced Technology Institute, an agency of the State of Colorado. The authors would also like to acknowledge helpful conversations with Dr. Noel Clark, Department of Physics, University of Colorado. 1
N. A. Clark and S. T. Lagerwall, in Ferroelectric Liquid Crystals, edited by J. W. Goodby et al. ~Gordon and Breach, Philadelphia, 1991!, Chap. 1, pp. 1–97. 2 G. Moddel, in Spatial Light Modulator Technology: Materials, Devices,
and Applications, edited by U. Efron ~Dekker, New York, 1995! Chap. 6, pp. 287–359. 3 H. Mada and S. Yoshino, J. Appl. Phys. 27, L1361 ~1988!. 4 A. Mochizuki, T. Yoshihara, K. Motoyoshi, and S. Kobayashi, Jpn. J. Appl. Phys. 29, L322 ~1990!. 5 H. Naito, K. Yoshida, and M. Okuda, J. Appl. Phys. 73, 1119 ~1993!. 6 A. Sugimura, H. Sonomura, H. Naito, and M. Okuda, Phys. Rev. Lett. 63, 555 ~1989!. 7 H. Mada, J. Appl. Phys. 29, L123 ~1990!. 8 H. Mada and H. Suzuki, Jpn. J. Appl. Phys. 26, L1092 ~1987!. 9 S. T. Lagerwall, J. Wahl, and N. A. Clark, Conference record of the 1985 International display Research Conference ~1985!, pp. 213–221. 10 J. Dijon et al., Society for Information Display International Symposium, Anaheim, CA, May 1988, Digest of Technical Papers ~SID, California, 1988!, pp. 246–249. 11 K. H. Yang, T. C. Chieu, and S. Osofsky, Appl. Phys. Lett. 55, 125 ~1989!. 12 C. Escher, H.-R. Du¨bal, T. Harada, G. Illian, M. Murakami, and D. Ohlendorf, Ferroelectrics 113, 269 ~1991!. 13 S. H. Perlmutter, D. Doroski, P. R. Barbier, S. Wichart, and G. Moddel, OSA Annual Meeting, Vol. 23, OSA Annual Meeting Technical Digest Series ~Optical Society of America, Washington, DC, 1992!, p. 82. 14 J. Vaxivie`re, B. Labroo, and P. Martinot-Lagarde, Mol. Cryst. Liq. Cryst. 173, 61 ~1989!. 15 B. Maximus, E. D. Ley, A. D. Meyere, and H. Pauwels, Ferroelectrics 121, 103 ~1991!. 16 Z. Zou, N. A. Clark, and M. A. Handschy, Ferroelectrics 121, 147 ~1991!. 17 Y. Inaba, K. Katagiri, H. Inoue, J. Kanbe, S. Yoshihara, and S. IIjima, Ferroelectrics 85, 255 ~1988!. 18 T. C. Chieu and K. H. Yang, Appl. Phys. Lett. 56, 1326 ~1990!. 19 G. Barbero and G. Durand, J. Appl. Phys. 67, 2678 ~1990!. 20 S. H. Perlmutter, D. Doroski, and G. Moddel, Ferroelectrics 149, 319 ~1993!. 21 T. C. Chieu and K. H. Yang, Jpn. J. Appl. Phys. 28, 2240 ~1989!.
1184 Appl. Phys. Lett., Vol. 69, No. 9, 26 August 1996 Perlmutter, Doroski, and Moddel Downloaded¬15¬Dec¬2006¬to¬128.138.248.77.¬Redistribution¬subject¬to¬AIP¬license¬or¬copyright,¬see¬http://apl.aip.org/apl/copyright.jsp