Delamination Detection in Composite Structures using Laser Vibrometer Measurement of Lamb Waves Hoon Sohna*, Eric D. Swensonb, Steven E. Olsonc, Martin P. DeSimioc and Debaditya Duttad a Korea Advanced Institute of Science and Technology, Daejeon, Korea b United States Air Force Institute of Technology, Wright-Patterson AFB, Ohio, 45430 c University of Dayton Research Institute, Dayton, Ohio 45469 d Carnegie Mellon University, Pittsburgh, PA 15213 ABSTRACT In this study, the feasibility of using a scanning laser vibrometer for detecting hidden delamination in multi-layer composites is explored. First, Lamb waves are excited by Lead Zirconate Titanate (PZT) transducers mounted on the surface of a composite plate, and the out-of-plane ultrasonic velocity field is measured using a 1D scanning laser vibrometer. From the scanned time signals, wave field images are constructed and processed to study the interaction of Lamb waves with hidden delamination. In order to highlight the defect area in the image, the performance of different image processing tools were investigated. In particular, the Laplacian image filter was found to accentuate the interaction of the ultrasonic waves with the defect by suppressing the presence of incident waves in the wave field images. The performance of the proposed scheme is investigated using experimental data collected from a 1.8 mm thick multi-layer composite plate and a 10 mm thick composite wing structure. Keywords: Guided Waves, Laser Vibrometer Scanning, Delamination Detection, Composite Structures
1. INTRODUCTION In recent years, there has been an increasing demand for structural health monitoring (SHM) that apprises users of the integrity and safety of the structure being monitored1. SHM often infers the current condition of the structure based on a streamline of data collected from installed sensors. Guided waves have emerged as one of the very prominent options for SHM due to its well established theories from nondestructive evaluation and testing (NDE/NDT) fields, a relatively long sensing range, and advancement in transducer technologies used for guided wave sensing and excitation, to name a few. Guided waves are specific types of elastic waves confined by the boundaries of a structure. For instance, when a plate structure is excited at a high frequency, the top and bottom surfaces of the place “guide” the elastic waves along its axis, producing a specific type of guided waves called Lamb waves2-4. Various types of transducers can be used for the excitation and sensing of guided waves. The most commonly used transducers include angled piezoelectric wedge transducers, electromagnetic acoustic transducers, comb transducers, surface-bonded piezoelectric wafer transducers, and piezocomposite transducers. Some transducers are mainly used for sensing applications such as polyvinylidene fluoride (PVDF) and fiber optic sensors5. Although each transducer mentioned here has its own strength and weakness, all of them are primarily used for discrete point measurements. Therefore, a dense array of transducers is required to achieve a good spatial resolution and cover a large inspection area. A potential solution to this problem is to use scanning laser techniques for creating wave field images with a high spatial resolution. One possible option is to excite a simple fixed point using a conventional wired transducer and scan guided wave responses using a laser vibrometer6. Although a 1D vibrometer can only measure out-of-plane velocities, 3D wavefield can be constructed using a 3D vibrometer7. Conversely, a moving Nd-Yag laser source can generate guided waves at arbitrary locations and the corresponding response can be measured at a single point8,9. In this study, a 1D scanning laser vibrometer and imaging techniques are utilized to detect hidden delamination in multilayer composites. First, a single fixed piezoelectric transducer is remotely excited by a laser source and the corresponding out-of-plane velocities are measured by a scanning laser vibrometer. The wave field images are then constructed from the scanned velocity signals, and the images are processed to highlight the interaction of Lamb waves with delamination. In particular, the Laplacian image filter is found to play up the interaction of ultrasonic waves with delamination.
[email protected] Tel: (82)+42-350-3625
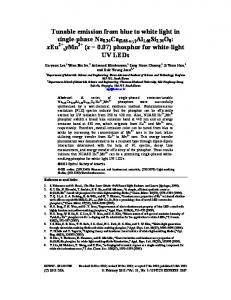
Figure 1: Overall configuration for laser based guided wave excitation and sensing experiment
This paper is organized as follows. First, the working principle of a scanning laser vibrometer is described. Next, the ultrasonic images obtained from the composite specimens are presented. Finally, the paper concludes with a brief summary.
2. EXPERIMENTAL SETUP Figure 1 shows the overall configuration of the experimental setup used in this study. As for excitation, an arbitrary waveform generator with a piezoelectric transducer and a power amplifier is used to generate guided waves in the test article. Then, the guided wave responses in a specified area are scanned by a laser vibrometer, and the data is collected by a built-in data acquisition system. Then, the data is exported to the MATLAB® software program and processed on a personal computer. In the following subsections, each aspect of the proposed experiment is described in further details. The test articles include a simple composite plate and an aircraft wing section. 2.1 Guided wave excitation First, user specified waves are generated using an arbitrary waveform generator. In our experiments, a 6 peak tone burst signal at a certain driving frequency (between 100 to 300 kHz) is used most of the times. Then, the excitation voltage is amplified up to ±50 V using a power amplifier and applied to a piezoelectric transducer (made from lead zirconate titanate, better known as PZT). 5AH type PZT transducers are used and the actual sizes of the transducers are different for different experiments. The excitation signal triggers data collection so that the excitation and response signals are properly synchronized. 2.2 Guided wave sensing The guided waves generated by the PZT transducer are measured by a Polytec PSV-400 scanning laser Doppler vibrometer. The 1D vibrometer used in this study measures the out-of-plane velocity across the scanned surface of the specimen using the principle of Doppler frequency-shift effect on light waves10. The scanning is done by steering the laser beam to the desired location using deflection mirrors which are built into the laser head. The time response at each
measurement point is averaged 30 to 50 times to improve the signal to noise ratio, and a band pass filter is applied to eliminate exogenous noise outside the driving frequency band. A sampling rate of 5.12 MHz and a sensitivity of 10 mm/s/V are used for all cases unless specified otherwise. In order to create a high resolution wave field image it is important to have small measurement grid size compared to the wavelengths of the guided waves. Assuming a scanning area of 100 cm2 with 100×100 measurement points and 30 times averaging, it takes about 2-3 hours to collect all the time signals and create wave propagation images. Once all the data are collected, it is converted to a universal file format and exported to the MATLAB® software program. 2.3 Signal processing Once all the data are imported to MATLAB® all further processing of the data is conducted using MATLAB® . Basically, four operations are conducted here. First, the raw time signals are passed through a wavelet or a Butterworth filter to reduce noise and examine wave propagation within a narrow frequency band11. Second, a video of wave propagation in the structure is constructed from the out-of-plane velocity information using the MATLAB® graphics tools. Third, the mean-square value of out-of-plane velocity at each scan point is computed at a given point of time:
1 E ( x, y , t ) 2
t
v 2 ( x, y, )d
(1)
0
where E(x,y,t) is the mean-square value at the scan location (x,y) at time t; v(x,y,) is the out-of-plane velocity at the same scan location at time . The mean square value represents the cumulative kinetic energy which is the total amount of ultrasonic energy that has passed through a certain point until that time. Note that the kinetic energy corresponding only to the out-of-plane velocity is captured using a 1D vibrometer.
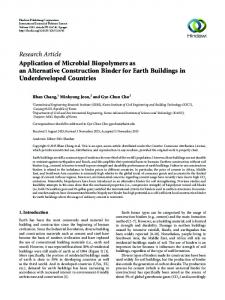
Scan area
Figure 2: A multi-layer composite plate with impact-induced delamination
(a) Impact surface (b) Back surface Figure 3: Nondestructive thermographic imaging of the composite plate
The fourth and final operation involves the application of image filtering tools in order to accentuate the interaction of the ultrasonic waves with delamination. As will be seen later in this paper, a delamination area corresponds to high ultrasonic activity compared to its immediate neighborhood. This high activity manifests itself as a blob in the cumulative kinetic energy field. Therefore the performances of several image filters for blob or edge detection have been investigated. In particular, the derivative filters like Sobel and Laplacian were found to highlight the defect area successfully12. The images obtained by applying the Laplacian image filter on wave-propagation as well as cumulative kinetic energy snapshots are presented in this paper.
3. EXPERIMENTAL RESULTS This section presents the experimental results obtained from the composite specimens mentioned. Section 3.1 presents the results from the graphite plate specimen and section 3.2 presents the same from the composite wing specimen. 3.1 Delamination detection in a simple composite plate Figure 2 shows the composite specimen tested in this study. This 275 mm by 275 mm square composite plate with a thickness of 1.8 mm was fabricated from IM7 graphite fibers with 977-3 resin material, and it consists of 14 piles with a layup of [02/45/0/45/]s. The test article was subjected to several impact tests, and the formation of internal delamination near the center of the plate was confirmed from nondestructive thermographic imaging as shown in Figure 3. The impact damage could be seen on the back side of the impact as show in Figure 2, but only a small dent was barely visible to the naked eye on the impact side of the specimen. A 6-peak tone burst signal at 100 kHz was used as the input waveform. The output voltage from the arbitrary waveform generator was 10 V and it was amplified up to 50 V using a power amplifier before being applied to the excitation PZT. One out of the eight PZT transducers installed on the backside of the impact was designated as the excitation PZT as shown in Figure 2. For each measurement point, the same excitation was repeated 20 times and the corresponding responses were averaged in the time domain. The laser vibrometer was placed about 0.8 m away from the test article, and the sensitivity of the velocity measurement was set to be 10 mm/s/V. A sampling frequency of 2.56 MHz and a band pass filer with lower and higher cutoff frequencies of 75 kHz and 125 kHz were used. No special treatment of the specimen’s surface was necessary. The reverse side of the impact was scanned using the laser vibrometer as shown in Figure 2. The grid spacing produced a spatial resolution of 12 points per cm. This was small enough compared to the wavelength of the slowest mode (A0) in the specimen at 100 kHz. From empirical analysis / dispersion curves, this wavelength was found to be around 1cm. The complete data collection took about 40 minutes. Once the time signals were imported to MATLAB® , the wave propagation video is created using MATLAB® graphic
(a) 99 µs
(a) 99 µs
(b) 139 µs
(b) 139 µs
(c) 200 µs
(c) 200 µs
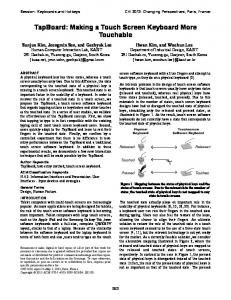
Figure 4: Lamb wave propagation snapshots
Figure 5: RMS energy propagation snapshots
tools. Each frame in the video represents the out-of-plane velocity field across the surface of the target specimen. The snapshots at three representative time points are shown in Figure 4. In Figure 4 (a), the incident waves can be clearly seen, and the interaction with the delaminated area is apparent in Figure 4 (b). Additional scattered waves and reflections from the plate boundaries are visible in Figure 4 (c). The wave interaction with the delamination becomes more prominent when the cumulative kinetic energy propagation images are created as shown in Figure 5. The figure clearly illustrates energy concentration over time near the delamination.
(a) 99 µs
(a) 99 µs
(b) 139 µs
(b) 139 µs
(c) 200 µs
(c) 200 µs
Figure 6: Lamb wave propagation snapshots (with Laplace filtering)
Figure 7: RMS energy propagation snapshots (with Laplace filtering)
Next, Laplacian image filtering is applied to the data shown in Figures 4 and 5, and the filtered wave field images are shown in Figures 6 (wave propagation) and 7 (cumulative energy propagation), respectively. It is observed that Laplacian filtering highlights the wave interaction with delamination while reducing the appearance of the incident and the reflected waves in the images. This image processing can be potentially useful for the development of an automated delamination detection algorithm since it brings up the effect of delamination.
(a) Top surface
(b) Cross section
Figure 8: Configuration of an Aircraft Wing Section
3.2
Disbond detection in a composite wing section
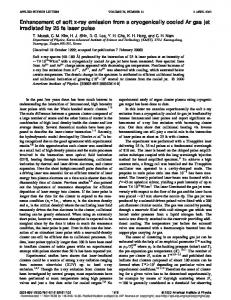
The same data acquisition and signal processing techniques as described in section 3.1 are now applied to a composite wing section (Figure 8). The wing section consists of a curved top skin layer, a flat bottom surface and four spars connecting the top and bottom surfaces. The thicknesses of the two surfaces are about 10 mm, and the thicknesses of the spars are about 5mm. The exact material properties of the wing were not provided to the investigators. 40 PZT transducers are instrumented on the top surface, and additional 40 PZTs are placed on the bottom surface. In this study, one of the PZTs on the bottom surface was excited and the corresponding guided wave responses were scanned in the rectangular area (145 mm by 135) shown in Figure 9. Note that there is a spar underneath the scanned area, and a defect was introduced in this scanned area at the connection between the inside surface and the spar as shown in Figure 10. NDE ultrasonic scanning confirmed the existence of this defect along with two additional small manufacturing defects marked on the bottom surface in Figure 10. The same overall procedure for excitation and sensing of guided waves was used as in the previous section. The specimen was tested with tone burst signals at several different center frequencies. The results corresponding to the driving frequency of 300 kHz is reported here. The sampling frequency was set to 5.12 MHz and the number of averages was increased to 50. Also, the lower and higher cut-off frequencies of the band pass filter were set to 225 kHz and 375 kHz respectively in order to accommodate for the higher driving frequency. The other vibrometer settings like grid density, sensitivity, etc. remained same as in the previous section. A big difference between this wing section test and the previous simple plate experiment is that significant signal attenuation and reflection are observed when the propagating Lamb waves confront the spar. This produces a large scale difference in Lamb wave energies before and after the spar is encountered. As a result, the disbond area is only dimly illuminated by the ultrasonic waves. To put things in a better perspective, a natural log scale is used when the evolution of the cumulative energy is visualized in Figure 12. At 69 s, the interactions of the Lamb waves with three defect locations, one arc and two small circle areas, are clearly visible. It is noteworthy that the visibility of the defect in this experiment is very much dependent on the time of the snapshot. The reason behind this time sensitivity is discussed in the following paragraph. In a parallel study done by the authors, it has been observed that the out-of-plane velocity component of the fundamental symmetric mode (S0) is negligible compared to that of the fundamental anti-symmetric mode (A0). In the present experiment, it is conjectured that the S0 mode hits the disbond around 69 s (Figure 12 (b)) and gets converted to the A0 mode. As a result, the visibility of the defect suddenly increases around that time (because of the higher out-of-plane velocity component of A0 mode at the defect location compared to the lower out-of-plane velocity component of the S0
Spars
Bottom surface
Debonding areas confirmed by NDE scan Excitation PZT
Damaged Area Scan (145mm x 135 mm)
Figure 9: Scanning of the debonding appeared at bottom surface of the aircraft wing section
Figure 10: Damaged area near the connection between the bottom surface and the spar
(a) 36 µs
(b) 69 µs
(c) 200 µs
Figure 11: RMS energy propagation (log scale)
mode in the neighborhood). As time progresses, A0 mode excited by the actuator floods the defect neighborhood and the contrast of the defect is reduced (although it still remains discernable at 200 s in Figure 12 (c)). Because of the significantly low ultrasonic energy in the defect region compared to the region near the actuator, the Laplacian filter was not effective in this case. As a rule of thumb, the Laplacian filter is effective only when there is no structural feature (like spar) between the actuator and the defect. This observation is made by the authors based on several other experiments not reported in this paper.
4. CONCLUSION This paper deals with the application of laser vibrometer imaging to detect hidden delamination and disbond type defects in composite materials. Two specimens were tested for this study. One is a simple graphite plate subjected to impact damage. The other is a composite wing section with two main plates connected with intermittent spars. The disbond was introduced at the connection between one of the plates and a spar. Guided waves were excited in the specimens using piezoelectric transducers and a 1D scanning laser vibrometer was used to acquire the out-of-plane velocity field information across the scanned surface. Graphic tools in MATLAB® were used to create wave propagation videos as well as the videos of evolution of cumulative kinetic energy in the specimen. Both delamination and disbond areas were found to exhibit high ultrasonic activity which was manifested especially in the images of cumulative energy field. Further image processing was done to bring up the defect area from the background of incident waves. In particular, the Laplacian filter was found effective in highlighting the damage area. The uniqueness of this study lies in the examination of the interaction of ultrasonic waves with hidden delamination and disbond types of defects and the application of image filters to further accentuate such interactions. The image processing technique, however, is found ineffective in presence of structural features like spars when the defect is on the leeward side of the spar. The investigators are looking into new ways of image processing to make those effective for structures with complex geometries. A physics based explanation of high cumulative energy at the defect location is also envisioned as part of our future work.
ACKNOWLEDGEMENTS This work was supported by the Radiation Technology Program (M20703000015-07N0300-01510) and the Nuclear Research & Development Program (2009-0083489) of National Research Foundation of Korea (NRF) funded by Ministry of Education, Science & Technology (MEST). Any opinions, findings, and conclusions or recommendations expressed in this material are those of the authors and do not necessarily reflect the views of the funding agencies.
REFERENCES 1.
Sohn, H. et al. A review of structural health monitoring literature: 1996-2001. Los Alamos National Laboratory, Technical Report LA-13976-MS, USA (2003).
2.
Lamb, H. On waves in an elastic plate. Proceedings of the Royal Society of London. Series A, Containing papers of a mathematical and physical character 93, 114–128 (1917). 3. Achenbach, J.D. Reciprocity in Elastodynamics. (Cambridge University Press: 2004). 4. Auld, B.A. Acoustic Fields and Waves in Solids, 2 Vol. Set. (Krieger Publishing Company: 1990). 5. Raghavan, A. & Cesnik, C.E. Review of guided-wave structural health monitoring. The Shock and vibration digest 39, 91–114 (2007). 6. Leong, W.H., Staszewski, W.J., Lee, B.C. & Scarpa, F. Structural health monitoring using scanning laser vibrometry: III. Lamb waves for fatigue crack detection. Smart Materials and Structures 14, 1387–1395 (2005). 7. Staszewski, W.J., Lee, B.C. & Traynor, R. Fatigue crack detection in metallic structures with Lamb waves and 3D laser vibrometry. Measurement Science and Technology 18, 727–739 (2007). 8. Lee, J.R., Takatsubo, J., Toyama, N. & Kang, D.H. Health monitoring of complex curved structures. Measurement Science and Technology 18, 3816–3824 (2007). 9. McKie, A.D.W. & Addison Jr, R.C. Rapid inspection of composites using laser-based ultrasound. Review of Progress in Quantitative Nondestructive Evaluation. 12 A 507–516 (1992). 10. Polytec GmbH & Polytec GmbH Non-contact vibration measurement - Polytec offers scanning laser vibrometers to measure & visualize structural vibrations without accelerometer and provide data to modal analysis in the automotive, aerospace, MEMS, manufacturing and R&D markets. (2010).at 11. Strang, T.N.G. Wavelets and Filter Banks. (Wellesley College: 1996). 12. Gonzalez, R.C., Woods, R.E. & Eddins, S.L. Digital Image Processing Using MATLA. (Prentice Hall: 2003).