Send Orders for Reprints to
[email protected] 130
The Open Civil Engineering Journal, 2014, 8, 130-135
Open Access
Delay Measurement of Manually Controlled Intersection Using GPS S. Nithya*,1, D. Senthurkumar2, and K.Gunasekaran3 1 2 3
Research Scholar, Division of Transportation Engineering, Anna University, Chennai-25, Tamil Nadu, India Former PG Student, Division of Transportation Engineering, Anna University, Chennai-25, Tamil Nadu, India Associate Professor, Division of Transportation Engineering, Anna University, Chennai-25, Tamil Nadu, India Abstract: The travel time studies are one of the most important measures used for evaluating the performance of road networks. The Global Positioning System (GPS) is a space-based system that provides position and time information in all weather conditions. GPS data could be used to obtain the values of traffic control delay, vehicle queue, average travel time and vehicle acceleration and deceleration at intersections.The task of estimation of delay becomes complex if it is performed for intersections carrying heterogeneous traffic and that to for over saturated conditions. Most of the urban signalized intersections are manually controlled during peak hours. GPS device fitted in a vehicle was run repeatedly during morning peak period and the period during which vehicles were allowed to cross the intersection was recorded with video graphic camera. The attempt to identify the control delay with the GPS data from the test vehicle while crossing manually operated major intersection is presented in this paper.
Keywords: Control delay, GPS, queue length, travel time. 1. INTRODUCTION Intersection delay has a significant impact on the efficient function of an intersection. There is abundance of methods available to measure the intersection delay. Delay at the intersection can be quantified in the following methods. stopped delay, control delay, approach delay, mid block delay, volume delay, geometrical delay, incidental delay and segment delay [1]. The intersection delay models widely used may be the Webster’s Delay model, TRANSYT model, Akcelik model and HCM model. But these delay measurements are found to be realistic only when the signals are operated with fixed timings. In oversaturated condition of traffic flow with different static and dynamic characteristics most of the vehicles move in the available lane space, in that situation the accuracy of prediction of control delay is found to be unrealistic. Now-a-days, GPS device is widely used in the prediction of delay from travel time studies. The GPS device used on any vehicle is capable of recording the test vehicles position (latitude and longitude), acceleration, deceleration, distance and speed at specified points. When the test vehicle travels with normal speed along with majority of the vehicles in a traffic flow, the exact path of the test vehicle is identified through satellite signals which are recorded by the GPS device. Each data point recorded by the GPS device includes the vehicle position, speed, time and the distance between the current and the last time points. *Address correspondence to this author at the Research Scholar, Division of Transportation Engineering, Anna University, Chennai-25, Tamil Nadu, India; Tel:+91-44-28351126; Fax: +91-44-42085184; E-mail:
[email protected]
1874-1495/14
For measuring the controlled delay of manually operated signalized intersection with varying traffic flow it is necessary to measure the exact position, entry and exit points of the test vehicle, varying cycle length at the intersection. These parameters can be used to accurately measure the control delay. These parameters could be extracted from a video graphic recording. To analyze this complex traffic flow a video graphic data could be used to predict the control delay by exactly locating the position of the test vehicle in the available traffic queue. The issues discussed in this paper are control delay and stopped delay measurement in the study stretch. 2. BACKGROUND The control delay is a portion of the total delay which includes all the delay components, including geometric delay, volume delay and incident delay [1]. Many models have been developed to analyze the traffic flow with homogeneous traffic such as Webster’s Delay model [2], TRANSYT model, Akcelik model and HCM model [3]. Only few studies have been conducted to analyze the delay at signalized intersection for heterogeneous traffic flow for signal optimization [4, 5], where the efficient function of the intersection is affected by delay components [6]. But practically, it is very complicated to measure these delay components exactly from the existing data. GPS provides a convenient way to measure the travel time data for very accurate location and speed comparison [4, 7]. Joonho Ko, Michael Hunter, Randall Guensler [8] suggest a methodology to measure the control delay based on GPS
2014 Bentham Open
Delay Measurement of Manually Controlled Intersection Using GPS
The Open Civil Engineering Journal, 2014, Volume 8
131
data. They identified the critical points (acceleration/ deceleration) profile from the speed difference in the test vehicle at fixed signal timings. The intersection control delay can also be taken as the sum of deceleration delay, stopped delay including queue move up time, and acceleration delays. While the test vehicle crawl forward towards the junction where the speed profile is less than 2.5 km/h it is considered as stopped delay. The measurement of these delay components is found to be realistic only for fixed timing of signals at the intersection. The proposed model suggests a methodology for measuring the control delay at manually operated signalized intersection.
4. METHODOLOGY
3. DELAY MEASUREMENTS
4.2. Study Stretch
This paper contemplates on the control delay measurement using the test vehicle GPS data and from the video graphic recording simultaneously done on the same day. The real time complexities at the study junction have to be balanced by the effectiveness in the data collection. All intersection data were collected using two video cameras. First camera was used for measuring the signal timings and intersection flow volume. Second one was used to measure the queue length of the study approach and also to identify the position of test vehicles in the queue. It was also used to measure the stopped delay in each lane for every 5 sec and to estimate the extent of stopped delay for the test vehicle. The signal operation turns to manual in the morning hours from 7.30 am to 12.00 pm and the average cycle time in the study stretch was found to be 192 sec. It has been evaluated that the length of the cycle and the position of the test vehicle in the queue affects the control delay which predicts the overall performance of the intersections.
The study stretch includes the length of the road stretch from smith road junction to a location after (300 metres after Spencer Intersection) Spencer junction. These routes connects the central business district with major commercial, educational and residential zones. The length of study stretch is 600 m.The test vehicle was used to run in the study stretch for four and a half hours from 7.30 am to 12.00 pm. The study utilizes the benefits of GPS to analyze the travel time and control delay and converts the results to useful form for congestion analysis in heterogeneous conditions. Simultaneously, two video graphic cameras were used to measure the signal timings queue length and to exactly predict the location of the test vehicle.
Fig. (1). Study stretch.
4.1. Data Collection The following data were collected in the study intersection:
Intersection Geometry
Signal timing(including the signal timings adopted during the manual control operation)
Proportion of traffic flow in the study stretch
Queue length in the study stretch
4.3. Control Delay Measurement for the Study Stretch A methodology has been developed to measure the control delay using GPS for manually operated signalized intersection. Also, a comparison of control delay has been
132 The Open Civil Engineering Journal, 2014, Volume 8
Nithya et al.
the test vehicle were examined with the real time video graphic data. The test run 1 gave the profile of the sample run with zero stopped delay. The deceleration delay was taken as the time difference between the critical points of the deceleration start and end points in the speed profile. Similarly, the time difference between the critical points from the start point to the end point of acceleration in the speed profile was considered as the acceleration delay. For the run 5 the speed profile with stopped delay where the speed of the test vehicle varied from 2.50 km/hr to 0.00 km/hr [8].
suggested from the vehicle arrival pattern, by examining the test vehicle location from the video graphic recording. 12 sample runs were used to identify the deceleration and acceleration profile by detecting the critical points. When the test vehicle approached the Spencer junction the speed profile was used for locating the deceleration beginning point and the deceleration end point. But when the test vehicle crawled forward towards the junction where the speed profile was less than 2.5 km/hr then it was considered as stopped delay in the speed profile [8]. Similarly, the acceleration beginning and acceleration end points were predicted from the speed profile data by locating the critical points. The actual cycle time on each run and the distance where the test vehicle was exactly positioned from the stop line was evaluated from the GPS data and from the video records.
The profiles given in Fig. (2a & 2b) are original data without smoothening process. The computation of the control delay [8] applies the methodology of summation of all three delay components. The delay components at major intersections during manual operation vary depending upon the cycle time.
4.4. Prediction of Deceleration, Stopped Delay and Acceleration Delay
5. RESULTS AND DISCUSSIONS
12 sample runs in the test vehicle were used to measure the delay components. The flow pattern of the two random sample runs was given in Fig. (2). The flow characteristics of
Fig. (3) illustrates the compositions of delay components for the 12 sample runs. The deceleration delay tends to be more or less the same as acceleration delay which is mainly
45 40 35 30 25 20 15 10 6 0 0
2
4
6
8
10
12
14
16
18
20
22
24
26
28
30
32
34
36
38
0
2
4
6
8
10
12
14
16
18
20
22
24
26
28
30
32
34
36
38
40 42 S ec onds
44
44
48
50
52
54
56
58
60
62
64
66
68
70
72
74
76
78
80
82
40
44
44
48
50
52
54
56
58
60
62
64
66
68
70
72
74
76
78
80
82
44
44
48
50
52
54
56
58
60
62
64
66
68
70
72
74
76
78
80
82
0.2 0.1 0 -0.1 -0.2 -0.3 -0.4 -0.5 42
Seconds 800 750 700 650 600 550 500 450 400 350 300 250 200 150 100 50 0 0
2
4
6
8
10
12
14
16
18
20
22
24
26
28
30
32
34
36
38
40 42 Seconds
Fig. (2a). Speed, acceleration and distance profile. 30 28 26 24 22 20 18 16 14 12 10 8 6 4 2 0 0
5
10
15
20
25
30
35
40
45
50
55
60
65
70
0
5
10
15
20
25
30
35
40
45
50
55
60
65
70
0
5
10
15
20
25
30
35
40
45
50
55
60
65
70
75 Seconds
80
85
90
95
100
105
110
115
120
125
130
135
140
145
75 Seconds
80
85
90
95
100
105
110
115
120
125
130
135
140
145
75 Seconds
80
85
90
95
100
105
110
115
120
125
130
135
140
145
0.6 0.4 0.2 0 -0.2 -0.4 -0.6 -0.8 -1 -1.2
280 260 240 220 200 180 160 140 120 100 80 60 40 20 0
Fig. (2b). Run 5 - Speed, acceleration and distance profile.
Delay Measurement of Manually Controlled Intersection Using GPS
The Open Civil Engineering Journal, 2014, Volume 8
133
100% 90% 80% 70% 60% 50%
Deceleration Delay
40%
Stopped Delay
30%
Acceleration Delay
20% 10% 0% 1
2
3
4
5
6
7
8
9
10 11 12
Sample Run Fig. (3). Proportion of deceleration, stopped and acceleration delay. Table 1.
Total acceleration, stopped, deceleration delay in test vehicle
Sample
Acceleration Delay
Stopped Delay
Deceleration Delay
Control Delay
RUN1
15.53
0
17.46
32.99
RUN2
14.94
0.88
13.58
29.4
RUN3
12.4
7.52
11.48
31.4
RUN4
20.09
8.78
10.22
39.09
RUN5
15.22
95.95
11.03
122.2
RUN6
7.92
0
7.44
15.36
RUN7
4.61
11.33
13.28
29.22
RUN8
17.31
2.94
7.35
27.6
RUN9
9.47
0.4
17.3
27.17
RUN10
10.69
2.9
8.18
21.77
RUN11
13.92
19.95
8.3
42.17
RUN12
7.16
1.36
10.46
18.98
Total delay (Sec)
due to the merging of vehicles at the far end of the queue in the particular cycle. The position of the vehicle in the intersection lane predicts the length of the stopped delay. As the study intersection signal is manually operated the average length of the cycle is 192 sec.The maximum length of the stopped delay for vehicles joining the queue at the initial stop line, affects the overall performance of the intersection. From the video graphic survey it is validated that the control delay calculated from the test vehicles matches with the delay evaluated from the video graphic survey. The delay components vary with the cycle length of the manually operated signalized intersection, position of the
437.35
test vehicles in queue, proportion of the heterogeneous traffic at the intersection. The delay computations are summarized in Table 1. From Table 1 the sample runs 1,2, 6 and 9 give the delay profile for the vehicle with zero stopped delay, from the video graphic survey the test vehicle was identified at the far end of the vanishing queue. The average acceleration delay for the test vehicle is 11.4 sec and the average acceleration delays for the test vehicle is 12.4 sec. For RUN5 the stopped delay for the test run is 95.95 sec, and the control delay is 155.5 sec, it is mainly due
134 The Open Civil Engineering Journal, 2014, Volume 8
Table 2.
Nithya et al.
Stopped delay from test vehicles position.
Sample
Test Vehicle Waiting Time in the Stretch
Position of Test Vehicle from Stop Line in m
Stopped Delay Measured from GPS Data
RUN 1
0:00:00
nil
0
RUN2
0:00:08
15
0.88
RUN3
0:01:02
4
7.52
RUN4
0:01:06
4.2
8.78
RUN5
0:02:02
1.8
95.95
UN6
0:00:00
nil
0
RUN7
0:01:10
108.93
11.33
RUN8
0:00:30
nil
2.94
RUN9
0:00:00
nil
0.4
RUN10
0:00:35
nil
2.9
RUN11
0:00:40
172.97
19.95
RUN12
0:00:10
83.46
1.36
to the higher stopped delay. It is identified from the video graphic survey, during RUN5 that the vehicle joined the queue at the initial stage of the cycle. The position of the test vehicle in the queue is the main parameter which provides an major impact on stopped delay in the test vehicle. Table 2 gives the position of the test vehicle and the duration at which it accumulates in the queue. Run5 represents the accumulating time of the test vehicle which is about 120.2 sec, from the start of the cycle length (192 sec) that provides an undesirable change on the total stopped delay, where as the Run 11 represents the accumulation of the test vehicle in the far end of the queue 40 seconds after the start of the cycle length ( cycle length is 194 sec) 40 sec. The stopped delay is also influenced by the combination of the vehicle occupying the test run, length of the queue and the cycle time that is used at the particular cycle.
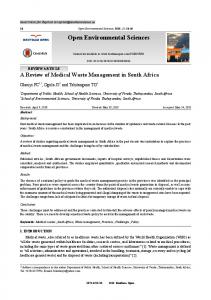
The plot of the stopped delay and the position of the test vehicle from the stop line is shown in Fig. (2). The general form of the stopped delay model for the test vehicles is presented in Equation 1. 2
y = 0.007x – 1.661x + 97.82
(1)
where, y = Delay measured at time t (s) x = Position of the test vehicle from the stop line in (m). For the proposed model travel time and delay are extracted from the GPS data sets for all runs. By comparing the results of GPS data with the actual data measured from the video tape are found to be matching. The model developed is only from 12 set of runs in the test vehicle. In addition, modeling with a large sample size would help in
Distance Vs Delay 120 100 80 60 40 20 0
y= 0.007x2 - 1.661x + 97.82 R2 = 0.974
0
40
80
120
Distance in m Fig. (4). Position of test vehicles.
160
200
Delay Measurement of Manually Controlled Intersection Using GPS
estimating the stopped delay in more detail and developing a more accurate model. RECOMMENDATIONS AND CONCLUSION Traffic operations are highly variable which depends upon the roadway geometry, vehicle type and its characteristics. But for heterogeneous condition, the following conclusions are recommended based on the GPS survey and on the developed model. Acceleration and deceleration delay is 11.4 sec & 12.4 sec for the study intersection. It was found that the stopped delay is the main influencing parameter which affects the total control delay and it is mainly based on the vehicle position in the queue, and the manual control of cycle length. The proposed model developed based on the GPS data provides a fairly representative measure of stopped delay at the study intersection, and the manual control of cycle lenght.
Modeling with more number of samples will help in accurate prediction of the stopped delay at the intersection. The performance of the model will differ for other intersection with varying geometry, traffic and configuration. Further, validating the developed model through simulation software and comparing the results with the real world data will be a scope for further research. CONFLICT OF INTEREST
The Open Civil Engineering Journal, 2014, Volume 8
135
ACKNOWLEDGEMENTS The authors acknowledge the financial assistance provided by UGC to the Civil Engineering Department as CAS Phase I. REFERENCES [1] [2] [3] [4]
[5] [6]
[7]
[8]
B. Hoeschen, D. Bullock and M. Schlappi, “Transportation Research Record” 1917, Transportation Research Board of the national Academics.: Washington, D.C., 2005, pp. 18-27. J.L. Powell, “Field measurement of the signalized intersection delay for 1997 Update of the highway capacity manual. Transportation Research Record 1646, 1998, pp. 79-86. John J.J.S. Sia, Philip C.H.Ching, and P. Ranjitkar. Travel time study of auckland arterial road network using GPS data, 2009. I.C. Mauricio, J.R.F. Regidor, R.C. Santos and N.C.C. Tiglao, “Travel time delay analysis using GIS and GPS,” Proceedings of the Eastern Asia Society for Transportation Studies, vol. l4, Oct. 2003 L. Li, J. Xu, S. Huang and K. Lu, “Delay model for signal controlled intersections,” Proceedings of the 8th world congress on intelligent control and automation, Jinan.: China. July 2010, D. W. Strong, K. Coutage, New calculation method for exisiting and extended hcm delay estimation procedures. Paper submitted for consideration for publication and presentation at the 85 th Annual Meeting of the Transportation Research Board, Washington: DC, January 2006. A. Thiagarajan, L. Ravindranath, K. LaCurts, S. Toledo, J. Eriksson, S. Madden, H. Balakrishnan. VTrack: accurate, energyaware road traffic delay estimation using mobile phones. Proceedings of the7th ACM Conference on Embedded Networked Sensor Systems. Berkeley: California, ACM, (2009). pp. 85-98 J. Ko, M. Hunter, R. Gentler, “Measuring control delay using second –by– second GPS speed data,” Transportation Research Board 2007, Annual Meeting CD- ROM(2007).
The authors confirm that this article content has no conflict of interest.
Received: December 17, 2013
Revised: March 26, 2014
Accepted: March 28, 2014
© Nithya et al.; Licensee Bentham Open. This is an open access article licensed under the terms of the Creative Commons Attribution Non-Commercial License (http://creativecommons.org/licenses/ by-nc/3.0/) which permits unrestricted, non-commercial use, distribution and reproduction in any medium, provided the work is properly cited.