2nd International Conference on Evacuation Modeling and Management
Demand-oriented Traffic Management for Disasters and Incidents Yun-Pang Flötteröda*, Laura Biekera a
Institute of Transport Systems, German Aerospace Center, Rutherfordstrasse 2, 12489 Berlin, Germany
Abstract Traffic simulation has been extensively used as a decision support tool for efficient traffic management in daily life. During disasters and incidents, traffic simulation can further help rescue teams to understand the current traffic state and the possible impacts of proposed strategies and then to make proper decisions. At this point, the changes in traffic demand should also be considered in the simulation to reflect the latest traffic state. In this paper, a demand-oriented traffic management system for disasters and incidents with a web-based portal is introduced. In this system, not only the real-time data from loop and wireless detectors but also traffic simulation are used for reconstructing and predicting the traffic state. Furthermore, four traffic demand categories for disasters and incidents are proposed in the system. Some respective demand characteristics are collected according to historical cases, such as departure pattern and people’s perception about evacuation. Such characteristics will be used in the system, since they have a great influence on the simulated traffic state and the effectiveness of applied strategies. Finally, the approach how to generate the respective special demands for disasters and incidents with consideration of the normal traffic demand is proposed as well.
© 2011 Published by [PUBLISHER CO NAME HERE] Ltd. Selection and/or peer-review under responsibility of [name organizer] Keywords: traffic management; disaster; SUMO;VABENE; traffic simulation
1. Introduction Due to steadily changes in climate and increasing threats from unexpected terrorist actions how to manage traffic efficiently and effectively to minimize lives and goods loss has become an important issue in many metropolitan areas. In addition, major events often result in traffic congestion and large crowds.
* Corresponding author. Tel.: +49-30-67055213; fax: +49-30-67055-291. E-mail address:
[email protected].
2
Flötteröd, Bieker/ Procedia - Social and Behavioral Sciences 00 (2011) 000–000
Once people in such crowds get panic, some tragedies such as Love Parade 2010 in Duisburg, Germany, may occur. Traffic demand is one of the essential information to achieve a successful traffic management during disaster and evacuation management. Different types of activities and disasters result in different amount of traffic demands and different demand patterns. Moreover, different behaviors, such as departure rate during evacuation and people's perception about the severity of disasters, also has a great influence on the development of strategies, on the decisions of director of operations as well as on the performance of traffic management. In order to estimate the impacts of proposed strategies as a support for decision makers traffic simulation has been extensively applied since years, where traffic demand is one of the basic input data and significantly influence the quality of traffic simulation and traffic prognoses. In this regard, the German Aerospace Center has continuously devoted to the topic of disaster and catastrophe management since years. Currently, the project VABENE (VABENE, 2012) has been undertaken. An integrated traffic information and decision-support platform with a demand-oriented approach has been proposed, and the corresponding pilot web portal has been established as well. Moreover, traffic simulation is also applied to provide not only the traffic state on roads without real-time traffic data, but also the short-term traffic prognosis. The proposed demand-oriented approach aims to automatically identify/generate the traffic demand for a given disaster or incident category. In addition to these special traffic demands, other relevant information, such as corresponding collection places, should also be used in the system for simulating traffic state and generating feasible management strategies and evacuation routes. In this paper, an overview about the VABENE System with the focus on the web-portal and the traffic simulation is first given. After that, the data used to generate the normal traffic demand and the proposed traffic demand categories regarding incidents and disasters are explained together with the respective examples and some characteristics. The approach how to generate special traffic demand during disasters and incidents is then described as well. At the end, some remarks and perspectives for the future improvements are given. 2. VABENE system The traffic situation has a major impact on the success of rescue measures during a major incident and a successful traffic management for special events like football matches. The authorities need to get to the relevant places in a short time period and have to find their places as fast as possible. This situation raises the need for a tool which enables the authorities to have an overview of the current traffic situation as well as a prognosis how traffic jams may evolve. The VABENE system provides such a tool called EmerT portal, backed by the microscopic traffic simulation tool SUMO (SUMO, 2012; Behrisch, 2011) which was enhanced by a mesoscopic simulation model to give faster results even for large number of scenarios in big conurbations. The main functions of the EmerT-Portal include display and provision of traffic and accessibility information, traffic forecasting, route planer, network editor as well as analysis of impacts of traffic strategies. In the following, the focus puts on two of the main components in the VABENE system, i.e. the EmerT-Portal and the traffic simulation, mostly related to this study. Further information about the VABENE system can be found at http://vabene.dlr.de/vabene/Aktuelles.htm. 2.1. EmerT portal The EmerT portal is established with the consideration that detailed and well-presented information facilitates the decision process and can contribute to effective problem solving. To properly managing traffic an overview of a comprehensive traffic situation is one of the basic requirements. The EmerT portal supports real-time traffic monitoring based on the information from aerial photos, induction loop,
Author name / Procedia - Social and Behavioral Sciences 00 (2011) 000–000
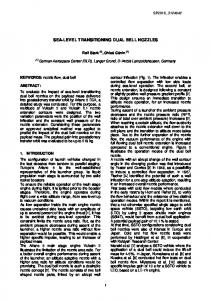
floating cars and other wireless detectors, as well as real-time occupancy rate of parking areas in investigated areas. These different data sources are firstly integrated to obtain an overview of the traffic situation in the whole region and then shown on the web-based EmerT portal prepared for the end user like authorities. Regarding the aerial photos the VABENE system consists of a high-resolution optical camera system and a radar-based sensor system for further capturing traffic related information as much as possible. The optical sensors can detect large areas from the air with a high resolution, while the radar system can detect traffic state even under bad weather conditions and at nights (Baumgartner, 2011). For special events or disasters, the DLR airborne monitoring system can therefore provide more crucial insights. With the traffic simulation tool SUMO it is possible to simulate how the traffic state in the investigated region will be changed by applying different traffic management strategies. Such changes can also be displayed at the EmerT portal to support decision-making. Fig. 1 gives an overview about the EmerT-portal. In order to ensure and improve the adoptability in practices, the EmerT portal was already tested at several demonstration events, during police exercises with the German technical aid association (THW Technisches Hilfswerk) and during the October fest period in Munich respectively. The October fest is the largest public beer festival in the world and about six millions of people travel to Munich yearly to participate this fest. For traffic managers, this event is a big challenge to maintain a functioning traffic network for visitors, rescue teams and logistics.
Fig. 1. The EmerT portal with aerial pictures used in Bonn on the Day of German Unity Air
2.2. Traffic Simulation The traffic simulation tool SUMO allows simulating the traffic of a whole city faster than real time. The requirement for the analysis of crisis scenarios in the VABENE system is to calculate several traffic forecasts for the next 30 minutes in about five minutes. To reach this goal it was necessary to implement a fast simulation model and therefore a mesoscopic queuing model, proposed by Eissfeldt (Eissfeldt, 2004),
3
4
Flötteröd, Bieker/ Procedia - Social and Behavioral Sciences 00 (2011) 000–000
is implemented. In contrast to the microscopic model, where each vehicle has an individual position and speed, the vehicles queue up in edge segments of about 100 meter length and traverse from segment to segment with current delays depending on the jam status (calculated from the number of vehicles in the segment) in the mesoscopic model. The resultant model is about ten to twenty times faster than the microscopic one with deviations in the measured speeds in order of the errors in the input data. In the mesoscopic simulation, the influence of traffic lights on road capacities can also be considered if the respective information is available. Regarding the traffic assignment procedure the user equilibrium (UE) principle is adopted for normal traffic. For special demands caused by disasters or incidents vehicles are assigned to the network by using the current link travel times as they enter the network. It is since vehicles have no information about the overall traffic state during disasters and incidents. Therefore, UE will not be achieved in this case. 3. Traffic demand As one of the basic input data in the traffic simulation, two types of demands are considered here. One is the normal demand, which serves together with the given infrastructure data and SUMO to reproduce the traffic state without disasters or incidents. The other one is the special demand which relates to an occurred disaster or incident. The amount of such demand is various and depends on the types of disasters and incidents, the size and location of the involved area, the respective time of occurrence as well as the duration. The special demand could be part of the normal demand, and could also be an additional demand. 3.1. Normal demand Normal demand refers to the demand happens in a normal daily life. The more precise the amount of the normal demand, the better the reproduction of the investigated traffic state and the expected traffic management quality. However, it is difficult to obtain such information in practice, since travel demand strongly relates to people's activities and changes day to day. The most available demand information is usually the so-called origin-destination matrix (OD matrix), which is generated based on household surveys and census data, and used mainly for transportation planning purposes. In such matrix, traffic demand information is already aggregated to a macroscopic level, i.e. individual traffic demands are aggregated to traffic-zone based demands. For example, the traffic demands are aggregated into around 1000 traffic zones in the greater Berlin area (see Fig. 2), where traffic zones are quite small in downtown areas and become larger in suburban areas. Information about trip purposes and travel modes is also available. Further information regarding trip chains, trip durations and departure times is however not available anymore. It is very time and cost consuming to generate an OD matrix and such a matrix is usually generated and updated every 8-10 years. In order to get a reasonable traffic demand, a matrix update technique with use of detector data is adopted in the VABENE system as well.
Author name / Procedia - Social and Behavioral Sciences 00 (2011) 000–000
Fig. 2. Traffic zones used in the origin-destination matrix in the greater Berlin area
In addition to traditional OD matrices, more and more activity-based traffic demands, derived by different models, becomes available. Such data will be used in VABENE system as well. TAPAS (Travel Activity Pattern Simulation) is one of the models and has been developed by the Institute of Transport Research at DLR. The aim of TAPAS is to reproduce the traffic demand with the highest level of realism possible. Besides of the general travel information, i.e. transport mode, activity type, travel duration, departure time and trip chains, some personal information, for instances gender, age, income and car ownership, is also available. Each trip stop is described with Geo-coordinates and can be easily allocated on any respective digital network with use of the map-matching technique. Fig. 3 gives an overview how TAPAS data is generated. Like OD matrices, it is also time and cost consuming to generate TAPASbased travel demand. Currently, the latest TAPAS data is TAPAS-Berlin based on the survey and census data from 2010/2011.
Fig. 3. The process diagram of the TAPAS model (RENEWBILITY, 2009)
5
6
Flötteröd, Bieker/ Procedia - Social and Behavioral Sciences 00 (2011) 000–000
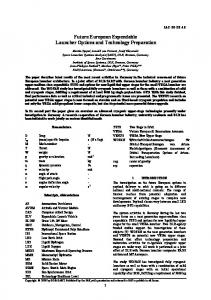
3.2. Special demand Based on the historical disasters and special events and the considerations of possible technological catastrophes in Germany, four special demand categories are taken into consideration in the system in addition to the normal traffic demand. These four demand categories with corresponding examples and their critical characteristics related to the evacuation are explained below. Such characteristics information is used in the simulation in order to reproduce the respective evacuation situation in the simulation environment and obtain a relatively reasonable result. 3.2.1. Demand categories Natural disasters: In Germany, the major natural disaster is flooding. Areas closed to the Elbe River and the Rhine River have been flooded several times. Floods are mostly caused by heavy rain falls or sudden melting of snow. Such floods have resulted mainly in huge damages and losses in goods. The corresponding traffic demand in case of an evacuation strongly depends on the size of the affected area and the population area. Therefore, the traffic demand cannot be estimated in general, but additional information about the flooded area is needed. Respective historical aerial pictures, made by DLR, geographical data and census data can be used to accurately identify the flooding areas and derive the involved populations. Moreover, the affected road infrastructure and other related facilities can be identified as well. Fig. 4 shows an example of the identified area affected by the flood on the River “Schwarze Elster” in Germany on 30th September 2010. About 2,700 people were evacuated successfully from noon to night (9 p.m.) on the same day. People's perception of the evacuation was 100%.
Fig. 4. The floodplain of the schwarze Elster (ZKI)
Incidents at critical facilities: The critical facilities mainly include technical facilities such as nuclear power plants, research reactors and chemical factories. Currently, 17 nuclear power plants and 8 research reactors are in service in Germany. The Structure of the International Nuclear Event Scale
Author name / Procedia - Social and Behavioral Sciences 00 (2011) 000–000
(INES) is applied to measure the severity of occurred nuclear events. Up to now, no severe incidents and failures have occurred according to INES. Based on the records of the reported events from the Federal Office for Radiation Protection (BfS), the number of total reported events is around 3000 from 1999 to 2009. 95.6% of them were events with low significance to safety or events that may have a potential – but no direct – significance to safety. Here, attention is especially paid to the nuclear power plants and the critical facilities near/in earthquake or flooding hazard areas which situate in the Rhine plain between Karlsruhe and Cologne and along the Elbe and Rhine Rivers, respectively. Each nuclear power plant has its own emergency management plan. Based on the definition of the control zones in the emergency management document and the census data, the affected areas, i.e. central area (< 2 km), average area (< 10 km), outer area (< 25 km) and remote area (< 100 km), and the respective involved population in each area can be identified (see Table 1). Table 1 indicates that Biblis A & B and Neckarwestheim 1 & 2 are much more critical than the other nuclear plants. Once a serious nuclear event happens, many million people may need to be evacuated within a short time. The corresponding shelters are also appointed and documented in the emergency management plan. If the radioactive pollution is very serious, people have to stay in the basements of their houses to avoid the radiation damages. For such case, the special demand will be very limited. In additions, the evacuation direction depends not only on the road network structure but also on the wind direction which influences the dispersion of the poisonous materials. Up to now, no respective evacuation in Germany has occurred. Table 1. Number of residents in the surrounding areas of the nuclear plants in Germany Distance from the nuclear plants
25 km
50 km
75 km
100 km
Biblis A & B
1,368,612
4,744,464
7,388,939
10,773,472
Brokdorf
262,377
1,200,938
4,219,419
6,359,782
Brunsbüttel
148,597
751,343
3,627,144
5,931,284
Emsland
232,680
879,067
2,233,305
4,783,212
Granfenheinfeld
308,581
1,036,169
2,514,590
5,606,188
Grohnde
335,799
2,446,470
4,777,208
7,390,315
Gundremmingen B& C
305,673
1,724,552
3,349,544
8,590,134
Isar 1 & 2
253,806
1,165,166
3,916,452
5,731,484
Krümmel
440,133
2,980,955
4,233,208
5,402,914
Neckarwestheim 1 & 2
1,006,798
3,920,386
7,358,357
10,249,645
Philippsburg 1 & 2
823,551
3,460,181
6,714,529
11,825,114
Unterweser
409,065
1,711,138
2,711,628
4,046,694
unit: residents; source: ZDF
Man-caused disasters: Terrorist attacks and incidents with the explosive substances from past wars are mainly considered here. The latter one has often occured in Germany. There are many bombs that are not exploded during the Second World War. Although the german government has continuously search such bombs, many old bombs are still not found yet and sometimes found on some construction sites or in gardens etc. One typical example is the bomb case in Berlin in 2010. During the construction work at the train station Ostkreuz an old aircraft bomb from the Second World War was found. It was too dangerous to transport the bomb so that the bomb had to be defused at the
7
8
Flötteröd, Bieker/ Procedia - Social and Behavioral Sciences 00 (2011) 000–000
construction site. Therefore the population in a radius of 500 meters from the bomb site had to be evacuated and the respective streets had to be barred. The corresponding train service was cut off as well. The bomb was found on a Thursday 30th September 2010 at 1:30 p.m. Two high schools in the vicinity were used as shelters. All 9,600 people were evacuated at 8:45 pm. The police had to go check every house to make sure that everybody left their home, afterward they could start to defuse the bomb. At 9:30 p.m. the whole action is finished. Streets were re-opened and the trains could run again. Special events: In this category, traffic demands are more various than those in the other three categories and mainly depend on activity types and sizes as well as the applied traffic management strategies, for example the public transit fee is sometimes included in the ticket price. The used transport modes also strongly depend on the available infrastructure. Since the demonstration areas are in Munich and in Cologne, special events in these two cities are focused and divided into different subcategories according to the event type, event duration and the number of attendants. The traffic demands and the respective departure and arrival patterns of special events are generated according to the historical surveys and loop detector data. One of the major events is the Carnival which is celebrated every year in Cologne. About one million people participate in the “Rose Monday” parade which is about 6 kilometers long. Normally, the attendants drive by car or motor bike to the event (39%), by foot (27%) and by public transport (22%). Only 12 % participants ride bike to visit the parade. For the traffic management the following parameters are important to calculate the expected traffic demand: expected number of participants, area of the event, begin and end time of the event, departure and arrival patterns as well as the modal split. 3.3. Demand generation Based on the normal activities-based demand traffic demand during disasters and incidents can be generally further divided into three demand types, i.e. blocked/evacuated demand, detour demand and impact demand. These demands can be calculated in different degree of detail according to the available information such as the normal traffic demand, the involved area, the time of occurrence of an incident, the duration of the incident, trip chains, trip durations, assigned collection places and proposed management strategies. The normal traffic demand will be firstly assigned to the network according to the UE principle and vehicle routes can then be obtained as a result. Based on the resultant vehicle routes the concept to calculate each type of demand is as following: Blocked/evacuated demand: this type of demand is the number of people whose origin and destination are in the incident area during an incident period. They will be evacuated out of the area and cannot continue their original trips in that area. Their new destinations will be either the assigned collection places or the next destinations in their original trip chains. If an OD matrix is used, the respective new destinations will be the traffic zones next to the blocked demands due to the absent trip chains information. The respective departure pattern is related to the evacuation duration and the incident type. Detour demand: this demand is the number of people whose routes to their destinations are partially in the incident area during an incident period. They can still make their trips, but have to make a detour. Impact demand: it is the number of people whose routes to their destinations are not in the incident area, but in a so-called impact area when an incident occurs. The impact area is the area in which the traffic state is impacted by an occurred incident. Road participants in this category will continue their journeys and some of them may change their routes in order to avoid possible traffic congestion. All these demands are used as input data in the simulation while traffic assignment will be executed for blocked/evacuated demand, detour demand and a part of the impact demand. At this point, traffic assignment is to find the shortest path based on the current link travel times as vehicles enter the network.
Author name / Procedia - Social and Behavioral Sciences 00 (2011) 000–000
4. Conclusions and perspectives The awareness about effective and efficient traffic management during disasters and incidents is significantly stimulated for years. Traffic simulation is also extensively applied for analyzing the impacts of proposed scenarios. In this paper, a VABEBE system with a web-based EmerT portal is introduced. This system aims to support authorities for making decisions during disasters and incidents. Traffic simulation is also adopted in this system not only for scenarios evaluation, but also for providing traffic forecast. Traffic demand is one of the essential input data in the traffic simulation and has a great influence on the simulation performance. An approach to calculate traffic demands during disasters and incidents is proposed in this paper as well. In order to accurately identify such traffic demand, respective historical events have been collected and categorized into four groups, i.e. natural disasters, incidents at critical facilities, man-caused disasters and special events. These events show that lots of factors, such as departure pattern, evacuation rate and people's perception, influence the evacuation progress and should be considered in the simulation as well. However, it is quite difficult to collect such data. For example, it is difficult to identify how many people will follow the indication to the assigned collection places and how many people follow the detour suggestions. For future works, the VABENE system will adopt real time traffic data from other resources, such as data from blue-tooth based devices, to provide accurate traffic information. Furthermore, the proposed approach to automatically identify/generate the traffic demand for a given disaster or incident category will be implemented in the system.
References Baumgartner, S. V., Krieger, G. (2011). Traffic monitoring via satellite. PositionIT, (pp. 57-62). EE Publishers (Pty) Ltd. Behrisch, M., Bieker, L., Erdmann, J., Krajzewicz, D. (2011). SUMO - Simulation of Urban MObility: An Overview. The Third International Conference on Advances in System Simulation. Eissfeldt, N. (2004). Vehicle-based modelling of traffic: Theory and application to environmental impact modelling. PhD thesis, Cologne. http://kups.ub.uni-koeln.de/volltexte/2004/1274/. accessed January 2012. Krauß, S. (1998). Microscopic Modelling of Traffic Flow: Investigation of Collision Free Vehicle Dynamics, Hauptabteilung Mobilität und Systemtechnik des DLR Köln. ISSN 1434-845 RENEWBILITY (2009). Final report of the project RENEWBILITY „Stoffstromanalyse nachhaltige Mobilität im Kontext erneuerbarer Energien bis 2030“: Part 1: Methodik und Datenbasis (pp. 36), ÖkoInstitut e.V. and DLR-Institut für Verkehrsforschung (2009). (in German) SUMO-Simulation of Urban Mobility. http://sumo.sourceforge.net/, 2011. accessed May 2012. VABENE. http://vabene.dlr.de/vabene/Aktuelles.htm (in German). accessed May 2012. ZDF. http://module.zdf.de/kernkraftwerke-in-deutschland/, accessed June 2011. ZKI.http://www.zki.dlr.de/system/files/media/filefield/map/medium/DLR_20101010_Germany_schwarze _Elster_flood_Elsterwerda_medium.jpg. accessed May 2012.
9