Demonstrating Distributed Signal Strength Location Estimation Neal Patwari and Piyush Agrawal
Alfred O. Hero III
Dept. of Electrical & Computer Engineering University of Utah, Salt Lake City, USA
Dept. of Electrical Engr. & Computer Science University of Michigan, Ann Arbor, USA
[email protected] and
[email protected]
[email protected]
Abstract
2
Distributed estimation of sensor location is a key enabling technology for sensor networks. This demonstration will provide an interactive display of distributed, cooperative localization, using wideband received signal-strength measurements, and the distributed weighted multi-dimensional scaling (dwMDS) algorithm.
The localization module uses the distributed weighted multi-dimensional scaling (dwMDS) algorithm [1], which allows sensors to calculate their own location in a distributed process of iterative optimization. It has a guarantee of convergence – each round of the iteration decreases the cost and thus improves the global coordinate estimate. Information and communication are strictly local. Each sensor stores only the coordinate estimate of, and RSS measured from, its nearest neighbors (at most K of them). The calculation step requires O (K) adds and multiplies, and is not a function of the total number of sensors. Finally, the dwMDS algorithm adaptively weights neighbors’ measurements such that the most ‘reliable’ are assigned higher weight. In this manner, it can be robust to large errors. Although the dwMDS is a non-parametric method, it has been shown to achieve close to the Cram´er-Rao lower bound on estimator variance when the RSS measurements are log-normal [1].
Categories and Subject Descriptors C.2.4 [Computer-Communication Networks]: tributed Systems—Distributed applications
Dis-
General Terms Algorithms, Experimentation
1
Introduction
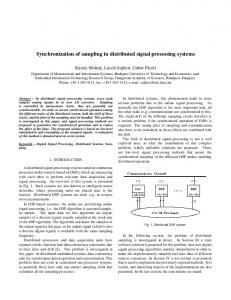
We have developed the dwMDS localization module, a TinyOS module for distributed sensor self-localization using wideband measurements of received signal strength (RSS). This cooperative localization algorithm and implementation is simple and robust and has achieved RMS localization errors of less than 60 cm in deployment tests. An RSS-based localization system has the advantage of simplicity, low energy consumption, compatibility with a variety of devices, and ease-of-implementation. The module is being made publicly available to the TinyOS community. Since the module is fully distributed, no laptop is needed as an information source or sink. Measurements, sharing of measurements, coordinate optimization, and sharing of coordinate estimates, are all done only between a node and its few nearest neighbor nodes. Initial tests have been run on a network of Crossbow Mica2 (Model MPR400CB) wireless sensors. Figure 1 shows a photo and the localization results from one outdoor test, a network of 36 nodes in a 6.67 meter by 6.67 meter square area, which achieved an RMS localization error of 55.3 cm. In this paper, we describe the implementation used in these initial tests and the setup of the demonstration to be conducted at ACM SenSys 2006.
Copyright is held by the author/owner(s). SenSys’06, November 1–3, 2006, Boulder, Colorado, USA. Copyright 2006 ACM 1-59593-343-3/06/0011 ...$5.00
2.1
Implementation
Frequency Averaging
The Mica2 radio operates in the 900-928 MHz band. In the dwMDS module, the center frequency is changed on a timer such that it acts as a frequency-hopping (FH) radio. Signal strength readings are made across 16 frequencies, and averaged together. This averaging is critical in the reduction of ranging variance in the presence of frequency-selective fading.
2.2 Time Averaging Sensors repeatedly cycle through the 16 frequencies, so multiple time-separated measurements are made at each frequency. These RSS measurements are averaged using a simple filter. We use a one-tap IIR filter, yn = 34 yn−1 + 14 xn , where xn is the current RSS measurement at time n, and yn is the filtered output at time n. This choice is arbitrary, and other filters could be used to adjust the tradeoff between tracking latency and estimator variance.
2.3 Reciprocal Averaging The protocol also allows for reciprocal averaging, in which sensor i’s measurement of j’s RSS is averaged with sensor j’s measurement of i’s RSS, for each pair i 6= j. Reciprocal averaging allows reduction in the RSS variance due to varying transmit powers and receiver characteristics.
2.4
Messaging Protocol
In the initial tests (Figure 1), message-passing operated into two separate stages. First, received signal strength mea-
visible output. Further, because we want to show that the sensors themselves are calculating coordinates, rather than a laptop, there will be no laptop for visitors to see. We address this issue by dividing the floor into color-coded areas. If a sensor estimates its coordinate to be on a ”green” area, it will display solely its ”green” LED. If a sensor estimates its coordinate to be on a ”green and yellow” area, it will light both its ”green” and ”yellow” LEDs. For example, the area may be divided as shown in Figure 2.
yellow & green LEDs
green LED U area
red LED
y Coordinate
surement (RSSM) messages are transmitted to allow sensors to receive each neighbor’s RSS. Each RSSM also contains neighborhood information – each sensor broadcasts which sensors it considers to be its neighbors, and what it has recorded for each neighbor’s RSS. This neighborhood information ensures a symmetric neighbor graph and allows for reciprocal averaging, as described in Section 2.3. In the second stage, token-and-coordinate-estimate (TACE) messages are exchanged, in which a sensor reports its current coordinate estimate. After receiving a TACE message, a sensor updates its list of its neighbors’ estimates, recalculates a better estimate of its own coordinate, and sends a new TACE message to another node.
on in
yellow LED
no LEDs
x Coordinate
Figure 2. Floor of demo area is ‘color coded’. Sensors turn on their red, yellow, and green LEDs to match the color at their coordinate estimate.
(a) 18 17
Y Position (m)
16 15 14 13 12 11 10 9 10
12
14
16
18
X Position (m) (b) Figure 1. Outdoor test of the dwMDS implementation (a) photo and (b) results, showing anchor nodes (×), actual locations (•), and estimated coordinates (×).
2.4.1
Demonstration Test
A new message-passing protocol is used in the SenSys 2006 demonstration in which only one stage is used. Nodes repeatedly alternate between sending a RSSM message and a TACE message in this single stage. Previously, movement of a sensor was only reflected in the coordinate estimate after the two rounds completed. Now, node coordinate estimates update within seconds. Since the demonstration is a live tracking experiment, it is critical to show quick coordinate estimate updates.
2.5
User Interface and Area
The demonstration will consist of sensors in a rectangular area, as determined by the limits of the Sensys 2006 demo area. The biggest difficulty for user interaction is that sensors cannot display their coordinates – three LEDs are the only
The demo is interactive. Attendees are encouraged to pick up a sensor and move it to a different location, and to compare its LEDs to the color of the floor on which they are standing. Sometimes, the color will be inaccurate, since location estimates won’t be perfect – but, an attendee who tries several spots will gain an intuitive feel for the accuracies possible with RSS. Furthermore, in a demonstration of the security application, an alarm can be enabled – if a sensor’s coordinate estimate is outside of a perimeter beyond the demo area, it activates its tone emitter.
3
Conclusion
The demonstration of the dwMDS localization module provides attendees the opportunity to gain an intuitive feel for the capabilities of the dwMDS algorithm, and demonstrate that robust distributed self-localization from signal strength measurements can be achieved within a level of accuracy. Further, a public TinyOS module allows others to implement and build upon RSS-based distributed localization as part of future wireless embedded sensor networks.
4
Acknowledgements
This work was partially funded by the DARPA Defense Sciences Office under Office of Naval Research contract #N00014-04-C-0437.
5
References
[1] J. A. Costa, N. Patwari, and A. O. Hero III, “Distributed multidimensional scaling with adaptive weighting for node localization in sensor networks,” IEEE/ACM Transactions on Sensor Networks, vol. 2, no. 1, pp. 39– 64, Feb. 2006.