Density currents in the two-layer flow: an example of Dardanelles outflow. Courants de densité dans un flux à deux couches : l'exemple du courant de sortie des ...
Oceanologica Acta 26 (2003) 243–253 www.elsevier.com/locate/oceact
Original article
Density currents in the two-layer flow: an example of Dardanelles outflow Courants de densité dans un flux à deux couches : l’exemple du courant de sortie des Dardanelles S qükrü T. Bes¸iktepe * Institute of Marine Sciences, Middle East Technical University, P.O. Box 28, Erdemli, Icel 33731, Turkey.
Abstract Observations from hydrographic surveys are used to describe the density current flowing through the Dardanelles strait into the Marmara Sea. Aegean water plunges below the surface and flows into the Marmara Sea. This flow joins into the Marmara Sea as a negatively buoyant plume and sinks through the deeper parts. Seasonal variation in the incoming water density results in the observing mainly two different forms of the density current in this area. These two forms are boundary currents and intrusion. Boundary currents were observed as a dense bottom current during the winter when the inflowing water density attains to annual maxima and as an overflow during the autumn when the inflowing water density drops to annual minimum. Intrusion form of the density current was observed during the summer. © 2003 Éditions scientifiques et médicales Elsevier SAS and Ifremer/CNRS/IRD. All rights reserved. Résumé Des observations de campagnes hydrographiques permettent de décrire le courant de densité traversant le détroit des Dardanelles vers la mer de Marmara. Les eaux égéennes plongent et se répandent dans la mer de Marmara. Ce flux constitue, en mer de Marmara, une « plume » à flottabilité négative qui plonge vers les zones les plus profondes. Une variation saisonnière de la densité de l’eau entrante conduit à deux types de circulation dans cette zone. Ces deux formes sont des courants de bordure et une intrusion. Les courants de bordure constituent un courant de fond dense durant l’hiver, quand la densité de l’eau entrante atteint son maximum annuel, et comme un surcourant en automne, quand la densité de l’eau entrante s’abaisse à sa valeur minimale. Des formes d’intrusion du courant de densité sont observées en été. © 2003 Éditions scientifiques et médicales Elsevier SAS and Ifremer/CNRS/IRD. All rights reserved. Keywords: Density current; Intrusion; Dardanelles; Marmara sea Mots clés : Courant de densité ; Intrusion ; Dardanelles ; Mer de Marmara
1. Introduction Starting from the pioneering study of Benjamin (1968) the flow of the dense bottom current has been studied intensively in the past decade by means of the theoretical and numerical approaches (Griffiths, 1986). Substantial progress has been made in the modelling of density currents in varied oceanic regions. Smith (1975) has developed a stream-tube model of the sinking plume to calculate the evolution of the water and flow properties assuming a stationary, horizontally integrated stream-tube with variable cross-sectional area. Since then, * Corresponding author. E-mail address: sukru@ims_metu_edu.fr (S.T. Bes¸iktepe).
various models have been developed based on this formulation (e.g. Killworth, 1977; Price and Baringer, 1994). The stream-tube modelling approach, which assumes the flow, is under balance of buoyancy, Coriolis and friction forces and has been shown to be successful in several context and results can be verified with observation (Price and Baringer, 1994). Jungclaus and Backaus (1994) simulated the mixing and spreading of the dense bottom current using a hydrostatic, reduced gravity, two-dimensional primitive equation numerical model. The model includes horizontal and bottom friction as well as entrainment from ambient waters. Their model resolves the horizontal structure of the plume and is able to simulate the instabilities arising in the rotating case, which were leading to splitting and merging of dense plumes. This
© 2003 Éditions scientifiques et médicales Elsevier SAS and Ifremer/CNRS/IRD. All rights reserved. DOI: 10.1016/S0399-1784(03)00015-X
244
S.T. Bes¸iktepe / Oceanologica Acta 26 (2003) 243–253
model successfully applied to Bosphorus outflow into the Black Sea (Ozsoy et al., 2001). Chao and Paluszkiewicz (1991) examined the effect of the topography on the hydraulics of density currents using threedimensional primitive equation model. The propagation of the density currents has been found to be dependent upon the height of the intrusion and the total water depth as well as the buoyancy. Away from the boundaries, density current is in balance with the Coriolis force and flow is in geostrophic equilibrium. Existence of the boundaries rejects the Coriolis and friction becomes important. Downstream form of the density current is regulated by the underlying topography (Chao and Paluszkiewicz, 1991). However, due to the difficulties in measurements, the observations to verify the above modelling studies are rare. The purpose of this paper is to present naturally occurring examples for the different forms of the density currents due to the variations in the buoyancy and interpretations of the observations using some of the modelling studies summarised above. Because of the vast amount of data collected in this region and well-defined seasonality of the properties of the Dardanelles outflow, the Dardanelles Marmara junc-
tion (DMJ) allows enhanced examination of the density current through the observations. An attempt will be made to identify the different forms of density currents and the effect of the density variations and boundaries on the flow. This paper is organised in the following manner. The description of the study area and review of the earlier studies related to the present work in the area are given in Section 2. The observational basis of this study consists of the seasonal observations since 1985 described in Section 3. In this section we also discuss the observed forms of the density current. The closing Section, 4, summarises the results.
2. Background Dardanelles strait has a length of nearly 62 km and its width varies from 1.3 to 7 km, the average width being 4 km and is connected to the Marmara Sea through the gradually widening and deepening section on the southwest (Fig. 1). Triangular shaped submarine canyon is located on this gradually deepening area. This canyon has 70 m depth at the Dardanelles exit and is connected to the deep Marmara basin
Fig. 1. Topography of the Dardanelles widening exit region into he Sea of Marmara. Contour intervals in meters; [50:10:150], [200:100:600], [800:200:1200]. Oceanographic stations mentioned in the text are overlaid. Inset shows the location of the Marmara Sea, dots in the inset indicate station positions used in the drawing the transects.
S.T. Bes¸iktepe / Oceanologica Acta 26 (2003) 243–253
within 60 km from Dardanelles exit. An area on the southeast of the Dardanelles exit, between the Marmara islands and Anatolian coast, is slightly elevated (~ 40 m deep) when compared with surrounding areas. Another submarine can yon cuts into this area with an average depth of 65 m and extends towards the east along the south of the Dardanelles exit, following a route between the Marmara Islands. The water mass properties in the Aegean Sea are characterised by a relatively homogenous distribution from surface to bottom as a result of the winter-time convective overturning processes. Salinity in the upper layer waters of the Aegean Sea can reach up to 39.5 during the autumn, due to the evaporation. The annual salinity minimum does not drop below the 39. The annual temperature variations have broad range of 13–25 °C. Corresponding variations in the density is observed in the range of 29–29.5 rT. Due to the excess evaporation, temperature determines the density in the Aegean Sea waters. Aegean waters are always heavier than the upper layer waters of the Marmara Sea and plunge below the surface at the Dardanelles and move along the bottom of the Dardanelles Strait throughout the Marmara Sea. Dardanelles strait is characterised by a two layer system in which mixing between layers is not efficient (Oguz and Sur, 1989). The lower layer displays density differences at the two ends of the strait. The density value of rT = 29.5 at the Aegean side decreases to 28.85–28.95 at the Marmara end. The mean flow of the lower layer is from the Aegean towards the Sea of Marmara. Considering the steady state salt and mass conservations, volume flux of the Dardanelles lower layer flow is estimated 566 km3 per year with an average salinity of 38.67 (Unluata et al., 1990). Typical velocities for this flow are about 30 cm s–1, based on measurements carried out by Mertz (Moller, 1928). Apart from the steady state water budget calculations, seasonal variations in the volume flux are expected by assuming reasonably low influx during the winter and a higher influx during the autumn (Besiktepe et al., 1993). Before it is introduced into the interior, lower layer flow concentrated on the southern side of the Dardanelles and follows a submarine valley between station D-1 and D-1Z with depth exceeding 80 m in the southern part and reaches to an area with almost flat topography around station K30J17 (Ozsoy et al., 1986). Afterwards, Dardanelles outflow reach to the deeper Marmara waters. 3. Results Oceanographic cruises have been carried out in the Marmara Sea on the seasonal basis starting from 1986 by Institute of Marine Sciences of the Middle East Technical University (Besiktepe et al., 1994) using R/V Bilim. As a part of this program, oceanographic stations have been visited in the Dardanelles strait and DMJ region (Fig. 1). Water properties of the lower layer Dardanelles Strait waters at Station D-1 located at the Marmara end of the
245
Fig. 2. Time series of the averaged Mediterranean waters coming into the Marmara Sea at station D-1. (a) Temperature, (b) salinity, (c) sigma-t.
Dardanelles, can be used to characterise the inflowing water. Temporal variations of the 6 years of lower layer averaged temperature, salinity and density are given in Fig. 2. In calculating the layer-averaged values, a critical point is the selection of the separation point between the upper and lower layers. Making use of the uniform properties in each layer, we used the following procedure for calculating the layer averages: SS and SB representing the salinities at the surface and bottom of each profile, respectively, the salinity values SS – 0.2(SB – SS) are selected to be the limits of the lower layer. Then the data below these limits are averaged to yield lower layer average properties. The results of this empirical method are found to agree well with subjective estimates and have been verified for each data set. The details of this calculation can be found in Ozsoy et al. (1986) and Besiktepe et al. (1994). The properties of the incoming flow have well defined variations in time, which can be described by annual cycles of a sinusoidal form. Temporal variations of the variables indicate that the lower layer temperature values are observed at the late-winter and early-spring months. Both salinity and temperature reach to their highest values in AugustSeptember. These synchronised variations lead to opposite contributions to the density by temperature and salinity. Because the density of the Mediterranean water is predomi-
246
S.T. Bes¸iktepe / Oceanologica Acta 26 (2003) 243–253
Fig. 3. The distribution of the bottom density overlaid on the bottom topography at the Dardanelles-Marmara junction for March 1989.
nantly determined by its temperature (a = 2 × 10⁻⁴, b = 8 × 10⁻⁴), the density of the intruding water is always maximum in winter with about 29.2 rT and minimum in summer with about 28.6 rT. In order to specify how the Dardanelles lower current is intruded into the Marmara Sea and penetrates further, we have analysed the T and S sections along the approximate axis of the Dardanelles outflow as inferred from horizontal distributions of the Dardanelles outflow. These T, S sections are extended further into the Marmara Basin to present the complete view of the system. We found that both temperature and salinity fields are good tracers for visualisations of the structures of the current. After examining the all-available data, it is seen that the Dardanelles outflow has well defined seasonal variations in the characteristics over the DMJ. We classified them into two main hydrodynamic forms as boundary currents and intrusion. 3.1. Boundary currents 3.1.1. Dense bottom current In winter, during the month of March, the density of the fluid intruding into the Marmara Sea through the Dardanelles is at its highest value due to its temperature. We will consider the March 1989 data to represent the winter situation. The distribution of the bottom sigma-t around the DMJ during
March 1989 is given in Fig. 3. The density of the bottom water is about 29.3 rT (T = 13.1 °C, S = 38.6) at the Dardanelles exit. After following the submarine valley between station D-1 and D-1Z, topographic slope of the submarine canyon between D-1Z and K42J28 guides the dense bottom current. Inside the canyon, the core of the density current has a density of 29.2 rT. When this current reaches to the end of canyon, the density decreases to 29.0 rT due to increase in temperature (14.35 °C) and decrease in salinity (38.55) as a result of mixing with ambient water mass. Temperature and salinity sections presented in Fig. 4a,b for the upper 100 m along the axis of the plume as determined above. The incoming flow is concentrated close to the bottom both within the Dardanelles strait and the downstream stations. After the shelf break, corresponding to Station K38J22, the orientation of the isotherms suggests continuation of the bottom current along the slope. From a depth of 55 m down to bottom, there exists a homogeneous layer of dense bottom current. It is well known that (Klinck, 1988) currents in the submarine canyons can generate a wide range of oscillations including internal waves. These oscillations result in the increased mixing which leads to downstream decrease in the thickness of the homogenous layer. When this dense bottom current reaches the shelf break at K38J22, the flow shoots out into the interior before sinking downward and then isolines form a blob.
S.T. Bes¸iktepe / Oceanologica Acta 26 (2003) 243–253
Fig. 4. Upper 100 m. (a) Temperature, (b) salinity transects along the main axis of the Turkish straits from the Aegean to Black Sea, March 1989.
247
248
S.T. Bes¸iktepe / Oceanologica Acta 26 (2003) 243–253
Fig. 5. T, S profiles at three selected stations at the Dardanelles-Marmara junction in March 1989.
On the other hand, return current was observed above the dense bottom current. At depths of 30–45 m relatively warmer water of the interior intrudes towards the Dardanelles. This tongue of warm water is clearly identified up to station D-1. This tongue is a return flow intruding into the Dardanelles from the Marmara side immediately above the dense bottom flow. This return current displays patchiness
type of structure and can be explained by meanders in the horizontal circulation. To define the dense bottom current more clearly on the shelf slope, T, S profiles of March 1989 from three subsequent stations along the route of plume are given in Fig. 5. As clearly seen from these figures, the plume properties change as the plume sinks. Starting from the Station C-2S through
Fig. 6. The distribution of salinity maximum at the Dardanelles-Marmara junction for September 1989.
S.T. Bes¸iktepe / Oceanologica Acta 26 (2003) 243–253
Fig. 7. Upper 100 m. (a) Temperature, (b) salinity transects along the main axis of the Turkish straits from the Aegean to Black Sea, September 1989.
249
250
S.T. Bes¸iktepe / Oceanologica Acta 26 (2003) 243–253
Fig. 8. The distribution of temperature maximum at the Dardanelles-Marmara junction for July 1988.
K38J22, a decrease in the salinity and increase in temperature is observed. The dense bottom current can be separated into two parts, at the bottom well mixed homogeneous 20 m layer, beneath 50 m stratified column. This dense bottom current follows a route over the gentle slope from Dardanelles to Marmara. Assuming the flow is uniform by means of the velocity and density and the thickness of the flow is constant, the velocity of the density current (u) at small inclination can be estimated using Chezy equation, u = (g'h sin h/(1 + a) Cf)–1/2 (Komar, 1977). Where, g' = g(Dq/q) is the reduced gravity, h is the thickness of the current, h is the angle of the slope, a is the ratio of the drag on the flow at the upper interface to the drag on the bottom and the Cf is a drag coefficient. The success of this equation in calculating velocities in the coastal areas was shown by Lennon et al. (1987). From the bathymetric map given inFig. 1, bottom slope of the DMJ is of the order of 10–3. Combined bottom and interfacial drag coefficient ((1 + a) Cf) is 0.0035 (Oguz and Sur, 1989). At the Dardanelles exit to the Marmara Sea (Station C2-S), thickness of the dense bottom water is 20 m and the density is 1.0295. The ambient water density is 1.0285 and then g' = 0.0077. Using these values, the speed of the flow is found as 0.21 m s–1 using Chezy equation given above.
3.1.2. Overflow In autumn, during the month of September the density of the fluid intruding into the interior is at its lowest value due to its high temperature and this water mass can be observed as temperature and salinity maximums in the DMJ. The horizontal distribution of the salinity maximum in the DMJ for September 1989 is given in Fig. 6 to visualise the lateral pathway of this hot- salty autumn outflow from Dardanelles. The Dardanelles outflow is clearly identified all over the DMJ with varied efficiency between salinities of 38.8 and 39.0. Recently intruded Dardanelles water is found at the Dardanelles exit with 39.0 salinities. The distribution of the maximum salinities was showing northeast orientation. This indicates that the inflow was following the way along the axis of the Dardanelles strait. When the inflow reaching to shelf break, values of the salinity maximums were dropping down to 38.7. Utilising the horizontal distribution the outflow, the temperature and salinity sections have been constructed along the main axis of the Marmara Sea for the September 1989 (Fig. 7a,b ). As shown in T and S sections, Dardanelles inflow was forming a hot-salty tongue between 28 and 35 m around the DMJ. This tongue is constrained by the halocline and consequently strong interaction is expected. Due the entrainment of the less salty and warmer upper layer waters the inflow becomes lighter than the sub-halocline waters of the
S.T. Bes¸iktepe / Oceanologica Acta 26 (2003) 243–253
Fig. 9. Upper 100 m. (a) Temperature, (b) salinity transects along the main axis of the Turkish straits from the Aegean to Black Sea, July 1988.
251
252
S.T. Bes¸iktepe / Oceanologica Acta 26 (2003) 243–253
enters the widening section of the DMJ and the bottom layer is filled by the return current from the Marmara. This return current arises as low temperature and salinity layer near the bottom of DMJ. 3.2. Intrusion During July 1988, temperature of the Dardanelles lower layer current was around 16 °C, which was slightly less than the 17 °C temperature of September. This makes the inflow slightly denser than the autumn inflow and is not trapped by the halocline as observed in autumn. On the other hand, it is not the dense bottom current as observed during the winter. The horizontal distribution of the temperature maximum at the DMJ is given in Fig. 8 for July 1988. The inflowing water is characterised by T ~ 16–17 °C. The core of the inflow was attaining temperature and salinity maximums at the DMJ. The outflow covers essentially the region on the east of the Dardanelles exit suggesting right hand deflection. Further downstream, outflowing waters were observed in the area between islands. The intrusion of the Dardanelles outflow in the July 1988 into the Marmara Sea is also displayed by T and S cross sections along the main axis of the Marmara Sea (Fig. 9). After the outflow enters the DMJ region, existence of the thermohaline fronts suggests lateral mixing of two water masses. Downward decrease in the salinity was occurring together. It is seen that the warmer and saltier Dardanelles waters interact with the Marmara Sea waters through the layering, which is expressed in the water column by the fine structure. 4. Conclusion
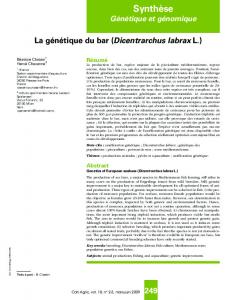
Fig. 10. Schematic representations of the observed forms of the density currents in the Dardanelles-Marmara junction.
Marmara Sea; it was exhibiting itself as a surface current bounded by the halocline from top. Dardanelles lower layer flow exits from the strait with 15.4 °C temperature and 38.92 salinity (Station D-1) onto the widening section (refer to Fig. 1 for map). Its temperature increases up to 15.8 °C and its salinity almost unchanged inside the submarine canyon (Stations D1-X, D1-Y, D1-Z). After end of the submarine canyon (Station D1-Z), the bottom layer (50–70 m at the opening of the Dardanelles to the Marmara) rises rapidly by its buoyancy and spreads when it
The flow of the density current into the Marmara Sea through the Dardanelles strait have been studied by means of the hydrographic observations carried out on the seasonal basis. Particular emphasis has been given to identifying the different forms of the density current due to the seasonality in the density of the Dardanelles lower layer waters. Observed forms of the density currents are schematised in Fig. 10. During the winter, the inflow is heavier than the interior, it plunges to the bottom of the DMJ and forms a bottom boundary current and the balance is between the buoyancyand friction (Fig. 10, upper panel). The flowing of the dense bottom current into the basin is in the form of dense turbulent plume and also not affected by Coriolis force. Because, topographic routing of the plume by ridges on the slope, which could apply a pressure on the side of the plume that could partially cancel the Coriolis force (Killworth, 1977). When the inflow is lighter during the autumn, the inflow exhibits itself as a surface current bounded by upper layer of the Marmara Sea (Fig. 10, lower panel). The introduction of the boundary from the top could reject the Coriolis effect and then density current is established with a balance between
S.T. Bes¸iktepe / Oceanologica Acta 26 (2003) 243–253
cross-stream pressure gradient and buoyancy. The downslope increase in the water depth results in the shoaling of the downstream depth of the inflow. When the Dardanelles outflow density is between the above two cases as observed during the summer months, inflow takes place in the form of lateral intrusion. In this case, inflowing waters spread out over the DMJ region and interact with the interior through the layering. Outflow is away from the boundaries, and then the balance is between the buoyancy and the Coriolis force. So the outflow tends to turn right (east) upon exiting the DMJ. The results of the modelling studies was useful in interpreting the observations presented here and in return, observations presented in this work may help in the development of the models for the density current.
Acknowledgements This work was supported by Turkish Scientific and Technical Research Council (Tubitak). Cooperative efforts of the scientists, technicians and graduate students of the IMSMETU and the captains and crew of the R/V Bilim to collect long-term data in the Marmara Sea are gratefully acknowledged.
References Benjamin, T.B., 1968. Gravity currents and related phenomena. J. Fluid Mech. 31, 209–248. Besiktepe, S., Ozsoy, E., Unluata, U., 1993. Filling of the Sea of Marmara by the Dardanelles inflow. Deep-Sea Res. 40, 1815–1838. Besiktepe, S., Sur, H.I., Ozsoy, E., Latif, M.A., Oguz, T., Unluata, U., 1994. Circulation and hydrography of the Sea of Marmara. Prog. Oceanogr. 34, 285–334.
253
Chao, S., Paluszkiewicz, T., 1991. The hydraulics of density currents over estuarine sills. J. Geophys. Res. 96, 7065–7076. Griffiths, R.W., 1986. Gravity currents in rotating systems. Annu. Rev. Fluid Mech. 18, 59–89. Jungclaus, J.H., Backaus, J.O., 1994. Application of a transient reduced gravity plume model to the Denmark Strait overflow. J. Geophys. Res. 99, 12375–12396. Killworth, P.D., 1977. Mixing on the Weddel Sea Continental slope. DeepSea Res. 24, 427–448. Komar, P., 1977. Computer simulation of turbidity current flow and the study of deep sea channels and fan sedimentation. In: Goldberg, E.D., McCave, I.N., O’Brien, J.J., Steele, J.H. (Eds.), The Sea, 6. WileyInterscience, New York. Klinck, J.M., 1988. The influence of a narrow transverse canyon on initially geostrophic flow. J. Geophys. Res. 91, 509–515. Lennon, G.W., Bowers, D.G., Nunes, R.A., Scott, R.D., Ali, M., Wenju, C., Herzfeld, M., Johansson, G., Nield, S., Petrusevics, P., Stephenson, P., Suskin, A.A., Wijffels, S.E.A., 1987. Gravity currents and the release of salt from an estuary. Nature 327, 695–697. Moller, 1928. Alfred Merz hydrographische untersuchungen in Bosphorus and Dardanellen. Veroff. Inst. Meeresk., Berlin Univ., eue Folge A vol. 18, 284. Oguz, T., Sur, H.I., 1989. A two-layer model of water exchange through the Dardanelles Strait. Oceanol. Acta 12, 23–31. Ozsoy, E., Oguz, T., Latif, M.A., Unluata, U., 1986. Oceanography of the Turkish Straits. First Annual Report, Institute of Marine Sciences, Middle East Technical University, 1, p. 269. Ozsoy, E., Di Iorio, D., Gregg, M.C., Backhaus, J.O., 2001. Mixing in the Bosphorus Strait and the Black Sea continental shelf: observations and a model of the dense water outflow. J. Mar. Syst. 31, 99–135. Price, J.F., Baringer, M.O., 1994. Outflows and deep water production by marginal seas. Prog. Oceanogr. 33, 161–200. Smith, P.C., 1975. A stream tube model for bottom boundary currents in the ocean. Deep-Sea Res. 22, 853–873. Unluata, U., Oguz, T., Latif, M.A., Ozsoy, E., 1990. On the physical oceanography of the Turkish Straits. In: Pratt, J. (Ed.), The Physical Oceanography of Sea Straits. NATO-ASI series, Kluwer Academic Publishers, The Netherlands, pp. 5–60.