polymers Article
Density Functional Theory of Polymer Structure and Conformations Zhaoyang Wei 1,2 , Nanying Ning 1,2 , Liqun Zhang 1,2 , Ming Tian 1,2, * and Jianguo Mi 1, * 1
2
*
State Key Laboratory of Organic-Inorganic Composites, Beijing University of Chemical Technology, Beijing 100029, China;
[email protected] (Z.W.);
[email protected] (N.N.);
[email protected] (L.Z.) Key Laboratory of Beijing City on Preparation and Processing of Novel Polymer Materials, Beijing University of Chemical Technology, Beijing 100029, China Correspondence:
[email protected] (M.T.);
[email protected] (J.M.); Tel.: +86-10-6443-4860 (M.T. & J.M.); Fax: +86-10-6443-3964 (M.T. & J.M.)
Academic Editor: Xianqiao Wang Received: 8 March 2016; Accepted: 30 March 2016; Published: 15 April 2016
Abstract: We present a density functional approach to quantitatively evaluate the microscopic conformations of polymer chains with consideration of the effects of chain stiffness, polymer concentration, and short chain molecules. For polystyrene (PS), poly(ethylene oxide) (PEO), and poly(methyl methacrylate) (PMMA) melts with low-polymerization degree, as chain length increases, they display different stretching ratios and show non-universal scaling exponents due to their different chain stiffnesses. In good solvent, increase of PS concentration induces the decline of gyration radius. For PS blends containing short (m1 “ 1 ´ 100) and long (m “ 100) chains, the expansion of long chains becomes unobvious once m1 is larger than 40, which is also different to the scaling properties of ideal chain blends. Keywords: density functional theory; scaling exponent; radius of gyration
1. Introduction The description of macromolecular conformations in various environments is an outstanding problem in polymer physics [1–8]. The scaling properties may be altered in different media and polymer ratios. Theoretical concepts of polymer physics have frequently been used to establish the connection between polymer microstructure and dimension [9–11]. On the other hand, the advances in experimental techniques, such as neutron scattering methods, allow a direct measurement of the intramolecular and intermolecular structure, thus providing, in principle, the possibility of testing these theories [11–14]. The stretching of polymers has been treated exhaustively by a number of Flory-type mean field theories based on general principles that relate the dimensions and the length of a chain to its free-energy [15–18]. These theories provide reasonable scaling exponent that correlate the gyration radius (R g ) of polymer chain to its length (N) via R g 9N v . A prerequisite for application of these theories is that R g at θ-state are known, which serves as an essential reference state. Although the scaling exponent at θ-state has been determined as ν “ 1{2, the pre-coefficient of the relational expression is still unavailable. Moreover, since the free-energy expression is independent of microscopic inter- and intramolecular structures, the quantitative application of these theories and their comparison to experimental results in different conditions are still far from satisfactory. Polymer reference interaction site model (PRISM) integral equation provides a framework for describing the microscopic structures of uniform polymeric fluids [19,20]. The intermolecular correlation functions are calculated for a given set of intramolecular correlation functions after the
Polymers 2016, 8, 121; doi:10.3390/polym8040121
www.mdpi.com/journal/polymers
Polymers 2016, 8, 121
2 of 14
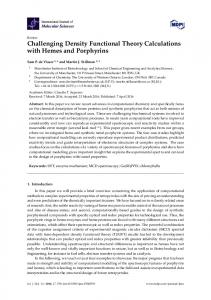
equation is formulated and coupled with a closure relation. It has been successfully applied to describe the intermolecular structure of a broad range of polymeric systems [21–23]. Since the intramolecular correlation function is typically unknown, the equation suffers from a serious self-consistency problem. Although this problem can be partially solved by involving a semiflexible chain model or inserting a single-chain molecular simulation to integrate the intra- and intermolecular correlation functions, this strategy is restricted to improve the accuracy of intermolecular correlation function, whereas the intramolecular correlation function cannot be derived from the equation. Besides, the integral equation approach suffers inconsistency among different routes for thermodynamic properties. As such, the structure description provided by the PRISM is generally qualitative. In order to present a quantitative evaluation to the intramolecular correlation function, an explicit free-energy analysis of the system is undoubtedly necessary. Classical density functional theory (DFT) provides another route to represent both structural and thermodynamic properties of polymeric fluids [24–26]. The theory for fluids is based on the minimization of grand free-energy functional, and gives prediction for the equilibrium free-energy and microscopic structure of the components. In particular, the theory yields self-contained structural and thermodynamic properties and employs no molecular simulations as input. In recent years, an accurate density functional approach has been developed for polymer systems by combining the modified interfacial statistical association fluid theory [27–30]. The excess Helmholtz free-energy due to polymerization is related to the association equilibrium through the multibody cavity correlation functions. In order to characterize the intramolecular correlation function, a test-particle method has been integrated into a relatively simple DFT to calculate the local inhomogeneous density profile of the polymeric fluid in the external field of one segment fixed at the origin [31,32]. Such DFT is based on the first order thermodynamic perturbation theory for polyatomic molecules. It avoids molecular simulations as input and shows the advantages of self-consistency among inter- and intramolecular correlation functions, and is very accurate in comparison with simulation data for freely jointed hard-sphere chains. The drawback of the theory lies in its ideal chain model. In fact, different polymers in experiments have different degrees of stiffness to their backbones. There is considerable interest in developing a theory capable of accurately predicting the microscopic conformation of complicated polymer fluids to decipher the stretching properties. In this paper, we present a density functional approach by combing the PRISM equation, the test-particle method, and the modified interfacial statistical association fluid theory [32] to deal with actual polymer conformations, particularly the intramolecular correlation functions. The radii of gyration of polystyrene (PS), poly(ethylene oxide) (PEO), and poly(methyl methacrylate) (PMMA) are calculated to analyze their expansion or contraction under different conditions. We utilize coarse-graining chain for modeling the conformational behavior of the polymers with chain stiffness, reflecting the dependence of bending energy on the angle between two nearby bond or tangent vectors. Since all parameters are taken from the general force field [33–35], all results given by the theory are strict predictions. The rest of the paper is organized as follows: Section 2 presents the whole molecular model and the DFT calculation method. Section 3 shows the calculation results of gyration radius and structure factor. The expansion effects are evaluated for polymer melts, concentration, and blends containing long and short chains. Section 4 summarizes the final conclusion. 2. Model and Approach To simplify the complicated polymer conformation, we use a coarse-grained model to describe polymer chains. Each polymer chain is represented by a series of bonded segments and obeys the semiflexible chain conformation. The segment diameter is given by repeating unit. Suppose that one segment from an arbitrarily selected chain is fixed at the origin. The system considered is equivalent to a mixture of four polymeric components pF, S, C andDq in a symmetric external field due to the fixed segment, as depicted in Figure 1.
Polymers 2016, 8, 121
3 of 14
Polymers 2016, 8, 121
3 of 14
Figure 1. Schematic of the polymer model used in this work. Here, a middle segment from a polymer
Figure 1. Schematic of the polymer model used in this work. Here, a middle segment from a polymer chain (filled black sphere) is fixed at the origin. The density distributions of segments from the chain (filled black sphere) is fixed at the origin. The density distributions of segments from the tethered fragments ( C and D ), free ( F ), and short ( S ) chain molecules are related to the intratethered fragments (C and D), free (F), and short (S) chain molecules are related to the intra- and and intermolecular segment–segment correlation functions. In a homogeneous polymer melt, the intermolecular segment–segment correlation functions. In a homogeneous polymer melt, the short short chain no longer exists. chain no longer exists.
The free molecules are represented by F , composed of
mF segments; the chemically identical
The free molecules by, composed F, composed m F segments; the chemically identical of mof short chain moleculesare are represented represent by S S segments; while the tethered fragments short chain molecules are represent by S, composed of mS segments; while the tethered fragments are are represented by C and D , composed of mC and mD segments, respectively. At equilibrium, represented by C and D, composed of mC and m D segments, respectively. At equilibrium, the density the density distributions of free chains, short chains, and the tethered fragments satisfy the variational distributions of free chains, short chains, and the tethered fragments satisfy the variational relations relations
δΩδΩ
δΩ δΩ δΩ “ = pSqδΩ “= pCδqΩ “= pδDΩ “00 = (S ) (C ) ( D )q δρδρ δρ δρ prq prq prq ( r ) δρ ( r ) δρ ( r ) i i i i ii
(1)
p Fq ( F ) δρiδρprq i (r )
(1)
(l )
Ω for stands for the grand free-energy, ρi (r ) ( l = F , S , C , and D ) is the density of the wherewhere Ω stands the grand free-energy, ρi prq (l “ F, S, C, and D) is the density of the ith segment ith l segment on chain position r . Forpolymer a homogeneous polymer melt, theof contribution of the is on chain at position r. Forl aathomogeneous melt, the contribution the S component S component is automatically deleted. automatically deleted. F ) short and short ( S ) chains around the fixed segment The segment distributions of free the free The segment distributions of the (F) (and (S) chains around the fixed segment are are related , where is the related to the intermolecular site–site correlation function g ( r ) = ρ ( r ) / ρ ρ ( r ) ,j j to the intermolecular site–site correlation function gij prq “ ρi,jijprq{ρb , iwhere ρbi,j prq is thei ,density profile of segments i on molecule F or S around the fixed segment j, and ρ is the bulk density of segment. segment j , and ρb is the density profile of segments i on molecule F or S around the fixed b Whereas the distribution of segments from the fragments C and D are related to the C intramolecular and D are bulk density of segment. Whereas the distribution of segments from the fragments prq correlation function ω prq “ ρ prq, where ρ is the density profile of segment i on tethered ij i,j correlation function i,j thethe density related to the intramolecular ωij (r ) = ρi , j (r ) , where ρi , j ( r ) is chain (C or D) around the fixed segment j. There is only one tethered polymer chain, therefore the profile of segment i onş the tethered chain ( C or D ) around the fixed segment j . There is only normalization condition is ωi,j prqdr “ 1. As a consequence, the site–site intra- and intermolecular one tethered polymer therefore the normalization is ωfluid. r= 1 . As a the i , j ( r )d correlation functions specifychain, all detail microscopic structures condition of a polymeric In particular, consequence, site–site intraand intermolecular correlation allcorrelation detail gyration radius is athe version of the intramolecular correlation function.functions From thespecify site–site mF mF microscopic structures of a polymeric fluid. In particular, the gyration radius is a version 1 ř ofřthe functions, we can calculate the average intermolecular correlation function with g prq “ m2 gij prq, pl q
intramolecular correlation function. From the site–site correlation functions, we can calculate F i“1 j“the 1
1 mF
average intermolecular correlation function withwith g (ω r ) prq = “2 and the average intramolecular correlation function
mF m m řFF
mF
ř , and g (ωr )ij prq.
1 mF
ij i =1 i“ j =11 j“1
the average
The system considered above is equivalent 1to mFa mmixture of four polymeric components F function with ω (due r ) =to the fixedωsegment. ij ( r ) . pF ` Sintramolecular ` C ` Dq in acorrelation symmetric external field The grand potential is related mF i =1 j =1 to the Helmholtz free-energy A rρ prqs through the Legendre transform
The system considered above is equivalent to a mixture of four polymeric components
(
)
ml ş ”F + S + C + D in a symmetric ı ” external field due to the fixed ı segment. The potential ř ř pFq pSq pCq pDq pFq pSq pCq pDq plq grand plq i,l Ω ρi prq , ρi prq , ρi prq , ρi prq “ A ρi prq , ρi prq , ρi prq , ρi prq ´ dr1 pµi ´ Vext pr1 qqρi pr1 q
related to the Helmholtz free-energy A ρ ( r ) through the Legendre transform l“F,S,C,D i“1
pl q
is
(2)
i,l where µi is the chemical potential of that segment i, Vext is the external field acting on that segment i. The first summation is over all chains l in the mixture pF, S, C, Dq, and the second summation is over all segments of chain l. For any segment that is not immediately bonded with the fixed segment, the external potential is identical to the Lennard–Jones (LJ) interaction potential. While for two segments
Polymers 2016, 8, 121
4 of 14
that are directly connected to the fixed segment, the external potential includes the bonding potential ˇ ˇ vbond , given by expr´βvbond pri , r j qs “ δpˇri ´ r j ˇ ´ σq{4πσ2 ; here segments i and j are nearest neighbors from the same molecule, and δ is the Dirac-delta function. The bond length (L), bond angle (θ), and nonbonded parameters (σ and ε) for PS, PEO, and PMMA are summarized in Table 1. Table 1. Bond and nonbond coarse-grained force field parameters. Species a
PS PEO b PMMA c a
σ (Å)
ε(k)
θ(deg)
L (Å)
5.08 4.30 6.50
62.5 405.8 150.9
140 130 122
2.46 3.30 2.80
Reported in Reference [33]; b Reported in Reference [34]; c Reported in Reference [35].
The total Helmholtz free-energy functional can be decomposed into ideal and excess contributions [27]. ” ” ı ı The ideal contribution is generally represented by ş ř pl q pl q id A “ dr ρi prq ln ρi prq ´ 1 . The excess contribution consists of hard-sphere repulsion, long-range attraction, chain stiffness, and chain connectivity over the ideal gas state of the atomic mixture. The free-energy due to hard-sphere repulsion is given by the fundamental measure theory [24] ” ı ż pl q A ρi prq “ drΦhs rnγ prqs hs
(3)
where Φhs rnγ prqs is the free-energy density, which stems from the modified fundamental theory [36], including both the scalar and vector contributions Φhs rn
„ γ prqs “ ´n0 ln p1 ´ n3 q `
n1 n2 ´nV1 ¨nV2 1´n3
ˆ `
1 36π
n3 ln p1 ´ n3 q `
n23 p1´n3 q2
˙
n32 ´3n2 nV2 ¨nV2 n33
(4)
where nγ prq with γ “ 0, 1, 2, 3, V1 , V2 are the weighted densities. The details have been given elsewhere [36]. The long-range attractive contribution to the free-energy functional can be simplified as A
att
ż ” ı 1ÿ ÿ ż ˇ1 ˇ pl q pl q pl q 1 2ˇ ˇ ρi prq “ dr dr2 ρi pr1 qρ j pr2 quatt ij p r ´ r q 2 i
(5)
j
where uatt ij prq is the interaction potential between any two species i and j, and can be represented by a cut-and-shifted LJ potential with a Weeks–Chandler–Anderson separation [37,38]. The functional Astiff is constructed to account for the contribution of conformational entropy given by the polymer stiffness, which is implemented to improve the accuracy for description of real polymer chains ż ż ” ı ˇ ˇ1 1ÿ ÿ pl q pl q pl q 2ˇ ˇ Astiff ρi prq “ ´ dr1 dr2 ρi pr1 qρ j pr2 qcstiff ij p r ´ r q 2 i
(6)
j
with the approximation cstiff prq “ csemiflexible prq ´ cflexible prq. Here csemiflexible prq and cflexible prq denote the direct correlation functions of semiflexible and flexible polymer chains. They are calculated from the PRISM integral equation [39] ż hprq “
Ñ1
dr
ż
Ñ2
Ñ
Ñ1
Ñ1
Ñ2
d r ωp| r ´ r |qcp| r ´ r |qrωpr2 q ` ρhpr2 qs
(7)
Polymers 2016, 8, 121
5 of 14
where hprq is the total correlation function and ωprq is the intramolecular correlation function. ωprq is cursorily represented by the Koyama model [40] for flexible or semiflexible chains. To solve the equation, we adopt the Kovalenko–Hirata approximation [41]. To compute the free-energy contribution due to chain connectivity, we use the Tripathi–Chapman functional [27], in which the chains are treated as a sequence of m bonded monomers, enforced by giving each segment a label and allowing segments to exclusively bond to their specific matching segments. It is indicated as A
chain
ml ” ı ż ÿ ÿ pl q pl q ρi prq “ dr1 ρi pr1 qˆ
˜ i,l 1 lnXA pr q ´
APΓpiq
i “1
i,l 1 XA pr q 1 ` 2 2
¸ (8)
in which the first summation is over all the segments i, and the second is over all the association sites i,l on segment i as Γpiq , representing the set of all associating sites on segment i. XA is the fraction of segment i that are not bonded at their association site A. i.l XA prq “
1`
r
1
(9)
j,l pl q pl q dr1 XB pr1 q∆ij pr, r1 qρ j pr1 q
where j denotes the neighboring segment that will bond to segment i, and ˘ ˘ pl q ` ˘ pl q ` pl q ` ∆ij r, r1 “ KFij r, r1 yij r, r1 . Here K is a geometric constant that accounts for the volume ´ ˘ ` ˘¯ ij pl q ` available for bonding between segments, and Fij r, r1 “ exp βε0 ´ βvbond r, r1 ´ 1 represents ˘ pl q ` the association Mayer f -function. yij r, r1 is the cavity correlation function. The details have been given elsewhere [27]. The functional derivatives of the free-energies are required to obtain the equilibrium density pl q
profiles, which are given as BΩ{Bρi prq “ 0. As a result, the Euler–Lagrange Equation is written as plq
lnρi prq `
ř APΓpiq
i,l lnXA prq ´
1 2
ř
mq tγ1u ř ř r
q“F,S,C,D γ“1
γ1
pqq
ργ pr1 q
δlnyγγ1 pr1 q dr1 plq δρ prq i
`
δβAhs plq δρ prq i
`
δβAatt plq δρ prq i
`
δβAstiff plq δρ prq i
plq
“ βpµi
i,l ´ Vext prqq
(10)
( where γ1 is the set of all segments bonded to segment γ. This equation can be rewritten to give the density profile ” ı ` ˘ pl q pl q pl q pl q i,l ρi prq “ exp βµ Ml exp Di prq ´ βVext prq I1,i prqI2,i prq (11) with pl q
Di prq “
1 2
mq tγ1u ż ÿ ÿ δlnyγγ’ pr1 q 1 δβAhs δβAatt δβAstiff pqq ργ pr1 q dr ´ ´ ´ pl q pl q pl q pl q δρi prq δρi prq δρi prq δρi prq q“ F,S,C,D γ“1 γ’
ÿ
(12)
pl q
In Equation (11), µ Ml is the bulk chemical potential of chain l. The multiple integrals I1,i prq and pl q
I2,i prq for the free and short chains pl “ F, Sq are solved in a recursive fashion and are given by $ & I pl q prq “ 1 1,1 ” ı ´ 1 ¯ r pl q r Θpσ´|r1 ´r|q i´1,l 1 % I pl q prq “ I pl q pr1 qexp Dpl q pr1 q ´ βVext pr q ∆i´1,i pr1 , rq dr1 r 1,i 1,i´1 i´1
(13)
$ ” ı ´ ¯ & I pl q prq “ r I pl q pr1 qexp Dpl q pr1 q ´ βV i`1,l pr1 q ∆pl q pr, r1 q r1 Θpσ´|r1 ´r|q dr1 ext r 2,i 2,i`1 i`1 i,i`1 % I pl q prq “ 1
(14)
2,m F
Polymers 2016, 8, 121
6 of 14
pl q
where Θprq is the Heaviside step function. When applied to the tethered chains pl “ C, Dq, I1,i prq and pl q
I2,i prq can be expressed as $ pl q ’ I pσq “ 1 ” ’ ı ´ ¯ & 1,1 pl q pl q pl q σΘpσ´|σ´r|q 1,l I1,2 prq “ exp D1 pσq ´ βVext pσq ∆1,2 pσ, rq r ¯ ” ı ´ ’ ’ % I pl q prq “ ş I pl q pr1 qexp Dpl q pr1 q ´ βV i´1,l pr1 q ∆pl q pr1 , rq r1 Θpσ´|r1 ´r|q dr1
(15)
” ¯ ı ´ 1 $ pl q ş pl q pl q pl q r Θpσ´|r1 ´σ|q 2,l 1 ’ I2,1 pσq “ I2,2 pr1 qexp D2 pr1 q ´ βVext dr1 pr q ∆1,2 pσ, r1 q ’ & ¯ ” ı ´ σ1 ş 1 pl q pl q pl q pl q r Θpσ´|r ´r|q i`1,l 1 dr1 I2,i prq “ I2,i`1 pr1 qexp Di`1 pr1 q ´ βVext pr q ∆i,i`1 pr, r1 q r ’ ’ % pl q I2,m prq “ 1
(16)
1,i
ext
i ´1
1,i´1
i´1,i
r
l
The chemical potentials of the tethered fragments C and D can be determined using the r r pC q p Dq normalization conditions 4πr2 ρi prqdr “ 1 and 4πr2 ρi prqdr “ 1, where i “ 1, 2, 3, ...ml , for l “ C or D. For the first tethered segment (segment “1” of l “ C or D), ż
! ” ı ) ` ˘ pl q pl q pl q 1,l 4πr2 exp βµ Ml exp D1 prq ´ βVext prq I1,1 prqI2,1 prq dr “ 1 pl q
pl q
(17)
pl q
which yields exppβµ Ml q “ 1{rexppD1 pσqqI1,1 pσqI2,1 pσqs. Using other segments yields equivalent results for µ Ml . Substituting this into Equation (11), we obtain pC q
ρ1
p Dq
prq “ ρ1
prq “
δ pr ´ σq 4πσ2
(18)
which matches the known condition for the tethered segment. Solving for the other segments pi “ 2, 3, ...ml q gives pl q
ρi prq “
”
pl q
1 ı
pl q
pl q
exp D1 pσq I1,1 pσqI2,1 pσq
” ı pl q pl q pl q i,l exp Di prq ´ βVext prq I1,i prqI2,i prq
(19)
In calculating inter- and intramolecular correlation functions, we fix the segments of a polymer chain one by one and the density distributions around the fixed segment are calculated with Equations (11)–(19). Because of symmetry, m F {2 (if m F is even) or pm F ` 1q{2 (if m F is odd) calculations are required for predicting the detailed local structures of polymer chains consisting of m F identical segments. The density profiles are solved using the Picard-type iterative method. In the theoretical calculations, the computation domain is divided into equally-spaced grid points along the dimension normal to the surface. The grid spacing of 0.02σ is used in our calculation. At every iteration step, a new estimate to the density profiles is calculated with Equation (11), and then is mixed with the old one. The result acts as the new guess for the next iteration. This procedure is iterated until numerical self-consistency is achieved, in the sense that the difference of density profile between the preceding step and the present step is less than 5.0 ˆ 10´ 4 . All the convolution results of the equations are directly evaluated in the real space. In order to save computational time, we focus on those low-polymerized systems, where the monomer number is not more than 120. Unless noted otherwise, all calculations are performed at a total packing fraction of 0.40, which corresponds to a typical dense melt value with a realistic dimensionless isothermal compressibility. 3. Results and Discussion Figure 2 presents the inter- and intramolecular correlation functions for the PS chain given by the DFT, along with the simulation results that are attainable from the literature [42]. It is shown that the overall shape of theoretical curves and the positions of the main peaks can match the simulation results,
typical dense melt value with a realistic dimensionless isothermal compressibility. 3. Results and Discussion Figure 2 presents the inter- and intramolecular correlation functions for the PS chain given by Polymers 2016, 8, 121 7 of 14 the DFT, along with the simulation results that are attainable from the literature [42]. It is shown that the overall shape of theoretical curves and the positions of the main peaks can match the simulation results, indicating thetheoretical current theoretical model is to quantitatively the indicating that the that current model is suitable to suitable quantitatively evaluate theevaluate microscopic microscopic polymer The deviations are probably due to the approximation of the structure of structure polymer of melts. Themelts. deviations are probably due to the approximation of the model, model, in which the tacticity or torsional effects overlooked. shownininFigure Figure2a, 2a, on short in which the tacticity or torsional angleangle effects are are overlooked. AsAs shown short length length scales, scales, the the local local structure structure of of the the PS PS chain chain is is seen seen to to have have “liquid-like” “liquid-like” tendency, tendency, displaying displaying shells shells of of first-nearest first-nearest neighbors. neighbors. Over Over longer longer distances, distances, the the curves curves exhibit exhibit aa spatially spatially slowly slowly varying varying “correlation hole”, corresponding corresponding to the relative absence of neighboring neighboring sites sites due due to intramolecular intramolecular screening. screening. Figure Figure 2b 2b presents presents the the corresponding corresponding “nonbonded” “nonbonded” intramolecular intramolecularcorrelation correlationfunctions. functions. The discontinuity at r r“=77ÅÅ is is due to to thethe direct interaction between next nearest neighbors along the The due direct interaction between next nearest neighbors along polymer chain. the polymer chain.
Figure Figure 2. 2. Comparison Comparison of of the the average average (a) (a) interinter- and and (b) (b) intramolecular intramolecular correlation correlation functions functions of of the the PS PS chain obtained from theory and molecular simulations [42] at 413.2 K. chain obtained from theory and molecular simulations [42] at 413.2 K.
As the essential criterion to evaluate polymer structure and dimension, the gyration radius Rg As the essential criterion to evaluate polymer structure and dimension, the gyration radius R g can function [40,43] [40,43] can be be calculated calculated from from the the intramolecular intramolecular correlation correlation function d ż 2π 8 4 Rg “ r ω prq dr (20) m 0 to quantitatively analyze polymer conformation. Figure 3a shows R g for PS chains at T “ 500 K as function of chain length in comparison with the available experimental data [44]. It is clear that both the PRISM equation and the Flory theory cannot provide reasonable intramolecular structure description. In contrast, a good agreement has been achieved between DFT calculations and experimental values in the whole range of chain length. In particular, the scaling exponents derived from the Flory theory and the DFT are fitted in Figure 3b. The values are 0.50 and 0.63, respectively. It shows clearly that, at a low degree of polymerization, the exponent from DFT is obviously higher than the universal value (0.50). In other words, actual polymers at a low degree of polymerization display non-universal scaling behavior and have a relatively larger scaling exponent, which can be attributed to their rigid characteristics. Moreover, as the chain becomes stiffer, the excluded volume increases, leading to increasing R g . A similar result was also derived from molecular simulations [45,46].
It shows clearly that, at a low degree of polymerization, the exponent from DFT is obviously higher than the universal value (0.50). In other words, actual polymers at a low degree of polymerization display non-universal scaling behavior and have a relatively larger scaling exponent, which can be attributed to their rigid characteristics. Moreover, as the chain becomes stiffer, the excluded volume increases, leading to increasing Rg . A similar result was also derived from molecular simulations
Polymers 2016, 8, 121
8 of 14
[45,46].
Figure 3. 3. (a) of Figure (a) Gyration Gyration radius radius as as aa function function of of chain chain length length for for PS PS chains chains at at 500 500 K; K; (b) (b) Determination Determination of the scaling exponents. The circles are calculated results and the solid line is the best linear regression the scaling exponents. The circles are calculated results and the solid line is the best linear regression of of the circles. the circles.
Another consequence of the gradual ramp-up of polymer stiffness manifests itself through the Another consequence of the gradual ramp-up of polymer stiffness manifests itself through the form factor, which is particularly useful for studying the scaling behavior. Generally, the form factor form factor, which is particularly useful for studying the scaling behavior. Generally, the form factor is is derived from light scattering experiments. In the theoretical model, it can be directly calculated derived from light scattering experiments. In the theoretical model, it can be directly calculated from from the Fourier transform of the intramolecular correlation function [47] the Fourier transform of the intramolecular correlation function [47]
1 m m mm sin( qrij ) 1 mm m m 1 ÿ ÿ ÿ ω ij ( q ) 1= = ω( q ) sinpqr q 1 2ÿ ij 2 1 Ppqq “ m 2i =1 j =1 qrij “ m2 i =1 j =ω1 ij pqq “ ωpqq m
P (q ) =
m
i “1 j “1
qrij
m
i “1 j “1
m
(21) (21)
where rij is the distance between segments i and j , and q denotes the magnitude of the where rij is the distance between segments i and j, and q denotes the magnitude of the scattering wave scattering wave vector q . The expression for the form factor of a free chain is the well-known Debye vector q. The expression for the form factor of a free chain is the well-known Debye equation equation 2 1 ` q2 R2g q (22) Ppqq “ 2 2 pexpp´q2 R22g q ´ 2 P ( q ) = pq2 R22g q2 (exp( − q R g2 ) − 1 + q 2 R g2 ) (22)
(q Rg )
Figure 4a shows the form factors for PS melt with molecular weight 1 ˆ 1044 in θ solvent. It seems Figure 4a shows the form factors for PS melt with molecular weight 1 × 10 in θ solvent. It seems that a good agreement can be achieved between DFT calculations and the experimental values [48], that a good agreement can be achieved between DFT calculations and the experimental values [48], whereas the Debye expression is not always valid in the fractal regime (q ě 1.0). This can be seen whereas the Debye expression is not always valid in the fractal regime ( q ≥ 1.0 ). This can be seen by by the gradual transition from a slope of ´2 for the Debye equation to a slope of ´1 for PS chains. the gradual transition from a slope of −2 for the Debye equation a slope of −1 for PS Figure Figure 4b shows the form factor of several different lengths of PS to melt. In particular, wechains. are interested in the so-called fractal regime. This regime provides information related to the chain statistics inside the coil, which can reveal details about stiffness and self-avoiding behavior. In the regime, the results given by two equations are closer as the polymerization degree increases. One can expect that on a scale which is large enough, they will again appear as flexible coils.
4b shows the form factor of several different lengths of PS melt. In particular, we are interested in the so-called fractal regime. This regime provides information related to the chain statistics inside the coil, which can reveal details about stiffness and self-avoiding behavior. In the regime, the results given two equations are closer as the polymerization degree increases. One can expect that9 on Polymersby 2016, 8, 121 of 14a scale which is large enough, they will again appear as flexible coils.
Figure 4. (a) Comparison between experimental data of the form factors and calculated ones for PS Figure 4. (a) Comparison between experimental data of the form factors and calculated ones for PS 4 melt molecular weight weight 11 ˆ × 10 melt with with the the molecular 104in inθθsolvent; solvent;(b) (b)Form Formfactor factor for for different different lengths lengths of of PS PS melt melt at at 500 K. Solid lines correspond to DFT calculations in Equation (21). Symbols show the curve obtained 500 K. Solid lines correspond to DFT calculations in Equation (21). Symbols show the curve obtained from expression. from the the Debye Debye expression.
A standard way to examine the structure of a polymeric chain at all distances is through the A standard way to examine the structure of a polymeric chain at all distances is through the static static structure factor S ( q ) , which is defined as structure factor S pqq, which is defined as
S ( qS)pqq =ω h (pqq q )“ =ω ω pqq g (´q 1s ) +`ρρh ( q )`+ρ ρrgpqq ) − 1 “ (ωqpqq
(23) (23)
and polymerization are presented in in Figure Figure 5. 5. As and the the results results for for PS PS chains chains at at different different degrees degrees of of polymerization are presented As can can be seen, the general shape of the plots could be divided into three distinct regions. In the small be seen, the general shape of the plots could be divided into three distinct regions. In the small wave wave
vector q≤ is very sensitive thedegree degreeofofpolymerization, polymerization,both both in in magnitude magnitude ( qis) very vector regime regime ((q ď 0.2 0.2),), SSpqq sensitive toto the and functional functional form. form. Increase Increaseofofpolymerization polymerizationdegree degreeleads leadstotoenhanced enhanced SS pqq. and The qualitative qualitative ( q ) . The behavior of S pqq at small wave vectors is controlled by a competition between the intramolecular behavior of and S ( qthe small wave vectors is controlled by a competition between theisintramolecular ) atintermolecular fluctuation correlation. As the wave vector increases, there a plateau-like regime (0.2 and ď qthe ď 0.4) for S pqq (self-similar of thevector chains). This regime increases as the fluctuation intermolecular correlation.structure As the wave increases, there is a plateau-like degree of polymerization increases. The plateau regime of high wave vectors is compound in nature, regime ( 0.2 ≤ q ≤ 0.4 ) for S ( q ) (self-similar structure of the chains). This regime increases as the reflecting both the fixed bond length constraint and local intermolecular structure in the melt. In degree of polymerization increases. The plateau regime of high wave vectors is compound in nature, the high wave vector regime (q ě 0.4), all the different PS melts have the same structure, i.e., the reflecting both the fixed bond length constraint and local intermolecular structure in the melt. In the pqq. 8, 121 same S2016, Polymers 10 of 14 high wave vector regime ( q ≥ 0.4 ), all the different PS melts have the same structure, i.e., the same
S (q) .
Figure Figure5.5.Structure Structurefactor factorof ofPS PSchain chainwith withthree threevalues values of of polymerization polymerization degree degree at at 500 500 K. K.
Figure 6 shows the predicted gyration radii of PEO and PMMA chains in comparison respectively with the simulation [34] and experimental ones [49]. In Figure 6a, the theoretical predictions are generally in good agreement with the reported values. The results indicate that the current model is quantitatively reliable for describing the scaling properties in a broad range of polymeric systems. The scaling exponents for the two polymers with low polymerization are fitted
Polymers 2016, 8, 121
10 of 14
Figure 5. Structure factor of PS chain with three values of polymerization degree at 500 K.
Figure 66shows predicted gyration radii of PEOofand PMMA in comparison respectively Figure showsthethe predicted gyration radii PEO and chains PMMA chains in comparison with the simulation and experimental [49]. In Figure 6a, the theoretical are respectively with the[34] simulation [34] and ones experimental ones [49]. In Figure 6a, predictions the theoretical predictions generally in good with the reported values. The that results that the generally inare good agreement withagreement the reported values. The results indicate the indicate current model is current modelreliable is quantitatively reliable for describing in a broad rangeThe of quantitatively for describing the scaling propertiesthe in scaling a broad properties range of polymeric systems. polymeric systems.for The exponents forlow the polymerization two polymers with low polymerization arevalues fitted scaling exponents thescaling two polymers with are fitted in Figure 6b. The in 6b. The and than 0.56, the which are smaller than the exponentPSfor low-polymerized areFigure 0.59 and 0.56,values whichare are0.59 smaller exponent for low-polymerized chains. The scaling PS chains. The exponents give an indication of stretching ratios. Amongmelts, thesePS three polymer exponents givescaling an indication of stretching ratios. Among these three polymer displays the melts, PS displays the ratio, maximum stretching ratio, PEO hasIn the minimum one.stretching In this regard, maximum stretching whereas PEO has thewhereas minimum one. this regard, the ratio the stretching increases with enhancing chain stiffness. increases withratio enhancing chain stiffness.
Figure 6. (a) Gyration radius as a function of chain length for PEO and PMMA melts at 300 K; (b) Figure 6. (a) Gyration radius as a function of chain length for PEO and PMMA melts at 300 K; Determination of the scaling exponents for the two polymers. The squares and circles are calculated (b) Determination of the scaling exponents for the two polymers. The squares and circles are calculated results results and and the the solid solid line line is is the the best best linear linear regression. regression.
Figure 7 gives the gyration radii of PS chains with various packing fractions ( η ). Calculations Figure 7 gives the gyration radii of PS chains with various packing fractions (η). Calculations are are carried the range to The 0.40.highest The highest packing mimics neatcondition, melt condition, carried out out for ηforin η theinrange of 0.04ofto0.04 0.40. packing mimics neat melt while while the lowest is more representative of a dilute solution. At low concentrations, the chains are the lowest is more representative of a dilute solution. At low concentrations, the chains are extended extended but not rodlike. As the concentration increases, the size of PS chains decreases because of but not rodlike. As the concentration increases, the size of PS chains decreases because of the greater the greaterofscreening of the intramolecular interactions. Another result is that the change in screening the intramolecular interactions. Another major result ismajor that the change in averaged chain averaged chain dimension is on the order of ~10% due to an incomplete cancellation of the long-range dimension is on the order of ~10% due to an incomplete cancellation of the long-range intra-chain intra-chain excluded and condensed-phase-induced interactions. These modest nonideal excluded volume and volume condensed-phase-induced interactions. These modest nonideal effects are of the effects are of the same qualitative size as discovered in diblock and triblock copolymer melts [50,51]. samePolymers qualitative size as discovered in diblock and triblock copolymer melts [50,51]. 2016, 8, 121 11 of 14
Figure 7. Gyration radius of PS chain as a function of packing fraction at 500 K. The chain length is
Figure 7. Gyration radius of PS chain as a function of packing fraction at 500 K. The chain length is fixed at m = 100 . fixed at m “ 100.
Finally, we consider the statistical properties of relatively long chains (polymerization degree m = 100 ) immersed in a monodisperse melt of shorter, chemically identical chains (polymerization degree
m1 = 1 ~ 100 ). Such systems can act as a fundamental test of the standard model for polymer
conformation. Figure 8 describes the gyration radius of a long chain as a function of chain length of a short-chain molecule. If
m is much larger than m1 , one sees that the short chain molecules acts
Figure 7. Gyration radius of PS chain as a function of packing fraction at 500 K. The chain length is fixed at
m = 100 .
Polymers 2016, 8, 121
11 of 14
Finally, we consider the statistical properties of relatively long chains (polymerization degree m = 100 ) immersed in a monodisperse melt of shorter, chemically identical chains (polymerization Finally, thesystems statistical of relatively long chains (polymerization degree m1 =we 1 ~consider 100 ). Such canproperties act as a fundamental test of the standard model for polymer degree m “ 100) immersed in a monodisperse melt of shorter, chemically identical chains (polymerization conformation. Figure 8 describes the gyration radius of a long chain as a function of chain length of degree m1 “ 1 „ 100). Such systems can act as a fundamental test of the standard model for polymer a short-chain molecule. If m is much larger than m , one sees that the short chain molecules acts conformation. Figure 8 describes the gyration radius1 of a long chain as a function of chain length as a short-chain good solventmolecule. and the long arelarger swollen, to the volume effect. As m1 of a If m chains is much thanowing m1 , one seesexcluded that the short chain molecules acts as a good solventextent and the longchains chainsdecreases, are swollen, owing to the excluded volume As increases, the swelling of long since the excluded volume effects areeffect. screened m1 the increases, the swelling extent of long decreases, the becomes excludedinsignificant volume effects are by surrounding polymer chains. The chains expansion of longsince chains as the screened number by the surrounding polymer chains.than Theaexpansion of long insignificant as = 40 ).becomes In the early theoretical segment of shorter chains is larger certain value ( m1chains the segment number of shorter chains is larger than a certain value (m1 “ 40). In the early theoretical investigations [9,15], it was predicted that polymer chains (with segment number m ) can be investigations [9,15], it was predicted that polymer chains (with segment number 1/2 m) can be expanded of m1 < m . However, these expanded in its homologue (with segment number m1 ) in the range 1 { 2 in its homologue (with segment number m1 ) in the range of m1 ă m . However, these investigations investigations based on model. an idealActual chainspolymer model. chains Actualhave polymer havevolume. larger excluded are based on anare ideal chains largerchains excluded From the m1 stretching has been volume. From themodel, presentwetheoretical model, we can findofthat thebeen length range for of the present theoretical can find that the length range m1 has enlarged of PS chain comparedoftoPS the idealwhen chaincompared blends. to the ideal chain blends. enlarged forwhen the stretching chain
m“ = 100 Figure asaafunction function of of chain chain length length of of short short chain chain PS Figure 8. 8. Gyration Gyration radius radiusof oflong longchain chainPS PS((m 100))as PS 100) at K.K. m11 “= 11´− 100 ((m ) at500 500 4. Conclusions We present a density functional approach to study the microscopic conformation of polymer chains. The form factors, structure factors, and gyration radii have been calculated based on the cited force field parameters of the coarse-grained model. Firstly, the effects of chain length to the scaling properties of PS, PMMA, and PEO melts have been compared to clarify the contribution of chain stiffness to the stretching ratios. The scaling exponents are 0.63, 0.59, and 0.56, respectively. The results reveal that polymer chains display non-universal behaviors due to their different stiffnesses. On the other hand, the effects of concentration on the stretching of PS chains have been calculated to evaluate the influence of medium. As the packing fraction of PS chain increases, the gyration radius of low polymerized PS declines. Finally, the swelling of PS chains blended with shorter PS chains has been analyzed, and an enlarged expansion regime has been observed, which is different from the ideal chain blends. Acknowledgments: We would like to express our sincere thanks to the National Natural Science Foundation of China (Grant No. 51525301) for financial support. This work was also supported by the National Natural Science Foundation of China (Nos. 21476007 and 51221002), the Doctoral Science Research Foundation of the Education Ministry of China under Grant (No. 20130010110005), and by Chemcloudcomputing of Beijing University of Chemical Technology.
Polymers 2016, 8, 121
12 of 14
Author Contributions: Ming Tian and Jianguo Mi proposed the concept of the paper and developed the model. Zhaoyang Wei and Nanying Ning performed the theoretical computations. Liqun Zhang derived the constitutive model. Zhaoyang Wei and Jianguo Mi analyzed the results and wrote the paper. Conflicts of Interest: The authors declare no conflict of interest.
References 1.
2. 3. 4.
5.
6.
7. 8.
9. 10. 11.
12.
13.
14.
15. 16. 17. 18. 19.
Hara, Y.; Mayama, H.; Yamaguchi, Y.; Takenaka, Y.; Fukuda, R. Direct observation of periodic swelling and collapse of polymer chain induced by the Belousov–Zhabotinsky reaction. J. Phys. Chem. B 2013, 117, 14351–14357. [CrossRef] [PubMed] Doi, M.; Edwards, S.F. The Theory of Polymer Dynamics; Oxford University Press: Oxford, UK, 1988. Doi, M. Introduction to Polymer Physics; Oxford University Press: Oxford, UK, 1996. Chen, Q.; Kooij, E.S.; Sui, X.; Padberg, C.J.; Hempenius, M.A.; Schön, P.M.; Vancso, G.J. Collapse from the top: Brushes of poly(N-isopropylacrylamide) in co-nonsolvent mixtures. Soft Matter 2014, 10, 3134–3142. [CrossRef] [PubMed] Willott, J.D.; Humphreys, B.A.; Murdoch, T.J.; Edmondson, S.; Webber, G.B.; Wanless, E.J. Hydrophobic effects within the dynamic pH-response of polybasic tertiary amine methacrylate brushes. Phys. Chem. Chem. Phys. 2015, 17, 3880–3890. [CrossRef] [PubMed] Sui, X.; Chen, Q.; Hempenius, M.A.; Vancso, G.J. Probing the collapse dynamics of poly(N-isopropylacrylamide) brushes by AFM: Effects of co-nonsolvency and grafting densities. Small 2011, 7, 1440–1447. [CrossRef] [PubMed] Polotsky, A.A.; Plamper, F.A.; Borisov, O.V. Collapse-to-swelling transitions in pH-and thermoresponsive microgels in aqueous dispersions: The thermodynamic theory. Macromolecules 2013, 46, 8702–8709. [CrossRef] Noriega, R.; Rivnay, J.; Vandewal, K.; Koch, F.P.; Stingelin, N.; Smith, P.; Toney, M.F.; Salleo, A. A general relationship between disorder, aggregation and charge transport in conjugated polymers. Nat. Mater. 2013, 12, 1038–1044. [CrossRef] [PubMed] Lang, M.; Rubinstein, M.; Sommer, J.-U. Conformations of a long polymer in a melt of shorter chains: Generalizations of the flory theorem. ACS Macro Lett. 2015, 4, 177–181. [CrossRef] [PubMed] Heyda, J.; Muzdalo, A.; Dzubiella, J. Rationalizing polymer swelling and collapse under attractive cosolvent conditions. Macromolecules 2013, 46, 1231–1238. [CrossRef] Crawford, M.; Smalley, R.; Cohen, G.; Hogan, B.; Wood, B.; Kumar, S.; Melnichenko, Y.B.; He, L.; Guise, W.; Hammouda, B. Chain conformation in polymer nanocomposites with uniformly dispersed nanoparticles. Phys. Rev. Lett. 2013, 110, 196001. [CrossRef] [PubMed] McEwan, M.E.; Egorov, S.A.; Ilavsky, J.; Green, D.L.; Yang, Y. Mechanical reinforcement of polymer nanocomposites: Theory and ultra-small angle X-ray scattering (USAXS) studies. Soft Matter 2011, 7, 2725–2733. [CrossRef] Abbott, L.J.; McDermott, A.G.; Del Regno, A.; Taylor, R.G.; Bezzu, C.G.; Msayib, K.J.; McKeown, N.B.; Siperstein, F.R.; Runt, J.; Colina, C.M. Characterizing the structure of organic molecules of intrinsic microporosity by molecular simulations and X-ray scattering. J. Phys. Chem. B 2012, 117, 355–364. [CrossRef] [PubMed] Jouault, N.; Dalmas, F.; Said, S.; Di Cola, E.; Schweins, R.; Jestin, J.; Boué, F. Direct measurement of polymer chain conformation in well-controlled model nanocomposites by combining SANS and SAXS. Macromolecules 2010, 43, 9881–9891. [CrossRef] Flory, P.J. The configuration of real polymer chains. J. Chem. Phys. 1949, 17, 303–310. [CrossRef] Lifshitz, I.; Grosberg, A.Y.; Khokhlov, A. Some problems of the statistical physics of polymer chains with volume interaction. Rev. Mod. Phys. 1978, 50, 683–713. [CrossRef] Paturej, J.; Milchev, A.; Egorov, S.A.; Binder, K. Star polymers confined in a nanoslit: A simulation test of scaling and self-consistent field theories. Soft Matter 2013, 9, 10522–10531. [CrossRef] Grosberg, A.Y. Annealed lattice animal model and Flory theory for the melt of non-concatenated rings: Towards the physics of crumpling. Soft Matter 2014, 10, 560–565. [CrossRef] [PubMed] Curro, J.G.; Schweizer, K.S. Theory of polymer melts: An integral equation approach. Macromolecules 1987, 20, 1928–1934. [CrossRef]
Polymers 2016, 8, 121
20. 21. 22. 23. 24. 25. 26. 27.
28. 29. 30. 31. 32. 33.
34.
35. 36. 37. 38. 39. 40. 41.
42. 43.
13 of 14
Honnell, K.G.; McCoy, J.D.; Curro, J.G.; Schweizer, K.S.; Narten, A.H.; Habenschuss, A. Local structure of polyethylene melts. J. Chem. Phys. 1991, 94, 4659–4662. [CrossRef] Schweizer, K.S.; Curro, J.G. Integral equation theories of the structure, thermodynamics, and phase transitions of polymer fluids. Adv. Chem. Phys. 1997, 98, 1–142. Pütz, M.; Curro, J.G.; Grest, G.S. Self-consistent integral equation theory for polyolefins: Comparison to molecular dynamics simulations and X-ray scattering. J. Chem. Phys. 2001, 114, 2847–2860. [CrossRef] Frischknecht, A.L.; McGarrity, E.S.; Mackay, M.E. Expanded chain dimensions in polymer melts with nanoparticle fillers. J. Chem. Phys. 2010, 132, 204901. [CrossRef] [PubMed] Tripathi, S.; Chapman, W.G. Microstructure and thermodynamics of inhomogeneous polymer blends and solutions. Phys. Rev. Lett. 2005, 94, 087801. [CrossRef] [PubMed] Wu, J. Density functional theory for chemical engineering: From capillarity to soft materials. AIChE J. 2006, 52, 1169–1193. [CrossRef] Wu, J.; Li, Z. Density-functional theory for complex fluids. Annu. Rev. Phys. Chem. 2007, 58, 85–112. [CrossRef] [PubMed] Jain, S.; Dominik, A.; Chapman, W.G. Modified interfacial statistical associating fluid theory: A perturbation density functional theory for inhomogeneous complex fluids. J. Chem. Phys. 2007, 127, 244904. [CrossRef] [PubMed] Jain, S.; Jog, P.; Weinhold, J.; Srivastava, R.; Chapman, W.G. Modified interfacial statistical associating fluid theory: Application to tethered polymer chains. J. Chem. Phys. 2008, 128, 154910. [CrossRef] [PubMed] Bymaster, A.; Chapman, W.G. An i SAFT density functional theory for associating polyatomic molecules. J. Phys. Chem. B 2010, 114, 12298–12307. [CrossRef] [PubMed] Emborsky, C.P.; Feng, Z.; Cox, K.R.; Chapman, W.G. Recent advances in classical density functional theory for associating and polyatomic molecules. Fluid Phase Equilibr. 2011, 306, 15–30. [CrossRef] Yu, Y.-X.; Wu, J. Extended test-particle method for predicting the inter- and intramolecular correlation functions of polymeric fluids. J. Chem. Phys. 2003, 118, 3835–3842. [CrossRef] Bymaster, A. Molecular Modeling the Microstructure and Phase Behavior of Bulk and Inhomogeneous Complex Fluids. Ph.D. Thesis, Rice University, Houston, TX, USA, 2009. Milano, G.; Müller-Plathe, F. Mapping atomistic simulations to mesoscopic models: A systematic coarse-graining procedure for vinyl polymer chains. J. Phys. Chem. B 2005, 109, 18609–18619. [CrossRef] [PubMed] Lee, H.; de Vries, A.H.; Marrink, S.-J.; Pastor, R.W. A coarse-grained model for polyethylene oxide and polyethylene glycol: Conformation and hydrodynamics. J. Phys. Chem. B 2009, 113, 13186–13194. [CrossRef] [PubMed] Xia, W.; Mishra, S.; Keten, S. Substrate vs. free surface: Competing effects on the glass transition of polymer thin films. Polymer 2013, 54, 5942–5951. [CrossRef] Yu, Y.-X.; Wu, J. Structures of hard-sphere fluids from a modified fundamental-measure theory. J. Chem. Phys. 2002, 117, 10156–10164. [CrossRef] Chandler, D.; Weeks, J.D. Equilibrium structure of simple liquids. Phys. Rev. Lett. 1970, 25, 149–152. [CrossRef] Weeks, J.D.; Chandler, D.; Andersen, H.C. Role of repulsive forces in determining the equilibrium structure of simple liquids. J. Chem. Phys. 1971, 54, 5237–5247. [CrossRef] Schweizer, K.S.; Curro, J.G. Integral-equation theory of the structure of polymer melts. Phys. Rev. Lett. 1987, 58, 246–249. [CrossRef] [PubMed] Honnell, K.G.; Curro, J.G.; Schweizer, K.S. Local structure of semiflexible polymer melts. Macromolecules 1990, 23, 3496–3505. [CrossRef] Kovalenko, A.; Hirata, F. Self-consistent description of a metal–water interface by the Kohn–Sham density functional theory and the three-dimensional reference interaction site model. J. Chem. Phys. 1999, 110, 10095–10112. [CrossRef] Zhao, L.; Li, Y.-G.; Mi, J.; Zhong, C. Integral equation theory for atactic polystyrene melt with a coarse-grained model. J. Chem. Phys. 2005, 123, 124905. [CrossRef] [PubMed] Yethiraj, A.; Hall, C.K. Monte Carlo simulations and integral equation theory for microscopic correlations in polymeric fluids. J. Chem. Phys. 1992, 96, 797–807. [CrossRef]
Polymers 2016, 8, 121
44. 45. 46. 47. 48. 49. 50. 51.
14 of 14
Ding, Y.; Kisliuk, A.; Sokolov, A. When does a molecule become a polymer? Macromolecules 2004, 37, 161–166. [CrossRef] Cifra, P.; Bleha, T. Free energy of deformation of the radius of gyration in semiflexible chains. Macromol. Theory Simul. 2007, 16, 501–512. [CrossRef] Cifra, P.; Benková, Z.; Bleha, T. Persistence lengths and structure factors of wormlike polymers under confinement. J. Phys. Chem. B 2008, 112, 1367–1375. [CrossRef] [PubMed] Tree, D.R.; Muralidhar, A.; Doyle, P.S.; Dorfman, K.D. Is DNA a good model polymer? Macromolecules 2013, 46, 8369–8382. [CrossRef] [PubMed] Koyama, H.; Yoshizaki, T.; Einaga, Y.; Hayashi, H.; Yamakawa, H. Scattering function of oligo- and polystyrenes in dilute solutions. Macromolecules 1991, 24, 932–937. [CrossRef] Tamai, Y.; Konishi, T.; Einaga, Y.; Fujii, M.; Yamakawa, H. Mean-square radius of gyration of oligo- and poly(methyl methacrylate)s in dilute solutions. Macromolecules 1990, 23, 4067–4075. [CrossRef] Almdal, K.; Rosedale, J.H.; Bates, F.S.; Wignall, G.D.; Fredrickson, G.H. Gaussian-to stretched-coil transition in block copolymer melts. Phys. Rev. Lett. 1990, 65, 1112. [CrossRef] [PubMed] Fried, H.; Binder, K. The microphase separation transition in symmetric diblock copolymer melts: A Monte Carlo study. J. Chem. Phys. 1991, 94, 8349–8366. [CrossRef] © 2016 by the authors; licensee MDPI, Basel, Switzerland. This article is an open access article distributed under the terms and conditions of the Creative Commons by Attribution (CC-BY) license (http://creativecommons.org/licenses/by/4.0/).