AbstractâThis paper describes a framework on how to test High ..... âChaos Monkeyâ, e. g. a Python script which attacks the components .... a common API.
Dependability Modeling Framework: A test procedure for High Availability in Cloud Operating Systems Konstantin Benz, Researcher, Z¨urich University of Applied Science, and Thomas Bohnert, Associate Professor, Z¨urich University of Applied Science
Abstract—This paper describes a framework on how to test High Availability capabilities of cloud architectures, particularly OpenStack. The “Dependability Modeling Framework” which consists of a modelling of the system parts, user interactions and dependencies between them will form the basis for this test. The test procedure consists of simulating random shutdown of system components, polling the availability of user interactions and measuring the impact of outages and expected downtime. Outage impacts and downtime are used to rate the underlying system architecture. The test procedure is applied on a single node OpenStack installation in order to show validity of the test concept. Keywords—High Availability, availability, dependability, Dependability Modeling Framework, OpenStack, cloud, test.
I.
I NTRODUCTION
S mobile end users and cloud service consumers we all know that we want our IT services to be available every time and everywhere - 24 hours per day, 7 days per week, 365 days per year [1]. End users normally don’t understand that this requirement is a challenge for system architects, developers and engineers who offer the IT services. Cloud services and their dependencies must be regularly maintained to remain stable and secure. It is noted thought that maintenance changes may require administrator to shut down certain components although at the same time the service should remain available for the end user. Achieving High Availability in a cloud environment is therefore a challenging task - mostly due to high expectations of end users. The Mobile Cloud Networking (MCN) [2] project is developing a cloud service management framework which is supposed to be run by telecommunication providers. With MCN, telecommunication providers are able to offer cloud services to manage mobile communication services that they on their turn offer to of end users. OpenStack is a key technology within the project and while be used to offer Compute, Storage and Networking capabilities. Since OpenStack is used to provide mobile communication services to end users (who have high expectations on availability), it is desirable to provide High Availability in OpenStack in order to make MCN more attractive to mobile end users as well as telecommunication providers. OpenStack is massively scalable [3] and has a large community of supporters, but High Availability in OpenStack does not come out of the box. If the Mobile Cloud Networking project wants to achieve high acceptance levels by its stakeholders, we need a cloud solution which is both massively scalable and reliable. [4] The problem is that there are no tests for deciding if a cloud middleware architecture is capable to allow High Availability or not. Even if there are cloud simulators
A
like e. g. CloudSim [5] (which simulates Amazon EC2, Microsoft Azure or Aneka clouds), there is simply no availability measurement procedure which is practicable for open source cloud environments. Therefore we developed a general framework on how to test High Availability in e. g. OpenStack.
II. H IGH AVAILABILITY A. Definition of “High Availability” Before we can try to derive a framework on evaluation of High Availability criteria, we must first define what we mean by the term “Availability”. According to the ITIL V3 Glossary “Availability” is the “Ability of a Configuration Item or IT Service to perform its agreed Function when required.” [6] In OpenStack (or a cloud service in general) this means, that the cloud service should be usable by the cloud users whenever they need it. Availability is usually measured [8] as: Availability =
(Service T ime − Downtime) ∗ 100 Service T ime
(1)
When we speak of “High Availability”, we usually mean that the “Carrier Grade Standard”: [7] the measured availability is above 99.999 %.
B. What influences Availability? The main reason for a system to become unavailable are component failures. The root cause can be bad configuration files, programming errors or bugs. A component failure is more likely to occur in complex than in simple systems. [9] Therefore complexity generally decreases availability. In order to overcome outages and component failures, one can implement redundant components and failover mechanisms. Redundancy is supposed to increase availability. [11] But there is a caveat to that: Basically availability can be increased by adding redundant components. On the other hand, every new component makes the overall system more complex and therefore increases the risk of component failures. [11] In short: availability levels depend on a trade off between adding redundant system components and introducing additional complexity (and possible points of failure) to the overall architecture. For the OpenStack environment this means one has to define the level of redundancy of different OpenStack components and test if the complexity of the introduced High Availability technologies do not decrease availability of the cloud service.
978-1-4673-6187-3/13/$31.00 ©2013 IEEE
C. High Availability in OpenStack OpenStack consists of many different services. The main service for managing hypervisors and running VM instances is called “Nova”. The “Glance” service is responsible for management of Virtual Machine images and the “Cinder” service is responsible for the management of virtual hard disks (called volumes). Other important components are the “Swift” object storage service and the “Quantum” network service. Identity Management and authentication is performed by the “Keystone” service. OpenStack offers a web dashboard which is implemented by the “Horizon” service. The dashboard also depends on a web server like e. g. the Apache web server. All OpenStack services need a database management system like e. g. MySQL to operate correctly. Communication between components is managed by an AMQP based messaging service. All the OpenStack services must be tested for their capability to deliver highly available cloud services.
D. How can we test High Availability capabilities? In order to find out if an architecture is able to deliver availability levels above 99,999%, we must build an implementation of the tested system (following the architecture plans) and then simulate random outages under realistic conditions. The approach is to implement an OpenStack installation, let some components experience failures and then check if the service becomes unavailable. [1] The simulation alone does not tell anything about the expected availability level a system architecture is able to deliver. If we want to know which architecture is the most suitable to be deployed as a High Availability system, we must rate the different architectures and make them comparable to each other. We chose to rate system architectures according to the expected downtime and the severity of outages during the simulation run. This rating was chosen, because we want to reflect outage costs. Outage costs depend on downtime as well as the importance of the unavailable service to the user. [10]
III. D EPENDABILITY M ODELING F RAMEWORK A. Setup of the simulation If we want to know how to rate a system like OpenStack in terms of availability, we must first know what we want to measure and how we should measure it. We already explained that we want to rate system architectures according to downtime and impact of outages. While downtime is something which can be observed directly in a simulation, the impact of outages must first be operationalized (turned into an ordinal variable) to be measured. A good way to achieve this operationalization is the “Dependability Modeling Framework”. [12] In this framework, an outage impact is rated according to its impact for the end user. The framework is about creating a list of use cases (which are the agreed functions end users expect from an IT service) and linking the use cases to system functions, services and components. An outage of a component can then be seen as an event that makes all use cases it is linked to unavailable. The impact of an outage could be modeled as the sum of use cases which become unavailable after an outage. Of course one could also give some use cases more weight than other use cases depending on their importance for the end user. The test framework is created in three steps: 1) Create a model of common use cases for a cloud operating system and their links to system components (whereby the
2)
3)
links represent dependencies between user tasks and system parts). then test cloud software (according to some architectural plan) and simulate outages of the components that are mentioned in the model. finally measure the impact of an outage by executing the list of use cases from the model. Thereby we say that the impact is the sum of (weighted) use cases which became unavailable and the downtime is equal to a (previously defined) average recovery time.
B. Construction of the Model The idea of this paper is to construct a “Dependability Model” of a cloud middleware in order to create a general test framework for cloud architectures. The “Dependability Model” is a model of use cases that are linked to system components they depend on. The model is constructed following the “Dependability Modeling Framework” approach. The “Dependability Modeling Framework” is a hierarchical modeling framework for dependability evaluation of system architectures. [12] Its purpose is to model different alternative architectural solutions for one IT system and then calculate the dependability characteristics of each different IT system realization. The calculated dependability values can help IT architects to rate system architectures before they are implemented and to choose the “best” approach from different possible alternatives. Design decisions which are based on the “Dependability Modeling Framework” have the potential to be more reflective and less biased than purely intuitive design decisions, since no particular architectural design is preferred to others. The fit of a particular solution is tested versus previously defined criteria before any decision is taken. Dependability models have four levels: 1) the user level, 2) the function level, 3) the service level and 4) the resource level. In contrast to other models which emphasize the aspect of complex dependencies between system components, dependability models delineate outages as events which are perceivable by end users. [13] Dependability models are constructed by identifying user cases or user interactions and then finding system functions, services and components which provide them. Once all system parts are found, the provision of use cases is modelled as links which show the dependability of user interactions on system components. The dependability model levels reflect this method. All user interactions, system functions, services and resources (components) are identified first. Afterwards the models are built by linking all of the four levels to each other. With dependability models it is possible to assess the impact of component failures on the quality of the service delivered to end users. Dependability models are made visible either in a dependency table or in a dependency graph to show the different dependencies between user interactions, system functions, services and system resources. The building of dependability models is a manual process. But once all dependencies are modelled correctly, the impact of a system resource outage to user functions can be calculated: if a resource fails, all dependent services, functions and user interactions must fail too.
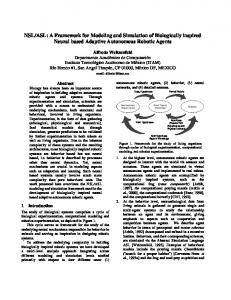
C. Dependency graph and dependency table The dependency graph in [Fig. 1] demonstrates how end user interactions depend on functions, services and resources. The graph consists of 4 rows which represent the model levels: user interactions, system functions, system services and system components. Elements of each level are connected to elements of nearby levels by 1:N relations from top to bottom (whereby the connections represent dependencies).
“Chaos Monkey” [14] from Netflix, which is able to randomly shut down IT services. This random shutdown is called an “attack”. In order to observe occurence of attacks one should define an observation time frame. For reasons of practicality we assume the observation time frame to be equal to one day, because we are interested in outages, not small failures which make the user perceive performance degradations only. For the simulation of outages we could use something similar to a “Chaos Monkey”, e. g. a Python script which attacks the components of the cloud operating system that we want to test. If we want outages to occur in a realistic setup we must assign probabilities to the component attacks. Realistic outage probabilities of components could only be obtained by regularly measuring downtime of the commercially available components over a long time frame and assume that we will achieve the same downtime probabilities for the components we use. Since there is no such data available, one must estimate the outage probabilities and use this estimation as the parameter we want to use for the probability of attacks.
F IG . 1: Dependency Graph.
The construction of such a dependency graph is done by first creating a dependency table (see [Fig. 2]). The graph consists in system requirements, use cases (user interactions), functions, services and components. As a first step a list of requirements for the modeled system is created and filled in the first column. Then for each element in the first column the user interactions that are needed to fulfill the requirement are drawn in the second column. Once the second column is filled up, all system functions that enable user interactions the second column are drawn in the third column. The same procedure is repeated recursively on the system functions, system services and components.
F IG . 2: Dependency table construction.
Once the dependency table is finished the dependency graph can be derived by transferring all elements of the table in a graph. Each cell in the table represents a node in the dependency graph. Nodes are never drawn multiple times. Each row shows a path from one user interaction to one function, one service and one component. This path is represented as sequence of arrows which connect the nodes. Each arrow must be drawn iteratively until all rows of the table are represented in the dependency graph. The result is a model of system components and user interactions which depend on the system components (see [Fig. 3]).
D. Simulation of outages Outages can be simulated by using a tool that shuts down the components listed in the dependency graph. One such tool is the
F IG . 3: Dependency Graph Construction.
Basically the probability of an outage in a given observation time frame depends on the observed time frame, the steady state availability of the component and the average recovery time needed for repairing the system component. [15] The mathematical formula for the outage probability is: Outage P robability = (100 − Steady State Avail.) ∗ Obs. T ime F rame Avg. Recovery T ime
(2)
If we assign steady state availabilities and average recovery times to each component listed in the dependability graph, we can derive the probabilities for the attacks we run in the simulation. If we e. g. assume that component A is observed for one day (=86’400 seconds), has a steady state availability of 90 % and an average recovery time of one hour (=3’600 seconds), the outage risk per day is 0.6 %. We can then programmatically advise the script to attack component A with a probability of 0.6 % in order to simulate an accidental outage of the component.
E. Measurement of downtime and outage impacts The simulation should not only run attacks on the components, but also register outages and measure their impact. In order to measure downtime, we could use a program that checks availability of system components. For this reason we must poll the tested system for
availability of the user interactions we are interested in. Again this can be done programmatically by using e. g. a Python script that runs the user interactions and check if they can be performed without errors. If any error occurs, it can be assumed that there is an outage. In order to give outage impact and downtime suffered a mathematical value, we must enhance our dependency table. This can be done by adding three columns to the dependency table: one for the “weight factors” or importance we want to assign to each use case, one for the average recovery time of each component and one for the downtime suffered in case of an outage (see [Fig. 4]). The weight factor reflects the importance we assign to each use case. In our test framework, we assign each use case a weight factor between 1 and 3, whereby 1 is the least important factor and 3 the most important one. The average recovery time is assigned to each component and is a value of several seconds. The expected downtime is then assigned to each use case. The downtime is assumed to be the maximum average recovery time of all components involved in one single use case, because all components which are involved in the outage must be recovered. For example, if components A and B are depend on use case C and A has a larger average recovery time than B, the downtime suffered for C is equal to the average recovery time of A. For this calculation we assume that in case of an outage, a system administrator must run failover mechanisms for all components that might cause the outage of the unavailable user task. Therefore the average recovery time of the use case outage cannot be shorter than the average recovery time of one of the components involved. In short: the expected downtime is equal to the “Mean Time To Recovery” (MTTR). [16]
F IG . 4: Assignment of weight factors.
Once the dependency table is enhanced it can be used for the calculation of outage impacts and downtime suffered: every time when the test script discovers an outage, it adds the weight factor to an impact outage variable and the suffered downtime to a total downtime variable. The outage impact of a test run is the sum of weight factors of all unavailable use cases and the suffered downtime is the sum of all downtimes discovered.
IV.
T HE SIMULATION FRAMEWORK
Once the dependency table and the table with outage probabilities are created, a simulation of outages can be run by using the Python scripts to attack the system components and the script to poll downtime and outage impacts. A test run is performed in 4 steps: 1) Run the attack 2) Poll the system to find out what impact the attack had on the system. 3) Collect the outage impact and downtime values and store them as one set of data in a test database. 4) Restore the initial state of the system and prepare it for further test runs. A simulation should consist of multiple test runs. Since we defined a test run as a possible “attack” running once a day, we could try to
simulate the full life cycle of the system. We did not yet define which data we want to collect besides outage impact and downtime. In the section about High Availability we argued that redundancy increases availability and complexity reduces availability in general. Therefore we want to measure the influence of redundancy and complexity on the availability of OpenStack. Therefore we must collect data on the number of redundant system nodes, clustering technology (if clustering technology is used) as well as details on the node configuration. The goal of the simulation should be to find a system architecture which provides the least downtime and impact of component failures.
V.
I MPLEMENTATION IN O PEN S TACK
The “Dependability Modeling Framework” does not evalutate which cloud is “better” in providing high availability levels than another one. The dependability model links user interactions or use cases to system components. Since use cases are made for concrete system implementations, we must first have a list of use cases in order to establish a dependability model. Therefore the “Dependability Modeling Framework” is rather a measurement procedure for a concrete implementation of a system architecture than a generalizable test. If we want to test OpenStack for its aptitude to deliver highly available cloud services using the “Dependability Modeling Framework”, we must take a concrete OpenStack implementation as test object.
A. Architectural aspects of the Mobile Cloud Network The MCN architecture uses all known OpenStack services, like e. g. “Nova” and “Cinder”. Furthermore it is supposed to run on the infrastructure of telecommunication providers and uses OpenStack to create virtual machines which perform tasks like routing of mobile data traffic. MCN exploits scalability of OpenStack in order to make the infrastructure of telecommunication companies more reliable. In order to keep it simple, we can say that the MCN architecture can be divided in the following component groups: • Hardware like e. g. physical server nodes, network cables etc. which are wired to each other. • Operating systems which run on the physical server nodes. • OpenStack cloud services running on top of each operating system. They provide the virtualization of the telecommunication infrastructure. • Virtual machines and virtual devices which run on top of OpenStack and themselves hosts the telecommunication services to mobile end users (customers of the telecommunication providers). Each component of the MCN architecture is then part of one of the groups. It can be assumed then that a MCN node consists in hardware, an operating system, OpenStack (and its services) and a virtual machine, which hosts telecommunication services. For construction of the dependency graph and dependency table we must know which user interactions/use cases are performed on the concrete OpenStack implementation (the MCN).
B. MCN User Interactions and OpenStack In order to create the dependency table of the OpenStack architecture, we must define which typical user tasks are expected to happen
in the cloud. A source for this information could be a list of typical use cases for cloud computing. Just like any list of use cases, the list of cloud computing use cases is derived from user requirements. In order to produce the list of user requirements, we took a white paper on cloud computing use cases [17] as our source for requirements. As a cloud-based platform, MCN implements such use cases which are common to all cloud services. According to the white paper the MCN suffices the following requirements: it must offer (federated) Identity Management for end users as well as cloud administrators. The cloud must be accessible by using an “open”, platformindependent client. It must provide metering and monitoring of end user activities, measure SLAs, benchmarks of the provided infrastrucutre and manage the lifecycle of the infrastructure. The MCN should be aware of end user locations. The MCN cloud should manage access and security policies and provide governance. Virtual machines should have a common file format and be accessible through a common API. All data used by the MCN should be managed in a federated database. The OpenStack software used in MCN suffices all common cloud requirements. [17] [Tab. I] shows the requirements and use cases which depend on the requirements. There is also a list of components used in the MCN architecture which are mainly responsible for enabling the user interactions.
are metrics that actually measure the High Availability characteristics of the architecture. Ideally both values should be as low as possible.
TABLE II: Dependency table of the MCN. Assignments (r)3-5 Use Case
Resp. Component
Weight
Avg. Rec. Time
Exp. Downtime
Update Telco Account
Operating System of VM User DB SSH/Password Management of VM
3 3 3
1’200 1’200 1’200
1’200 1’200 1’200
Password DB Horizon Apache Keystone MySQL
3 1 1 1 1
1’200 1’200 1’200 1’200 1’200
1’200 1’200 1’200 1’200 1’200
RabbitMQ Keystone MySQL RabbitMQ Horizon Apache
1 3 3 3 3 1
1’200 1’200 1’200 1’200 1’200 1’200
1’200 1’200 1’200 1’200 1’200 1’200
Keystone MySQL RabbitMQ Mobile Node Detection in VM Ceilometer VM Plugin
1 1 1 2 3 3
1’200 1’200 1’200 1’200 1’200 1’200
1’200 1’200 1’200 1’200 1’200 1’200
Ceilometer VM Plugin Keystone MySQL RabbitMQ
3 3 3 3 3
1’200 1’200 1’200 1’200 1’200
1’200 1’200 1’200 1’200 1’200
SSH/Password Management of VM Password DB Connection Management of VM Connection DB SSH/Password Management of VM Password DB
3 3 3 3 3 3
1’200 1’200 1’200 1’200 1’200 1’200
1’200 1’200 1’200 1’200 1’200 1’200
Keystone MySQL RabbitMQ Nova Glance Cinder
3 3 3 2 2 2
1’200 1’200 1’200 1’200 1’200 1’200
1’200 1’200 1’200 1’200 1’200 1’200
Swift MySQL RabbitMQ Glance MySQL
2 2 2 2 2
1’200 1’200 1’200 1’200 1’200
1’200 1’200 1’200 1’200 1’200
RabbitMQ Cinder MySQL RabbitMQ Swift MySQL
2 2 2 2 3 3
1’200 1’200 1’200 1’200 1’200 1’200
1’200 1’200 1’200 1’200 1’200 1’200
RabbitMQ Quantum MySQL RabbitMQ MySQL Ceilometer
3 3 3 3 3 2
1’200 1’200 1’200 1’200 1’200 1’200
1’200 1’200 1’200 1’200 1’200 1’200
All
VM Plugin Nova MySQL RabbitMQ OpenStack OS
2 3 3 3 49
1’200 1’200 1’200 1’200 600
1’200 1’200 1’200 1’200 600
All
OpenStack HW
49
600
600
Login to Dashboard
Update OpenStack Account
Manage Keypairs
Get End User Location Meter Usage of Telco Service Monitor VM and Infrastructure Update Policies
Telco Authenticate Telco Connect VM Admin Authenticate
TABLE I: Requirements to the MCN, dependent use cases and responsible components. Requirement Identity Management Openclient Federated Identity Management Location Awareness Metering and Monitoring Management and Governance Security
Common File Format Common API
Data Application and Federation SLAs and Benchmarks Lifecycle Management
Use Case/Interaction Update Telco Account Login to Dashboard Update OpenStack Account Manage Keypairs Get End User Location Meter Usage of Telco Service Monitor VM and Infrastructure Update Policies Telco Authenticate Telco Connect VM Admin Authenticate Update VM/Instances Update Images Update Volumes Update Storage Update Networks Collect Data Measure SLAs Manage Lifecycle
Resp. Component VM Horizon Keystone Keystone VM Provisioning Ceilometer Keystone VM VM Keystone, VM Nova Glance Cinder Swift Quantum MySQL Provisioning Nova
Starting with this table it is easy to proceed in creating the dependency table: we must only add all responsible components which enable availability of an use case/user interaction to the first table. The dependency table of the MCN is shown in [Tab. II]. [Tab. II] includes three additional columns, so called “Assignments”. The assignments are: 1) 2) 3)
the weight of the outage impact when the corresponding use case or user interaction becomes unavailable, the average recovery time when the corresponding component becomes unavailable and the expected downtime when the linked user interaction is interrupted.
These three columns are very important for rating an OpenStack architecture: when a component failure is detected, the outage impact and the expected downtime are added to an impact and a downtime variable. The sum of impact values and the sum of expected downtime
Update VM/Instances
Update Images
Update Volumes
Update Storage
Update Networks
Collect Data Measure SLAs Manage Lifecycle
The assumption in [Tab. II] is that the operating system and the hardware of a node have expected downtimes of 10 min. (= 600 seconds). All other components have downtimes of 20 min. (=1’200 seconds). We have also labelled two rows with the use case “All”. These rows are meant for the case that a hardware or operating system failure occurs in a physical node which runs OpenStack. In case of such a failure the OpenStack software, all virtual machines (which are managed by OpenStack) and all user services provided by them become unavailable. Just like any other software, OpenStack becomes unavailable if the underlying physical node fails. We have given the case of such a node failure the weight of 49 which equals the cumulated weight of all use cases/interactions provided by the MCN, because failure of physical systems means an outage of all use cases at once.
C. Setup of OpenStack simulation
TABLE IV: Test results of single node MCN OpenStack architecture.
With the dependency table we can start a simulation of the OpenStack architecture. The simulation consists in multiple test runs. A test run is performed in four steps: 1)
2)
3)
4)
Setup an OpenStack environment following the architecture we want to test for its High Availability capabilities. It is better to use an automated installation mechanism (like e. g. the OpenStack Automation [18] we use at the ICCLab) in order to automate the test run than to install and configure OpenStack manually. Test automation reduces the costs of testing and offers a higher coverage of fault detection. [19] Run a program that randomly disables the OpenStack services which are listed in the dependency table (like e. g. Nova, Keystone or Glance). The shutdown should not be completely random: it should be performed with a certain probability that reflects the expected availability levels and average recovery times of the OpenStack components. For example, if we expect the Keystone component to achieve an availability of 99.9 % and assume that the average recovery time of a Keystone outage is 20 minutes (= 1’200 seconds) and want to know the outage probability for one day (=86’400 seconds): we get the probability p = ((100 - 99.9) x 86’400) / 1’200 = 7.2 %. The shutdown program should disable the Keystone service with a probability of 7.2 %. An example of such a probability estimation is shown in [Tab.III]. Poll the available user interactions which are listed in the dependency table. This can be performed by running functional tests which simulate an user interaction. If the unit test fails, the weight of the use case in the dependency graph should be added to an impact variable. The assigned downtime should be summed to a downtime variable. Collect the results and clean the environment. All services which were disabled in step (2) must be restarted. The initial state of the system should be restored. If there were outages discovered in step (2) the impact and downtime values should be stored in a database.
Steps (1-4) should be seen as one test run which simulates availability of OpenStack components in one day. By repeatedly performing the test run, one could (theoretically) collect data which represents the whole life time of the OpenStack service.
TABLE III: Estimation of outage probabilities for the MCN components. Component
Availability Level
Avg. Recovery Time
Outage Risk per Day
Hardware of OpenStack installation OS of OpenStack installation
99.99999 % 99.99999 %
600 600
0.00144 % 0.00144 %
Apache Ceilometer Cinder VM internal Connection DB VM internal Connection Management Glance
99.9 % 99.9 % 99.9 % 99.8 % 99.8 % 99.9 %
1’200 1’200 1’200 1’200 1’200 1’200
7.2 % 7.2 % 7.2 % 14.4 % 14.4 % 7.2 %
Horizon Keystone VM internal Node Location Detection MySQL Nova
99.9 % 99.9 % 99.8 % 99.9 % 99.9 %
1’200 1’200 1’200 1’200 1’200
7.2 % 7.2 % 14.4 % 7.2 % 7.2 %
VM internal Operating System VM internal Password DB Quantum RabbitMQ VM internal Password Management Swift
99.8 % 99.8 % 99.9 % 99.9 % 99.8 % 99.9 %
1’200 1’200 1’200 1’200 1’200 1’200
14.4 % 14.4 % 7.2 % 7.2 % 14.4 % 7.2 %
VM internal User DB VM internal Ceilometer Plugin
99.8 % 99.8 %
1’200 1’200
14.4 % 14.4 %
(r)3-5 Simulation Run 001 002 003 004 005 006 007 008 009 010 011 012 013 014 015 016
VI.
Nbr. of Test-Runs 90 90 90 90 90 90 90 90 90 90 90 90 90 90 90 90 Average: Std.Dev.:
Total Downtime 112’800 262’800 192’000 187’200 120’000 198’000 162’000 276’000 337’200 118’800 171’600 129’600 146’400 93’600 175’200 213’600 181’500 64’142
Results Total Impact 572 1’554 1’208 984 704 1’182 930 1’660 1’966 546 970 744 916 492 1’036 1’196 1’041 401
Measured Availability 98.54938 % 96.62037 % 97.53086 % 97.59259 % 98.45679 % 97.45370 % 97.91667 % 96.45062 % 95.66358 % 98.47222 % 97.79321 % 98.33333 % 98.11728 % 98.79630 % 97.74691 % 97.25309 % 97.67168 % 0.82488 %
E VALUATION IN O PEN S TACK
The model was evaluated on a single node OpenStack Grizzly installation (all MCN components were installed on a single virtual machine). The installation was performed using Vagrant [20] and Puppet [21]. We simulated 3 months of service operation, which means that 90 test runs had to be accomplished. As simulation input we took the dependency table in [Tab. II] and the outage probabilities of [Tab. III]. There were 15 simulations performed. [Tab. IV] shows the results of the evaluation. It is not a very surprising result that a single node non-redundant OpenStack architecture (which does not cluster its cloud services) suffers downtime and has a rather low availability - especially when we assume that we use components that operate below the “Five Nines” availability (as defined in section II-A). The outage impact values are rather high. The impact values are good benchmarks for clustered OpenStack architectures: any High Availability technology which is used in combination with OpenStack must be smaller than the outage impact values measured in [Tab. IV]. Although the evaluation has not been performed yet on clustered cloud services, the evaluation serves as a proof for the validity of the dependability modeling concept as a best practice method for measuring High Availability capabilities of cloud architectures.
VII.
C ONCLUSION
In this paper we wanted to describe a test method which is able to test “High Availability” capabilities of cloud solutions like e. g. OpenStack. From our perspective “High Availability” means that the availability (i. e. the ratio between uptime and operating time of an IT system) is higher than 99.999 %. We have defined availability as the ability of an IT system to execute tasks which are required by service consumers. When the service consumer or end user can not perform agreed user interactions, the IT system suffers downtime and the availability gets reduced. Following this definition we created a test procedure which links the abilities of system components to use cases. We found that the “Dependability Modeling Framework” is a good approach to model dependencies between system components, services, functions and user interactions, because it shows the relation between IT system components and tasks of service consumers in a dependency table and dependency graph. We described a simulation which uses the dependability model in order to test HA capabilities
of system architectures. The simulation consisted of several test runs which simulated random shutdown of system components. (Whereby this “randomness” follows previously defined outage probabilities which reflect availability levels of the components used in the system architecture.) After each shutdown, it was tested if the required user interactions were still available. In case of an outage, the impact of the outage was measured as a score value which reflects the importance of the failed user interaction. Each user interaction had also an expected downtime which was assigned to it. In case of failure this downtime was registered too. The total impact and total downtime of all outages was collected during the simulation. They served as a rating for the High Availability capabilities of the system architecture. This test procedure serves as an approach to test system architectures in terms of meeting High Availability criteria. In order to prove the validity of the concept we created a dependability model of the OpenStack architecture used in the Mobile Cloud Network project. We assigned outage impact weights and downtimes to typical MCN use cases. We assigned outage probabilities to the components used in the MCN OpenStack environment and performed a simulation of outages for a single node OpenStack architecture. As a result we measured that a non-clustered OpenStack architecture does not offer high availability values. We also showed that our test framework makes High Availability capabilities of cloud architectures measurable.
VIII.
F UTURE WORK
While we have described the theoretical framework on how to test High Availability capabilities simple deplyoments of OpenStack, we still must run the tests on different OpenStack architectures. There are a number of High Availability technologies which could be used in an OpenStack environment: one could e. g. run OpenStack on redundant block storage disks by using DRBD [22] technology, or one could use scalable clustering technologies like Ceph [23] to make the OpenStack components available redundantly. Another important part are failover systems like e. g. Pacemaker. [24] Some failover technologies work very reliably, others do not. The important part to be done is to collect empirical data and find out if there are correlations between the underlying clustering and failover technology, the number of cluster nodes and the measured outage severity. This work still has to be done and the results will be presented in another paper.
ACKNOWLEDGEMENTS This work is partially supported by the European Community Seventh Framework Programme (FP7/2001-2013) under grant agreement no.318109. We would like to thank Christof Marti, Thijs Metsch and Andrew Edmonds for their editorial review of this paper.
R EFERENCES [1] Marcus, E., Stern, H. (2003). Blueprints for High Availability. Indianapolis: Wiley Publishing. [2] ICCLab (2013). “Mobile Cloud Networking.” http://www.cloudcomp.ch/research/foundation/ projects/mobilecloud-networking/ Accessed on 2013/05/31. [3] Pepple, K. (2011). Deploying OpenStack. Sebastopol: O’Reilly Media.
[4] Frincu, M. E., Craciun, C. (2011). “Multi-objective meta-heuristics for scheduling applications with high availability requirements and cost constraints in multi-cloud environments.” Proceedings of the 4th IEEE International Conference on Utility and Cloud Computing (UCC): 267274. [5] Calheiros, R. N., Ranjan, R., Beloglazov, A., De Rose C. A. F., Buyya, R. (2011). “CloudSim: A Toolkit for Modeling and Simulation of Cloud Computing Environments and Evaluation of Resource Provisioning Algorithms.” Software: Practice and Experience (SPE), Vol. 41 (Issue 1): 23-50. [6] Rance, S., Hanna, A. et al. (2007). ITIL V3 Glossary of Terms, Definitions and Acronyms. London: Office of Government Commerce. [7] Tam, F. (2009).Service Availability Standards for Carrier-Grade Platforms: Creation and Deployment in Mobile Networks. Doctoral Thesis. Tampere: University of Tampere. [8] Vargas, E. (2000). “High availability fundamentals.” Sun Blueprints series. [9] Gray, J., Siewiorek, D.P. (1991). “High-Availability Computer Systems”. Computer, Vol. 24 (Issue 9): 39-48. [10] Patterson, D. A. (2002, November). “A simple way to estimate the cost of downtime.” Proceedings of the 16th Systems Administration Conference LISA: 185-188. [11] Avizienis, A., Laprie, J.-C., Randell, B., Landwehr, C. (2004). “Basic Concepts and Taxonomy of Dependable and Secure Computing.” IEEE Transactions on Dependable and Secure Computing, Vol. 1 (Issue 1): 11-33. [12] Donzelli, P., Basili, V. (2006). “A practical framework for eliciting and modeling system dependability requirements: Experience from the NASA high dependability computing project.” The Journal of Systems and Software, Vol. 79: 107-119. [13] Basili, V., Donzelli, P., Asgari, S. (2004). “The unified model of dependability: Capturing dependability in context.” IEEE Software, Vol. 21 (Issue 6): 1925. [14] Netflix (2013). “Chaos Home.” https://github.com/Netflix/SimianArmy/wiki/Chaos-Home Accessed on 2013/06/01. [15] Maciejewski, H., Caban, D. (2008). “Estimation of repairable system availability within fixed time horizon.” Reliability Engineering System Safety, Vol. 93 (Issue 1): 100-106. [16] Torell, W., Avelar, V. (2004). “Mean time between failure: Explanation and standards.” White Paper, Vol. 78. [17] Ahronovitz M. et. al. (2010). “Cloud Computing Use Cases: A white paper produced by the Cloud Computing Use Case Discussion Group.” http://www.scribd.com/doc/18172802/Cloud-Computing-Use-CasesWhitepaper Accessed on 2013/05/17. [18] ICCLab (2013). “Cloud Automation.” http://www.cloudcomp.ch/research/foundation/ themes/initiatives/cloud-automation/ Accessed on 2013/05/29. [19] Dssouli, R., Saleh, K., Aboulhamid, E., En-Nouaary, A., Bourhfir, C. (1999). “Test development for communication protocols: towards automation.” Computer Networks, Vol. 31 (Issue 17), 1835-1872. [20] Palat, J. (2012). “Introducing Vagrant.” Linux Journal, Vol. 2012 (Issue 220), 2. [21] Loope, J. (2011). Managing Infrastructure with Puppet. Sebastopol: O’Reilly Media. [22] Reisner, P. (2002). “DRBD Distributed Replicated Block Device.” Proceedings of the 9th Linux Congress. [23] Weil, S.A., Brandt, S. A., Miller, E. L., Long, D. D. E., Maltzahn, C. (2006).“Ceph: a scalable, high-performance distributed file system.” Proceedings of the 7th symposium on Operating systems design and implementation (OSDI): 307-320. [24] Haas, F. (2012). “Ahead of the pack: the pacemaker high-availability stack.” Linux Journal, Vol. 2012 (Issue 216), 4.
Konstantin Benz is researcher at the ICCLab. His field of expertise ranges from reporting, data analysis and applied statistics to the design of distributed system architectures. His main research interest is system architecture of cloud computing infrastructure. In 2008 he started his professional career in IT Service Management at IBM, where he worked in several projects that aimed at reengineering and further development of IBMs internal infrastructure. In 2011, he moved to the Technical University of Applied Science in Zurich, which meanwhile became part of ZHAW. He participates in an MSE program at the Institute of Information Technology where he studies Service Engineering.
Thomas Michael Bohnert is Associate Professor (Docent) at Zurich University of Applied Sciences and heads the ICCLab. His interests are focused on enabling ICT infrastructures, coarsely ranging across mobile / cloud computing, service-oriented infrastructure, and carrier-grade service delivery (Telco + IT). Prior to being appointed by ZHAW he was with SAP Research, SIEMENS Corporate Technology, and ran an IT consultancy named BNCS. He was a visiting scholar at Tampere University of Technology, NEC Network Research Labs, VTT Technical Research Centre, and Beijing University of Posts and Telecommunications. His works have been published in several books, journals, and conferences. He serves as regional correspondent (Europe) for the IEEE Communication Magazines news section (GCN). He is the founder of the IEEE Broadband Wireless Access Workshop and holds several project and conference chairs. From 2009-1011 he was on the steering board of the European Technology Platform Net!Works. Deep involvement in the design of the Future Internet Public-PrivatePartnership led to the appointment as Deputy Chief Architect, presiding the FI-PPP Architecture Board and the FI-WARE project.