JOURNAL OF DISPLAY TECHNOLOGY, VOL. 4, NO. 1, MARCH 2008
101
Depth Mapping of Integral Images Through Viewpoint Image Extraction With a Hybrid Disparity Analysis Algorithm ChunHong Wu, Malcolm McCormick, Amar Aggoun, Member, IEEE, and S. Y. Kung, Fellow, IEEE
Abstract—Integral imaging is a technique capable of displaying 3–D images with continuous parallax in full natural color. It is one of the most promising methods for producing smooth 3–D images. Extracting depth information from integral image has various applications ranging from remote inspection, robotic vision, medical imaging, virtual reality, to content-based image coding and manipulation for integral imaging based 3–D TV. This paper presents a method of generating a depth map from unidirectional integral images through viewpoint image extraction and using a hybrid disparity analysis algorithm combining multi-baseline, neighborhood constraint and relaxation strategies. It is shown that a depth map having few areas of uncertainty can be obtained from both computer and photographically generated integral images using this approach. The acceptable depth maps can be achieved from photographic captured integral images containing complicated object scene. Index Terms—Integral imaging, three–dimensional (3-D) acquisition, 3-D image display, 3-D image reconstruction.
I. INTRODUCTION
T
HERE is growing evidence that three-dimensional (3-D) imaging techniques will have the potential to establish a future mass-market in the fields of entertainment and communications. One much discussed application is 3-D television. Many different approaches have been adopted in attempts to realize free viewing (auto-stereoscopic) 3-D TV. True auto-stereoscopic 3-D visualisation systems exhibiting parallax in all directions, which allow accommodation and convergence to work in unison, are ideally required. Holography, which demonstrates these characteristics, continues to be researched by different groups in an effort to produce full color realistic spatial images. However, the requirements for coherent light sources, dark room conditions, and high mechanical stability during recording reduce the practical utility of holographic technique for general 3-D spatial video imaging applications. Manuscript received September 7, 2006; revised May 3, 2007. C. Wu is with the School of Information Engineering, University of Science and Technology, Beijing, China (email:
[email protected]). M. McCormick is with Create 3-D, Sheffield S11 8FT, U.K. (e-mail:
[email protected]). A. Aggoun is with the 3-D Imaging Group, Department of Electronic and Computer Engineering, Brunel University, Uxbridge UB8 3PH, U.K (e-mail:
[email protected]). S.Y. Kung is with the Department of Electrical Engineering, Princeton University, Princeton, NJ 08544 USA (e-mail:
[email protected]). Color versions of one or more figures are available online at http://ieeexplore. ieee.org. Digital Object Identifier 10.1109/JDT.2007.904360
In the past decades, most of the research for 3-D display systems has centered on stereoscopic 3-D imaging, which requires multiple cameras in capture and matching multiview displays [1]–[3]. The requirement for wearing a special pair of glasses can be avoided by using parallax barriers or lenticular decoders. However, both types of presentation may cause eye strain, fatigue, and headaches after prolonged viewing [2]. To date, this has limited the acceptance and application of stereoscopic displays. Integral imaging is a technique that is capable of creating and encoding a true volume spatial optical model of the object scene in the form of a planar intensity distribution by using unique optical components [4]–[9]. It is akin to holography in that 3-D information recorded on a 2-D medium can be replayed as a full 3-D optical model, however, in contrast to holography, coherent light sources are not required. This conveniently allows more conventional live capture and display procedures to be adopted. With recent progress in the theory and microlens manufacturing, integral imaging is becoming a practical and prospective 3-D display technology and is attracting much interest in the 3-D area [4]–[9]. To date, most researchers have concentrated on establishing appropriate viewing parameter characterization and improved image generation. However, there are many data processing issues that require specialist solutions unique to integral images. One of these issues, the knowledge of spatial position, is particularly useful for example when editing content or combining real and computer generated 3-D integral images. Depth information is also essential to enable content-based image coding for future integral imaging based 3-D TV. This paper seeks to address the particular issue of analysing integral images in order to extract depth information from the planar-recorded integral image. Depth information has many other applications of cause, for example, in medical imaging, robotic vision, displays, and surveillance systems. Integral imaging involves many microlenses in one recording. Consequently, a number of perspective 2-D images, as many as there are lenses in the lens array, are obtained in a single capture process. These images are called “elemental images” according to the convention in the literature [4]–[14]. Matching corresponding intensity distributions from the “elemental images” using the convention depth measurement approaches is difficult and yields a very low resolution. As a rather new research area, the literature on depth extraction from integral images is limited. The first reported work is that of Manolache et al. in 1998, where the point-spread function of the optical recording
1551-319X/$25.00 © 2007 IEEE Authorized licensed use limited to: Brunel University. Downloaded on October 7, 2008 at 11:46 from IEEE Xplore. Restrictions apply.
102
JOURNAL OF DISPLAY TECHNOLOGY, VOL. 4, NO. 1, MARCH 2008
is used to describe the associated integral image system and the depth estimation task is tackled as an inverse problem. In the practical case, the image inverse problem proves to be ill posed and the discrete correspondents are ill conditioned due to the inherent loss of information associated with the model in the direct process. Therefore, the method can only be applied on simulation using numerical data [10], [11]. In the author’s previous work, a practical approach for obtaining depth by viewpoint image extraction and disparity analysis was explored and presented [13]. The viewpoint image was formed by sampling pixels from different microlens rather than a macro block of pixels corresponding to a microlens unit. Each “viewpoint image” presented a two-dimensional (2-D) parallel recording of the 3-D scene from a particular direction and had a much higher pixels numbers (resolution) than the “elemental images” in a typical integral image. Object depth was then calculated from the viewpoint image displacement using a new depth equation, which gave the mathematical relationship between object depth and correspondence viewpoint image displacement. To improve the performance of the disparity analysis, an adaptation of the multi-baseline technique taking advantage of the information redundancy contained in multiple viewpoint images of the same scene was used. The developed method was validated and successfully applied to both captured and computer generated integral images. The idea of viewpoint image extraction on 3-D object reconstruction was also reported by Arimoto and Javidi [14]. The integral imaging requires only one recording in obtaining 3-D information and therefore no calibration is necessary to acquire depth values. The compactness of using integral imaging in depth measurement was soon attracting attention as a novel depth extraction technique [15], [16]. In the conventional stereo matching system, the quantization error is increased with the object depth and a considerable quantization error will be caused when the object depth is large. While different to the conventional stereo vision method, the quantization error obtained from the extracted viewpoint images is maintained at a constant value and irrelevant with the depth [13], [16]. To take the advantage of both, Park et al.. proposed a method for extracting depth information using a specially designed lens arrangement [16]. The lens array is composed by rectangular lens with a long vertical pitch size and fine horizontal pitch size. The subimage (viewpoint image) was formed through the extracting (modifying) pixels along horizontal direction only. The horizontal subimages were used to reduce quantization error when the object depth is large and the vertical subimages preserves the characters of the conventional stereo match and achieves a small quantization error when object depth is small. The result suggests a compact and high precision depth-measuring instrument based on integral imaging. The scope of the integral imaging application also has been further extended to 3-D object recognition [4], [18]. In the previous work the window size for matching was chosen experimentally [13]–[16]. In general, a smaller matching window gives a poor result within the object/background region while a larger window size gives a poorer contour of the object. This work addresses the problem of choosing of an appropriate window size in obtaining the improved depth results. More
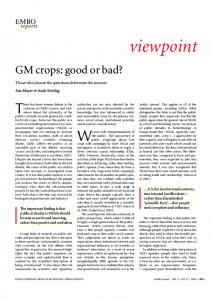
Fig. 1. Direction selectivity in the integral image recording.
precisely, a Neighborhood constraint and relaxation technique is adapted by considering the spatial constraints in the image. The results show that a hybrid disparity analysis algorithm formed by combining both the modified multi-baseline technique and the neighborhood constraint and relaxation technique gives an improvement in the depth maps generated for both computer-generated and captured integral images. II. VIEWPOINT IMAGE EXTRACTION AND DEVELOPED DEPTH EQUATION The key feature of the integral imaging is the use of a microlens array to record the object scene, Fig. 1. Each microlens in the array can be regarded as a very small, low-resolution camera, therefore the “elemental images” under each microlens is very small. (In a typical case, where the pitch size of a lenticular sheet is 600 m and the image has a resolution of 600 dpi, there are less than 15 pixels under a micro lens). Matching corresponding intensity distributions from the “elemental images” is consequently difficult due to the very low resolution. Integral image data exists in 2-D format but contains all the information necessary for 3-D spatial represent. The depth information is embedded in the recording in a unique manner. Fig. 1 illustrates the direction selectivity in the integral image recording. The recording film is placed at the focal plane of the microlens sheet. For all the rays in the same direction, the recording pixels will have identical local positions under their own corresponding microlens. The different recording positions only depend on which microlens surface the ray
Authorized licensed use limited to: Brunel University. Downloaded on October 7, 2008 at 11:46 from IEEE Xplore. Restrictions apply.
WU et al.: DEPTH MAPPING OF INTEGRAL IMAGES THROUGH VIEWPOINT IMAGE EXTRACTION
103
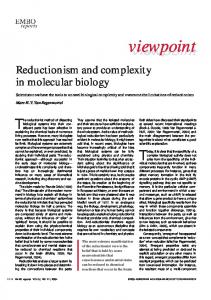
Fig. 2. Illustration of viewpoint image extraction (For simplicity, assume there are only four pixels under each microlens. Pixels in the same position under different microlenses, represented by the same pattern, are employed to form one viewpoint image).
Fig. 4. Geometric model in obtaining the depth equation.
case described above, where the pitch size of the microlens sheet is 600 m and the image has a size of 12 cm, there will be 200 pixels in one formed viewpoint image along horizontal direction. Matching corresponding intensity distributions from the formed “viewpoint images” is, therefore, easier compared to the “elemental images.” It is important to point out that the viewpoint image is different from the traditional 2-D image. It is a parallel projection recording of the 3-D space rather than a perspective projection as in the common 2-D recording. In previous work [13], the depth equation, which gives the mathematical relationship between the object depth and the corresponding viewpoint image pair displacement, was derived through geometrical analysis of the optical recording process. The depth equation is given as (1)
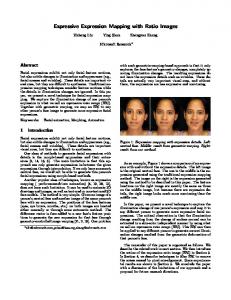
Fig. 3. One captured integral image (a) and the extracted viewpoint images II horseman (b) (The images have been scaled for illustration purpose. The blur appearing in (a) is caused by the special II recording format. A 3-D scene can be replayed with a microlens sheet having proper parameters).
reaches. From the image point of view, all pixels in the integral image at the same local position under different microlenses contain the recording of the object scene from the same dionly contain rection. As an example, all pixels marked as data recorded from the direction, Fig. 1. In this work, the viewpoint image is artificially synthesized by sampling all the pixels at one microlens interval displacement. Therefore, it contains the recording from one particular view direction. Fig. 2 graphically illustrates how the viewpoint images are extracted. Fig. 3 shows one example of unidirectional integral image and the extracted viewpoint images. The pixels numbers of the formed viewpoint image (along horizontal direction) will depend on the size of the integral image. In the typical
where is the corresponding depth to be calculated, are the pitch size and the focal length of the recording microlens, is the disparity of the object point within two extracted viewpoint images and is the sampling distance between the two viewpoint images, as in Fig. 4 (see [13]). This equation gives the relationship of object depth and the corresponding disparity between two extracted viewpoint images. For an object at a particular depth, the depth can be calculated from the viewpoint images by establishing the corresponding disparity [13]. III. UNITS DISPARITY ANALYSIS A. Disparity Analysis Using a Correlation-Based Block-Matching Algorithm With Multi-Baseline Technique An immense amount of published literature and algorithms relating to correspondence are available [19]–[24]. Perhaps the simplest and most effective of correspondence algorithms is the block-matching method [19]. This was adopted and used in conjunction with a modified multi-baseline algorithm in the previous work [13], [16]. Modifications to the original multi-stereo
Authorized licensed use limited to: Brunel University. Downloaded on October 7, 2008 at 11:46 from IEEE Xplore. Restrictions apply.
104
JOURNAL OF DISPLAY TECHNOLOGY, VOL. 4, NO. 1, MARCH 2008
algorithm [20], proposed by Okutomi and Kanade, were made to accommodate the fact that the viewpoint images are different from a traditional 2-D image [13], [16]. The modified multi-baseline algorithm can be described as follows. Given viewpoint image pairs with different sample that minimizes the Sum of the distances, find the depth SSD-in-distance function
(2) (3) , where is the number of pixels within the window. The local window intensity adjustment is introduced in order to reduce the error caused by the variation of the illumination between different viewpoint images. This is particularly important in analyzing the disparity between viewpoint images due to the directional illumination differences. The matching judgment is carried out using an accumulated score functions from all the viewpoint image pairs with different sample distances. The modification used is to replace the SSSD-in-inverse-disused in the stereo vision by a tance function . The performance of SSSD-in-distance function this modified multi-baseline algorithm has been reported [13]. The main problem identified in performance was that due to the fixed matching window size used. In general, the smaller the matching window the poorer the result within the object/background region due to the low signal-to-noise ratio (SNR), while choosing a bigger matching window size improves the matching results within the object/background region but gives a worse contour of the object. Improvement in selecting an appropriate window size was therefore an imperative.
Fig. 5. The neighborhood (B) of a matching block B .
is, the depth is piecewise continuous in the space [22], [24]. Therefore, the disparity can be more robustly estimated if the disparity within the neighborhood is considered. To better deter, the neighmine the matching position of a feature block are considered rather than individually boring blocks considering each single block. This allows singular and erroneous depth estimation from a small matching window size to be corrected by considering the surrounding depth (just like median filtering). By assigning different weighting factors to different neighboring blocks, the matching window size and shape can be adaptively controlled according to the matching contents. Moreover, the neighborhood relaxation was used to allow local variation of the disparity in considering the fact that the expected disparity of a neighboring block is not necessarily equal to the center block. Neighborhood relaxation provides better flexibility leading to more accurate depth estimation. In considering the neighborhood constraint, the new score function used in determining the matching position can be introduced as
B. Neighborhood Constraint and Relaxation Technique The problem of choosing an appropriate matching window size is a basic problem existing in stereo matching. Perhaps the most successful work was the adaptive window algorithm been reported by Kanade and Okutomi [20]. The algorithm first employs a statistical model in computing the uncertainty of disparity estimate, which takes into account of both intensity and disparity variances, and then searches for a window that produces the estimate of disparity with the least uncertainty for each pixel of an image. The statistical model relies on an additive Gaussian white noise distribution assumption within the image, which is satisfactory for most 2-D image. In our current task, however, sampling discrete pixels forms the viewpoint images and the noise distribution within in one viewpoint image cannot simply be modeled by the Gaussian white noise. As a result, applying the adaptive window algorithm directly cannot give a positive improvement. A Neighborhood constraint and relaxation technique was, therefore, considered appropriate for choosing a suitable window size in our task. The foundation of the neighborhood constraint and relaxation technique is based on the spatial-consistency rule. That
(4) where represents the window around pixel , whose is the set of neighdisparity is to be determined. , as shown in Fig. 5 and boring blocks of is the weighting factor for the different neighbor blocks. The weighting scheme is introduced to reduce the estimation error caused when the neighborhood block contains pixels at different depths. The weighting factors can be made to be dependent on several factors: In terms of the distance factor, the closer the spatial distance of the neighboring block to the central block, the greater the possibility that they have the same/similar depth. The further the distance between the neighboring block and the center block, the less effect the block has on the final score. In terms of the color similarity factor, based on the fact that the blocks within the same object usually have high color similarity, it is reasonable to put a high weighting factor on those blocks that have high similarity in color to the central block. The weighting factor for those blocks with color similarity lower than a particular threshold is set to zero, where the spatial-consistency rule is not satisfied. By adjusting the
Authorized licensed use limited to: Brunel University. Downloaded on October 7, 2008 at 11:46 from IEEE Xplore. Restrictions apply.
WU et al.: DEPTH MAPPING OF INTEGRAL IMAGES THROUGH VIEWPOINT IMAGE EXTRACTION
105
weighting factor, the neighborhood of a block can be involved flexibly and adaptive in the matching process. Neighborhood relaxation is subsequently used to allow for local variations of the depth among neighboring blocks. That is, the expected depth of a neighboring block is close to but not necessarily equal to the central block under the spatial-consistency rule. This effectively allows some depth variations among the neighboring blocks . The overall score function can then be expressed as
(5) Equation (5) is the completed score criterion for the neighborhood constraint and relaxation. The neighborhood constraint is implemented by summing the SSD functions of the windows in the neighborhood. The neighborhood relaxation is implemented by incorporating to allow a certain degree of disparity excursion between neighboring blocks. The first item reflects the influence of the feature block while the second the influence of the neighbors. The neighborhood of a block is, therefore, made adaptive by adjusting the weighting factor. The expected disparity is obtained on the position where the score function has the minimum (6) A features block pre-selection is implemented by evaluating the variance of the blocks before disparity analysis. When the intensity variance within the block is smaller than a given threshold, the block can be considered as “untraceable”. Only the blocks that contain enough features for a confident match are kept for further analysis. It is an efficient and informative procedure. In the final depth map, the depth of these positions can be recovered from the neighborhood blocks.
Fig. 6. Neighborhood blocks sequence used in the hybrid algorithm.
similarity factor (CSF) was defined according to the color difference. The DF and CSF were described in (7) and (8), respectively (7) (8) where and are the distant factor and color factor coefand are the average inficient, respectively, and tensity of the blocks and , respectively. As a result, a close neighboring block gives more contribution to the evaluation function. The further the distance between the neighboring block and the center block, the less effect the block has on the final score. The blocks have high color similarity to the central block will have a relatively high weighting factor, vice versa. To combine the multi-baseline and neighborhood constraint function is used to reand relaxation techniques, a place function in the score function in (4). The score function combining the two techniques can be written as
C. Implementation of the Hybrid Disparity Analysis Algorithm The hybrid disparity analysis algorithm combines both the modified multi-baseline technique and the neighborhood constraint and relaxation technique described in the previous section. It is implemented using C language and was run under the UNIX operating system. The major parameters used in the algorithm are: 1) basic block matching window size (BW); 2) feature block pre-selection threshold (FBPT); 3) neighborhood block number (NBN). Fig. 6 shows the arrangement of the neighborhood block sequence in the algorithm. The neighborhood block is arranged in a sequence according to the distance to the center block. The closer blocks (1,2,3,4) are followed by further blocks (5,6,7,8). The number NBN defines the number of blocks in the sequence that can be chosen as “neighbor.” A bigger NBN gives a bigger neighborhood. Usually, NBN is chosen as the following numbers: 4, 8, 12, 20, 24, 28, 36, 44, and 48. As an example, when , all blocks with number no more than 12 (marked in grey in Fig. 6), are chosen as the neighborhood to the feature block. In the experiment, the distance factor (DF) was defined according to the inverse distance to the central block, the color
(9) The depth is obtained directly at the position where the score function has the minimum using all the extracted viewpoint images. IV. EXPERIMENTAL WORK A. Computer Generated Unidirectional Integral Image A simple computer generated unidirectional integral image, CGII box, is initially considered, as shown in Fig. 7(a). Fig. 7(b) shows the eight extracted viewpoint images from 7(a). The 3-D scene, which contains a thin box placed in front of a plane background, can be replayed using a microlens sheet with appropriate parameters. Fig. 8(a) is the ground-truth map of the object scene. Fig. 8(b)–(d) compares the depth maps obtained from different disparity analysis algorithms with best results. (b) GF algorithm: Use basic block matching criterion, chose the median as the final result. (c) MB algorithm: Use traditional block matching criterion with multi-baseline technique only. (d) MB-NCR algorithm: Use the neighborhood constraint and
Authorized licensed use limited to: Brunel University. Downloaded on October 7, 2008 at 11:46 from IEEE Xplore. Restrictions apply.
106
JOURNAL OF DISPLAY TECHNOLOGY, VOL. 4, NO. 1, MARCH 2008
TABLE I MAJOR PARAMETERS AND THE STATISTIC DATA FOR FIG. 7
Fig. 7. A computer-generated unidirectional integral image CGII box.
Fig. 9. Computer-generated unidirectional integral image CGII balls.
Fig. 8. Ground Truth depth map and depth maps obtained from different algo. rithms on the CGII box. (a) Ground Truth. (b) GF. (c) MB. (d)
MB + NCR
relaxation criterion with multi-baseline technique. Table I list the major parameters, run time and error statistic results for each algorithm. Both root-mean-squared (rms) error and percentage of bad pixels indicates that the best depth map was achieved with the MB-NCR algorithm. The modified multi-baseline technique effectively removes the mismatch within the object region by accumulating the evaluation function from multiple viewpoint images while the neighborhood constraint and the relaxation algorithm achieves a further improvement through flexibly choosing the matching area. Compares with the depth maps obtained from other algorithms, almost all the false matching results exist in the object region has been removed with a good object contour perceived in Fig. 8(d). Another computer-generated integral image (CGII-balls), which contains several objects at different depths and a plain background, was further used for test. The UII data is shown in Fig. 9. Fig. 10(a)–(d) shows the depth maps obtained from different algorithms on Fig. 9. The major parameters and the run time for each algorithm are listed in Table II. Fig. 10(a): MB algorithm matching window size; Fig. 10(b): MB algorithm using a matching window size; Fig. 10(c): MB+NRC alusing a gorithm using a basic matching window size; Fig. 10(d):
Fig. 10. Depth maps from different algorithms on the CGII balls. (a) MB1. (b) MB2. (c) . . (d)
MB + NCR
MB + NCR + PreSelection
TABLE II MAJOR PARAMETERS FOR OBTAINING FIG. 10
MB+NCR algorithm plus feature block pre-selection. As expected, a smaller matching window gives more error within the object region [Fig. 10(a)] while a bigger matching window
Authorized licensed use limited to: Brunel University. Downloaded on October 7, 2008 at 11:46 from IEEE Xplore. Restrictions apply.
WU et al.: DEPTH MAPPING OF INTEGRAL IMAGES THROUGH VIEWPOINT IMAGE EXTRACTION
107
Fig. 11. Depth map from captured UII data, horseman.
gives a worse contour of the object Fig. 10(b). A good compromise was achieved through flexibly choosing the matching area using the NCR technology, Fig. 10(c). The plain background was clearly marked out with the Feature Block Pre-Selection technology, Fig. 10(d). Objects at different depths have been successfully detected: The red ball in the foreground appears as the color orange. The golden ribbon-like object that traverses the scene and passes beneath the red ball is color coded from orange through yellow to green. The blue ball behind the recording plane appears in the color light blue and the yellow ring in the rearmost is blue. The background region (without pattern) is detected and represented by dark blue. The positions of the objects can be clearly interpreted from the depth map given in Fig. 10(d). Continuous depth variation is also perceivable. For example, the depth variation of the red ball can be clearly appreciated from the color coded depth map. The errors mostly appear in the occluded region, on the left of the blue ball and to the right of red ball. B. Captured Unidirectional Integral Image Further experiments were carried out on real integral image data. Two images, labeled as II Horseman and II Tank were analyzed. Both images can be replayed by using a lenticular sheet with suitable parameters. The first image, II Horseman, Fig. 3(a) contains a man sit on a horse with black background. The eight extracted viewpoint images are shown in Fig. 3(b). Fig. 11 shows the depth map obtained from above described hybrid disparity algorithm. The different depths of the horse and the man who sits up on the horse can be correctly perceived from the extracted depth map. The head of the horse appears as yellow, the forelegs of the horse, the man light blue and the rear-legs and tail of the horse a darker blue according to the color scale chosen for increasing depth. The background region was detected by the feature block pre-selection and marked in dark blue. The second image, II tank, contains a tank model on a simulated sandbank basement. Fig. 12(a) shows two of the eight viewpoint images. The extracted depth map is shown in Fig. 12(b). The depth variations within the tank and basement are perceivable within the depth map. A brighter color means a position in the front of the scene. The picture was taken from the upper-front corner position of the tank. The tank is standing on the middle of the terrain.
Fig. 12. Depth map (b) and one of the 2-D views (a) of the captured UII data, II tank. (a) Two 2-D viewpoint images of II tank. (b) Extracted depth map.
V. CONCLUSION Following the previous work on extracting depth information from integral images using viewpoint images, the current work uses a hybrid algorithm combining both multi-baseline and neighborhood constraint and relaxation techniques with feature block pre-selection in disparity analysis to improve the performance of the depth estimation. Experiments prove that the algorithm works effectively in achieving a good balance of reduced mismatching while maintaining a good object contour. Using the hybrid algorithm, the depth maps can be generated from both the computer generated and photographic integral image containing natural scene with acceptable quality. A recognizable depth map achieved from a photographic-captured integral image contains a complicated object scene in the first time. ACKNOWLEDGMENT The authors thank the anonymous reviewers for their comments and suggestions. They also thank F. GuoLiang in University of Science and Technology, Beijing, China, for obtaining the error statistic results in Table I. REFERENCES [1] T. Motoki, H. Isono, and I. Yuyama, “Present status of three-dimensional television research,” Proc. IEEE, vol. 83, no. 7, pp. 1009–1021, Jul. 1995. [2] S. Yano, S. Ide, T. Mitsuhashi, and H. Thwaites, “A study of visual fatigue and visual comfort for 3-D HDTV/HDTV images,” Displays, vol. 23, pp. 191–201, 2002. [3] T. Okoshi, Three-Dimensional Imaging Techniques. London, U.K.: Academic, 1976.
Authorized licensed use limited to: Brunel University. Downloaded on October 7, 2008 at 11:46 from IEEE Xplore. Restrictions apply.
108
JOURNAL OF DISPLAY TECHNOLOGY, VOL. 4, NO. 1, MARCH 2008
[4] N. Davis, M. McCormick, and M. Brewin, “Design and analysis of an image transfer system using microlens arrays,” Opt. Eng., vol. 33, no. 11, pp. 3624–3633, 1994. [5] S. Monaleche, A. Aggoun, A. McCormick, N. Davies, and S. Y. Kung, “Analytical model of a 3d recording camera system using circular and hexagonal based spherical microlenses,” J. Opt. Soc. Amer. A, vol. 18, no. 8, pp. 1814–1821, 2001. [6] R. Martinez-Cuenca, G. Saavedra, M. Martinez-Corral, and B. Javidi, “Extended depth-of-field 3-D display and visualization by combination of amplitude-modulated microlenses and deconvolution tools,” J. Display Technol., vol. 1, no. 2, pp. 321–327, Dec. 2005. [7] F. Okano, H. Hoshino, J. Arai, and I. Yuyama, “Real-time pickup method for a three-dimensional image based on integral photography,” Appl. Opt., vol. 36, pp. 1598–1604, 1997. [8] M. Martínez-Corral, B. Javidi, R. Martínez Cuenca, and G. Saavedra, “Formation of real, orthoscopic integral images by smart pixel mapping,” Opt. Expr., vol. 13, pp. 9175–9180, 2005. [9] B. Javidi and F. Okano, Three-Dimensional Television, Video, and Display Technologies. New York: Springer, 2002. [10] S. Manolache, M. McCormick, and S. Y. Kung, “Hierarchical adaptive regularization method for depth extraction from planar recording of 3-D-integral images,” in Proc. ICASSP, 2001, vol. 3, pp. 1433–1436. [11] S. Manolache and S. Y. Kung, “A Aggoun and M McCormick “3-Dobject space reconstruction from planar recorded data of 3-D-integral images”,” J. VLSI Signal Process. Syst. for Signal, Image, and Video Technol., vol. 35, no. 5, pp. 18–35, 2003. [12] Y. Frauel and B. Javidi, “Digital three-dimensional correlation by use of computer reconstructed integral imaging,” Appl. Opt., vol. 41, pp. 5488–5496, 2002. [13] C. Wu, A. Aggoun, M. McCormick, and S. Y. Kung, “Depth extraction from unidirectional integral image using a modified multi-baseline technique,” Proc. SPIE, vol. 4660, pp. 135–143, 2002. [14] H. Arimoto and B. Javidi, “Integral three-dimensional imaging with digital reconstruction,” Opt. Lett., vol. 26, no. 3, pp. 157–159, 2001. [15] J. Park, S. Jung, H. Choi, and B. Lee, “A novel depth extraction algorithm incorporating a lens array and a camera by reassembling pixel columns of elemental images,” Proc. SPIE, vol. 4929, pp. 49–58, 2002. [16] J. Park, S. Jung, H. Choi, Y. Kim, and B. Lee, “Depth extraction by use of a rectangular lens array and one-dimensional elemental image modification,” Appl. Opt., vol. 43, no. 25, pp. 4882–4895, 2004. [17] S. Kishk and B. Javidi, “Improved resolution 3-D object sensing and recognition using time multiplexed computational integral imaging,” Opt. Expr., vol. 11, pp. 3528–3541, 2003. [18] S. Yeom and B. Javidi, “Three-dimensional distortion-tolerant object recognition using integral imaging,” Opt. Expr., vol. 12, pp. 5795–5808. [19] E. Trucco, Introductory Techniques for 3-D Computer Vision. Englewood Cliffs, NJ: Prentice Hall, 1998. [20] M. Okutomi and T. Kanade, “A multiple-baseline stereo,” IEEE Trans. Pattern Anal. Mach. Intell., vol. 15, no. 4, pp. 353–363, Apr. 1993. [21] T. Kanade and M. Okutomi, “A stereo matching algorithm with an adaptive window: Theory and experiment,” in Proc. IEEE Int. Conf. Robot. Autom., Sacramento, CA, 1991, pp. 1088–1095. [22] Y. K. Chen, Y. T. Lin, and S. Y. Kung, “A feature tracking algorithm using neighbourhood relaxation with multi-candidate pre-screen,” in Proc. ICIP(II), 1996, pp. 513–516. [23] J. Huang and H. Liu, “Stereo vision using a microcanonical mean field annealing neural network,” Network: Comput. Neural Syst, pp. 87–104, 1997. [24] F. Dufaux and F. Moscheni, “Motion estimation techniques for digital TV: A review and a new contribution,” Proc. IEEE, no. 6, pp. 857–876, Jun. 1995.
Malcolm McCormick graduated in 1965. Following his graduation, he joined Thomas Firth and John Brown Ltd. as an electrical engineer in the steel industry in 1965 before moving to the University of Sheffield as a lecturer in 1970. He was appointed to a Senior Lectureship at the university before moving to De Montfort University as Head of Electronic and Electrical Engineering in 1990. Subsequently, he was promoted to Head of Research and Postgraduate Studies for the Faculty of Computing and Engineering in 2000. Currently, he k is Managing Director of News Plus Media Technologies where he is seeking to exploit research work in visual image engineering.
Amar Aggoun (M’99) received the “Ingenieur d’Etat” degree in electronic engineering from Ecole Nationale Polytechnique of Algiers (ENPA), Algeria, in 1986 and the Ph.D. degree in compressed video signal processing from Nottingham University, Nottingham, U.K., in 1991. From 1991 to 1993 he was with Nottingham University as a research fellow in digital video signal processing. From 1993 to 2005, he was with De Montfort University, U.K., as a Principle Lecturer in Electronic Engineering. In 2005, he joined the school of Design and Engineering at Brunel University, Uxbridge, U.K., as a Reader in 3-D Imaging Technologies. His current research Interests include computer generation and live capture of 3-D integral images, depth measurement and volumetric data reconstruction from 3-D integral images, 3-D Medical Visualisation, 3-D video coding, computer vision, and real-time digital image processing architectures.
S. Y. Kung (S’74–M’78–SM’84–F’88) received the Ph.D. degree in electrical engineering from Stanford University, Stanford, CA, in 1977. Since 1987, he has been a Professor of Electrical Engineering at Princeton University. His research interests include wireless communication, sensor array processing, spectrum analysis, image processing and recognition, neural networks, signal processing, vlsi array processors, system modelling and identification, multimedia signal processing, and bioinformatic information processing. He has authored more than 300 technical publications and numerous text and reference books. Since 1990, Dr. Kung has served as an Editor-In-Chief of the Journal of VLSI Signal Processing Systems. He was a founding member of IEEE Signal Processing Society’s Technical Committees on VLSI Signal Processing, Machine Learning for Signal Processing, and Multimedia Signal Processing. He was the recipient of IEEE Signal Processing Society’s Technical Achievement Award in 1992 for his contributions on “parallel processing and neural network algorithms for signal processing;” an IEEE Signal Processing Society’s Distinguished Lecturer in 1994; a recipient of 1996 IEEE Signal Processing Society’s Best Paper Award for his work on principal component neural networks; and a recipient of the IEEE Third Millennium Medal in 2000.
ChunHong Wu received the B.Sc. degree in radio physics from NanJing University in 1993 and M.Sc. degree in biophysics from the Graduate School of Chinese Academy of Sciences in 1996, and the Ph.D. degree from De Montfort University, Leicester, U.K., in 2003. She is currently a vice-professor at the University of Science and Technology, Beijing, China. Her current research interests include image processing and image analysis, computer vision, 3-D Integral Images, depth measurement, and virtual reality.
Authorized licensed use limited to: Brunel University. Downloaded on October 7, 2008 at 11:46 from IEEE Xplore. Restrictions apply.