ceived distances of the two points (depth) and r ... the hypothesis of Luneburg (1947) that points of constant ..... as the reference point (Blank, 1958). Equation (5') ...
Depth, size and distance in stereoscopic vision I
J. M. FOLEY UNll'ERSITY OF CALIFORNIA. SANTA BARBARA
Evidence is presented to show that in stereoscopic vision a constant ratio of perceived size to perceived distance corresponds to a constant visual angle (the size-distance invariance hypothesis). The functions relating the size! distance ratio to visual angle and the depth!distanc e ratio to disparity are determined for three as using the methods of magnitude estimation and magnitude production. The results for each a may be represented by power functions, the depth; distance function having the higher exponent. These scales are used to predict the outcome of an experiment in which depth is matched to size. The agreement of predictions with results is good for the combined data of the group, but significatlt deviations occur from curves predicted for individual as. An experiment in which an oblique line is matched to a frontal extent yields data consistent with Luneburg's hypothesis that the intrinsic geometry of visual space is non-Euclidean. The indicated curvature is negative for two as and varying from positive to negative for the third. If an a is presented with unfamiliar objects in a situation where secondary cues to distance are
lacking (e .g., an otherwise completely dark room), his [udgments of size and distance are not reliably related to the actual sizes and distances of the objects. It is not simply that such judgments are inaccurate, but rather that their variability, both between and within as, is so large as to make it virtually impossible to establish psychophysical functions. Although neural activity associated with accommodation and convergence potentially contains distance information, which together with visual angle information is sufficient to determine size, this information is not generally, and perhaps cannot be, used to make reliable judgments of size and distance. On the basis of convergence and accommodation alone, many as are not even able to order distances correctly (Gogel, 1961). In the absence of secondary cues, unanalyzed nonstimuIus variables, such as an a's preconception of the range of stimuli that are likely to be presented, appear to exert a major influence on judgments of size and distance. Although in a primary cue situation spatial psychological magnitudes tend to be independent of the stimulus, it is possible that the relations among such magnitudes are largely stimulus determined. This consideration led to the size/distance invariance hypothesis, which says (in its weak form) that
Perception
s:
Psychoulnsir s , 1968. \'01. 3 (4.\)
the ratio of perceived size to perceived distance is a function of visual angle alone, that is
S'
D' = f l (8),
(1)
where S' stands for perceived size, D' for perceived distance from the 0, and 8 for visual angle. (The interpretation of perceived size and distance will be discussed below.) The hypothesis is often stated in a stronger form which asserts that the size/distance ratio is proportional to visual angle (Gogel, 1964). In either form the relation between two perceptual magnitudes replaces an absolute perceptual magnitude as the dependent variable in the psychophysical relation. Few hypotheses have had a less happy history than the size/distance invariance hypothesis. Instances of its disconfirmation are legion. The literature up to 1960 is reviewed by Epstein, Park, and Casey (1961). Since then, disconfirmations have been reported by Rump (1961), Gogel, Wist, and Harker (1963), Gogel (1964), and others. Nevertheless, there is evidence that the hypothesis holds for monocular vision when all secondary cues are excluded (Over, 1960). No test has been reported when all the primary cues (I.e., accommodation, convergence, and binocular disparity), but no other cues, have been present. Evidence that the hypothesis does hold in such a situation will be reported below. Foley (1967a) suggested that a relation of similar form might hold between the ratio of perceived depth to perceived distance and disparity. Symbolically: (2)
Here D' stands for the perceived distance to the nearer point, d' for the difference between the perceived distances of the two points (depth) and r for the horizontal disparity associated with the two points. SUbsequent work (Foley, 1967b) showed that the disparity corresponding to a constant depth/ distance ratio is not constant, but increases as convergence increases (depth micropsia). This means that the depth/distance ratio is a function of both disparity and convergence, and there is no invariance in the traditional sense. However, if consideration is restricted to a small range of convergence, Equation (2) may be expected to hold at least to a
('om/ri(Jht 19()8, P-"yc!1unumic Juurrzal:·,', Santa liurburu, Cult].
265
good approximation. For such a limited range, one can ask what the function is relating the depth/ distance ratio to disparity. That question will be considered in this paper. Elsewhere it will be shown how the dependence on convergence and the dependence on disparity can be integrated into a single theory. Gogel (1958) presented data on the matching of depth intervals to extents of varying visual angle in a frontal plane. This data is suggestive of a third relation of similar form. Specifically, Gogel's data are consistent with the hypothesis that the ratio of perceived depth to perceived size is a function of the ratio of the disparity to the visual angle subtended by the extent, Le.: d' = f S' 3
(L)8
(3)
The same qualification that applies to Equation (2) also applies here. The ratio of disparity to visual angle corresponding to a constant depth/size ratio increases as convergence increases (Foley, 1967b). Here again, however, we will be concerned with a restricted range of convergence within which the influence of convergence is assumed to be minimal. Up to this point, some ambiguity has existed about the definitions of perceived size and distance. Judging by the sorts of experiments done to test the size/distance invariance hypothesis, size has generally been interpreted as the size of an object in a frontal plane and distance as the perpendicular distance to that plane. On the other hand, Foley (1967a), hypothesizing the relation between depth/ distance ratio and disparity, interpreted distance as radial distance. This interpretation is based on the hypothesis of Luneburg (1947) that points of constant convergence angle are perceived as radially equidistant. The choice between these two interpretations of perceived distance hinges on the validity of this hypothesis. If the locus of constant convergence angle corresponds to the equal radial distance, then this is the preferred measure. On the other hand, if the locus of constant convergence angle corresponds to equal perpendicular distance (Le ., to an apparent frontoparallel plane) as has often been proposed (Ogle, 1950), then perpendicular distance is the preferred measure. The matter is still in doubt. Although Foley (1966) found the locus of perceived equidistance to lie outside the locus of constant convergence angle when lights are presented in real depth, preliminary experiments with stereoscopic presentation indicate the reverse. Shipley (1959) found the reverse in real depth. It may be that when all but primary cues have been excluded, as typically they have not been, the old frontoparallel plane hypothesis wnl be found to be most nearly correct. This issue will not be taken up here. It will be skirted by keeping all stimuli relatively 266
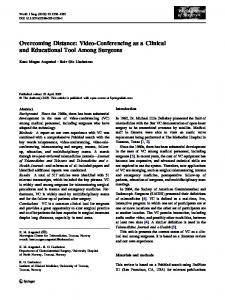
close to the median plane where radial distance and perpendicular distance are very nearly the same. Where the wrong choice of measure may have contributed to an inaccuracy of predictions, this will be noted. If Equations (I), (2), and (3) hold, a strong constraint is placed on the three functions f1, f2' and f3. These functions must all be power functions with the same exponent (Foley, 1967a).2 The principal purpose of the present study is to examine the implications of this argument and, should it be found inadequate, to propose a revision. The procedure consists first of attempting to establish the functions f1 and f2 to see if they are power functions with the same exponent. Since it turns out that they are power functions with different exponents, it is concluded that Equation (3) must be incorrect and an alternative is derived from f1 and f2. An attempt is then made to verify this alternative in an experiment in which depth is matched to size. Method The apparatus used was a polarization stereoscope (Foley, 1964, 1967a, b). This instrument presents a three-dimensional configuration of small, pointlike sources (opthalmoscope bulbs) to the O. Each point is simulated by a pair of horizontally separated bulbs, one member of which is visible to each eye as shown in Fig. 1. The stereoscopic presentation is achieved by means of properly oriented pieces of Polaroid film, one in front of each bulb and one F
PLANE OF STEREOSCOPE
IlIINT lYE
Fig. 1. Schematic illustration of the polarization stereoscope as seen from above. The stereoscopic lights are designated by open circles; the simulated lights by filled circles. The Polaroids are represented by lined rectangles.
Perception & Psychophysics, 1968, Vol. 3 (4A)
in front of each eye. The bulbs are in a frontal plane at a distance of 2 m except where otherwise noted. Points behind this plane are simulated by using uncrossed Polaroids as shown; points in front of the plane are simulated by crossing the Polaroids. The simulated distance of a point is varied by changing the horizontal separation of the two lights. This separation can be varied continuously by 0 or E. Each has a pair of buttons which control a reversible motor (60 rpm); the motor drives a screw (40 threads/In.) that moves the lights together or apart. The direction of a point is varied by sliding the pair of lights left or right along the horizontal bar on which they are mounted. This is done manually by the E in response to button-produced visual signals controlled by the 0, but visible only to the E. In the experiments reported here all lights were in the horizontal eye-level plane with the exception of a single reference light in the size-distance experiments. The field is completely dark except for the lights. These are about 2 log units above foveal threshold and are matched for brightness. The O's position is dimly illuminated between trials so that he maintains a relatively constant state of light adaptation. He is allowed to make slight adjustments in the intensity of the lights so as to keep them clearly visible, but not so bright as to illuminate their surroundings. The O's head is held fixed by means of a bite. In the studies reported here, free eye movement was allowed throughout. The same three Os were used in all the experiments reported here. TWO, Band P, had acuity of better than 1 min and stereoacuity of better than 30 sec, uncorrected (as measured by Keystone Orthoscope tests). The third, F, wore contact lenses and met these same standards with the correction. All were experienced in this type of experiment. Certain features of the procedure were constant for all the experiments to be reported, and these will be mentioned here. Each experiment required 8-10 1 h sessions for each O. A practice session was given when each new task was introduced. Conditions and stimuli were presented in random order, except that where each condition required a different setting of the fixed light a block of 5-8 trials was conducted at that condition before moving to the next. All data points are based on the mean of at least 40 trials except the magnitude estimates, which are based on 15. The arithmetic mean is given in all cases. Its use, in preference to the frequently used geometric mean, is considered justified by the fact that distributions are approximately symmetrical throughout, with no consistent skewing in either direction. The same analysis applied to the medians yields essentially the same result. All curves were fitted to satisfy the least squares criterion with respect to the untransformed data.
Pr-rceptinn &: Psychophysics, 1968, Vol. 3 ('1M
This was accomplished by iterative computer programs which sought those parameter values which minimized the sum of the squared deviations of data points from the fitted function. It is more common to transform the data so as to render the function linear, then fit the transformed data. This latter procedure has the effect of weighting points near the origin more than others in making the fit. This is appropriate in cases where the variance varies with the mean in such a way that the transformed data have approximately equal variance at each point. Here, however, the transformation often leaves the variances more unequal than they were to start with. As a consequence, it was decided to weight all points equally by applying the least squares criterion to the untransformed data. Size/Distance Ratio as a Function of Visual Angle The first experiment was a test of the size/distance invariance hypothesis (Eq. (1». The basic idea of the test was that if an 0 adjusted a frontal extent until its size was equal to one-half the distance from himself to the extent, then the visual angle subtended by the extent should be independent of its distance. Two lights in the same frontal plane were presented on each trial (see insert, Fig. 2). One light, A, was in the median plane and the other, B, to the right of it. The O's task was to move B left or right until the distance AB was perceived to equal 1/2 the distance OA from the 0 to A. The size/distance ratio 1/2 was chosen over the ratio of 1/1 (Le., a size-distance match) because the latter ratio brought the settings quite close to the end of the range of the apparatus. The independent variable was the simulated distance to A. This was measured in terms of the convergence angle (Yf in Fig. 1) at A. The prediction is borne out by the results, which are presented in Fig. 2. Observer F did not partici-
16 14
12 C)
e'O , ~8 ,
C)
Z
«6
C'
-J
Ar--4
s
OBSERVER B OBSERVER P
6
(j)
2 0
50
o
50
100
150
200
250
CONVERGENCE ANGLE (MIN.) Fig, 2, Visual,anglp as a function or convergence angle for a size 'drstance ratio or 1 2. (N'IOI.
267
r d'
1
: s'
B
c
:, ,
/~\ ~s'~
b lAI SIZE I DISTANCE TASK
IS} DEPTH/DISTANCE
(0) EQUILATERAL
(C) DEPTH/SIZE
TASK
B
,
,,, 6 TRIANGLE
TASK
TASK
Fig. 3. Illustration or the (our experimental tasks employed in this study viewed (rom ahove. 0 indicates the position ot the observer.
pate in this experiment. No trend is evident in the data over the range examined, which corresponds to a range of about 1 m to beyond simulated infinity. A slight increase in visual angle with convergence might have been expected as a consequence of size micropsia (Heinemann, Tulving, & Nachmias, 1959; Foley, 1967b). This effect is apparently too small to be evident in these data. The slightly irregular spacing of the points is a consequence of the fact that the stereoscope frame was first set at 118 em when the settings for points outside the frame (uncrossed Polaroids) were made. Then the frame was moved to 2 m and settings for points inside the frame (crossed Polaroids) were made. Only in this way is it possible to avoid a gap in the center of the range because the minimum separation of the lights is 1.2 em. The fact that the two sets of data fit well together, in spite of the two weeks that intervened between the two experiments, is evidence for the stability of these settings. It is likely that some would not consider it a proper test of the size/distance invariance hypothesis unless perceived size and distance were made to vary. To insure that this would be the case a third light, C, was present on every trial. This light was in the same position throughout (in the median plane, 2.50 below the eye level plane, and with a convergence angle of approximately -60 min). Verbal estimates of the distance to A in feet decreased with convergence from 5.2 to 1.6 for Observer B and from 4.2 to 1.9 for P. The next step was to determine how the size/ distance ratio depended on visual angle. The methods of magnitude estimation and magnitude production were used to determine this function. The configuration of lights was exactly the same as in the experiment just reported, except that the light
in the median plane and the light to the right of it were single real lights rather than stereoscopic pairs (see Fig. 3a). This increased the range of the size variable at both ends and made it possible for two of the Os to set size/distance ratios of I, t.e., to match size with distance. In the estimation task the 0 gave a numerical estimate of the ratio of perceived size to perceived distance. In the production task he was given a ratio and asked to adjust the size by moving the light on the right until the size/distance ratio corresponded to the one given. The production and estimation data were obtained in separate experiments, the production experiment being run first. The results are given in Fig. 4. standard deviation increased with mean estimate in the estimation task (range: .015 to .072) and with visual angle in the production task (range: .5 to 2.7 0 ) . The data are plotted on log-log coordinates. The graphs are approximately linear in every case indicating that the data can be well fitted by power functions. The straight lines fitted to the data are power functions of the form (4)
On the log-log plot the fitted lines sometimes appear not to be the lines of best fit. This is a consequence of the fact that when the log-log transformation is made, deviations at small values of S'iD' are exaggerated relative to deviations at large values. The two methods are seen to yield slightly different results, but the usual finding of a greater slope in the production task (Stevens & Guirao, 1962) is borne out only for Observer F. The same function was fitted to the combined data from the two tasks. Values of the parameters P and K are given in Table 1. In all three cases the exponent P is greater than 1. Depth/Distance Ratio as a Function of Disparity The same two methods were used to study the relation between the depth/distance ratio and disparity. Two lights were present on each trial, one in the median plane, A, and the other 60 to the right of this, B (see Fig. 3b). B was fixed throughout both
1.0 OBSERVER B
OBSERVER F
.7
~>
7'
ESTIMATION ••• PROOUCTION 00'--
.3
/
/
oj,
.2
I 5
10
20
5
.
.0/
/
/
10
2'0
VISUAL ANGLE (DEGREES) 268
-------,--20-
-5"
Fig. 4. Size/distance ratio as a (unction of visual angle as determined by the methods of magnitude estimation (N~15) and magnitude production (N~48). Perception & Psychophysics, 1968, Vol. 3
(4A)
Table 1. Coefficients and Exponents of Power Functions
Observer
P
F
B
P
K
K
P
K
P
s izevd i stance (combined data)
.01229 1.498
.00908 1.497
.03320 1.133
depth 'distance (combined data)
00102 1.769
.00055 1.985
.00496 1.392
depth 'size (predicted)'
4075
.847
4.080
.754
3.920
.814
depth 'size (obtained)
8335
612
3.538
.80?
4.349
.851
• Predictions ll'ere made by substitutino P t- P 2' K l: and K 2 in equation (7) for each observer
experiments. The convergence angles were 85, 89, and 77 min for Observers B, F, and P, respectively. The different convergence angles are a consequence of different interpupillary distances, the separation of the stereoscopic light pair being held constant. In the estimation task the center light was set behind the light on the right, and the task was to estimate the ratio of the perceived distance to the far light to the perceived distance to the near light. This ratio was converted to the depth/distance ratio by subtracting 1. In the production task, the center light was variable, and the 0 set it behind the fixed light so that the ratio of the two perceived distances had a specified value. Again the production and estimation data were obtained in different experiments, the production experiment being conducted first. The results are presented in Fig. 5. Standard deviation increased with mean estimate in the estimation task (range: .017 to .466) and with disparity in the production task (range: 3.9 to 9.91 min). Here again the relations are approximately linear when plotted on log-log coordinates. The slope is greater in the production task than in the estimation task for Observers Band P. The explanation of the fairly large deviation between the results of the two methods for Observer F is unknown. Functions of the form:
d' D'
P
-=K 1 2
(5)
2
were fitted to each set of data. (As a consequence of aniseikonia 1 = 0 does not in general correspond to d'/D' = O. Consequently a power function with an
added constant was fitted to the data first, then each value of d'/D' corrected by SUbtracting the 1-intercept before fitting Equation (5». The straight lines represent the best fitting function for each set of data. Functions of this form were also fitted to the combined data. The values of K2 and P2 obtained from the combined data are given in Table 1. Although the power function handles these data reasonably well, the question of the form of the function relating depth/distance ratio and disparity deserves more careful scrutiny. The reason is that there is a logical consideration which suggests that an exponential function of the form:
~ = eQ1 - 1
(5')
D'
is to be preferred. The reason why the exponential function is preferable becomes clear when we consider a configuration in which there are three or more points at different distances. If there is a single relation which gives the relative distance of any pair of points in the configuration as a function of their disparity, then that relation must be of form (5'). This is shown as follows: Let Dl > D2 > D3 be the distances to three points. Di Let D. = f(lji) be the function relating relaJ
tive distance to disparity (i < D1'
D2'
D1'
D2'
D3'
D3'
n. Since:
but 131 = 121 + 131 therefore: f(121) . f(132) = f(121 - 132)· It follows that: D'· _1 = eQ1 (see Bellman, 1965, p.499), or D'. J
~ = eQ1 - 1 since d'=D'. -D'· D' ' 1 J If Equation (5') does not hold, then no single func-
5.0
OBSERVER P
OBSERVER B ! 2.0
d'
or
1.0 .5
y
.2 /
/
/
05 . /
10
50
10
20
50
DISPARITY (MINUTES)
Perception & Psychophvsfr s. 1968. vet. 3 (4.\)
10
20
Fig. 5. Depth distance ratio as a function of disparity as detennined b)' the methods of magnitude estimation IN~15) and magnitude production(N~48). 269
tion relates the relative distance of each pair of points to its disparity. It may be that all relative distances are determined by the disparity between each point and some reference point. This raises many questions, such as what determines the reference point and what is the function (Foley, 1967a). Experiments done in the context of the Luneburg theory suggest that Equation (5') does not hold and that the farthest point in the configuration serves as the reference point (Blank, 1958). Equation (5') was fitted to each of the six sets of data and the sums of squared deviations compared with those obtained in fitting the power function. In every case the least sum of squares was substantially greater for the exponential function, indicating that the power function provides the better fit. For this reason we will take Equation (5) as descriptive of these data. For each of the three Os the exponent P2 for the depth/distance task is substantially greater than the exponent PI for the size/distance task. This is inconsistent with the theory sketched in the introduction and suggests that Equation (3), the strongest and least examined of the hypotheses, is incorrect. From Equations (4) and (5) we have, instead of (3): K
r P2
d' - -2- -
S'
Kl
P
e.
(6)
1
Depth-Size Matches An attempt was made to verify Equation (6), independently, by an experiment in which an 0 matched depth intervals to frontal extents of varying visual angle. If depth is matched to size, d'/S' = 1 and: /P
r. (::)'
2
,p, / P 2
(7)
The argument is formally the same as that for cross-modality matching (Stevens, 1966). The difference is that here the matches are intramodality matches, between two dimensions in the same modality. Further, the coefficients are not arbitrary since the unit of psychological magnitude on which
the scales are based is the same for both dimensions. It is the perceived distance to the frontal plane. It follows that theoretically both coefficient and exponent of the function relating disparity to visual angle in the depth-size match should be predictable from the scales for size/distance and depth/distance just described. Two lights were present on each trial, one in the median plane, A, and one to the O's right of the first, B (see Fig. 3c). B was fixed on each trial at 6, 11, or 160 from the median plane. A was variable in depth. Here the task was to set A as far behind the frontal plane containing B as B was to the right of the direction of A. The task was a difficult one because the 0 was matching two segments each of which had one endpoint which was not physically present (the intersection between the frontoparallel line through B and the line from the 0 to A). It is impossible to set a light here because it would be directly in front of A. The difficulty of the task is reflected by the high variability of the settings, especially at the larger angles. Standard deviations ranged from 2.45 to 12.60 min, increasing with visual angle. The mean settings are presented in Fig. 6. The solid lines in Fig. 6 represent the function predicted from the size/distance and depth/distance scales for each O. It is clear that the data differ significantly from predicted values, especially for Observers Band P. However, several respects in which the data agree with the predictions should be noted: (1) Each relation is approximately linear on log-log coordinates, as would be expected if the relation is a power function. (2) All three slopes are less than 1. This is consistent with the finding that the exponent for the depth/distance scale is greater than the exponent for the size/distance scale. Power' functions were fitted to the obtained data and the parameter values are given in Table 1. (3) The functions lie in the predicted order with respect to the disparity axis, Observer B highest, then P, then F. (4) Exponents are predicted to within ±.05 and coefficients to within ±.6 for Observers F and P. Several factors may have contributed to the discrepancies between the predictions and results in
40
z
:is
-
>to::
50
~ Q.
~
20
o
II
OlSERVER F
OlSERVER I •
I
10
II
is
liD
OlSERVER P
iii
VISuAL ANGLE (DEGREES)
no
is
Fig. 6. Mean disparity as a function of visual angle in depth-size matching task. Straight lines indicate the function predicted trom the size/distance and depth/distance scales (N=45). Perception & Psychophysics, 1968, Vol. 3 (4A)
this experiment. One is the difficulty of the task which is evidenced by the relatively high variability of the settings. Other factors are the several weeks which passed between the scaling tasks and the matching task, and the failure to correct for the noncorrespondence of the apparent frontoparallel plane with the locus of constant convergence angle. To see if these last two factors could account for the discrepancies, the experiment was replicated with three new Os and some refinements in design. Each of the Os estimated size/distance ratios, estimated depth/distance ratios, and matched depth to size at every session, the order of tasks varying from session to session. In addition, for each of the five visual angles used in the depthsize matching task, the 0 set the light in the median plane, A, so that it was perceived to be in the same frontal plane as the peripheral light, B. These settings were used to correct the disparities in the other tasks. Since the number of conditions in this experiment was large, each condition occurred only once at each session. There were 10 sessions. The size/distance and depth/distance functions came out essentially as before. They were power functions with exponents greater than 1. The depth/ distance exponent was greater than the size/distance exponent in every case. In spite of the changes in design, the depth-size matches again deviated from predictions by substantial amounts. However, in the discrepancies obtained for all six Os no consistent trend is evident. For three Os the data points lie above the predicted line and, for the other three, they lie below it. This suggests that if the data from different Os is combined, good agreement with prediction might be obtained. It is impossible to average the scaling data because different values of the independent variables were used with different Os. Therefore, the predicted depth-size match was calculated separately for each 0, and these predicted lines averaged to yield a predicted line for the group. For the same reason, it was impossible to average depthsize matches across Os , Consequently a line was fitted to the data of each 0, and these fitted lines were averaged to yield an obtained line for the group. These two lines are shown in Fig. 7. Considering that both slope and intercept are predicted here and that the variability is relatively high, the fit is about as good as might be expected. It appears that the scales predict the matches on the average, but that in individual cases a transformation of random magnitude intervenes in going from one type of task to the other. The Intrinsic GeDmetry of Visual Space It might appear that an experiment in which an oblique line is matched to a frontal extent would provide a simple alternative to the depth-size match
Perception &I Psychophysic's, 1968, Vol. 3 (4A)
30
Z
20
,
"....
,/
>-
'"
«
/ / / /
10 ,,/"/
11.
'" o
,
/
/ ------- PREOICTED --OBTAINED
2
3
VISUAL
10
ANGLE
IS
(OEG.)
Fig. 7. Solid line represents group mean disparity (average of points on fitted curves) as a function of visual angle in depth-size matching task. Dashed line represents the average of the functions predicted from the size/distance and depth/distance scales for the six observers.
as a means of verifying the size/distance and depth/ distance scales. This would avoid the problem of having one point directly behind another. The equilateral triangle experiment illustrated in Fig. 3d is such an experiment. Here the 0 moves light A in depth until the distance h' from A to B equals the distance 2S' from B to C. The analysis of this experiment, however, is complicated by the fact that it depends on the intrinsic geometry of the visual space. If the geometry is Euclidean then:
by the Pythagorean theorem. Since h' = 2S', we have d'/S' = J3: The predicted relation between disparity and the visual angle (corresponding to S') is then:
r =
0~)'/P2 ,p./P2
(7)
Expected disparity is directly proportional to disparity in the depth-size match, the constant of proportionality being (/3 )1/P2. If the geometry is hyperbolic (i.e., of constant negative curvature) as Luneburg (1947, 1950) and Blank (1959) have hypothesized, then the equation:
COSh(~) = cosh(f) COSh(~') replaces the Pythagorean theorem. Here k is a parameter which depends on the curvature of the space. Expressing the hyperbolic cosine in terms of its Maclaurin expansion and giving only the first three terms, this yields:
271
'f
1
d'
n Y f
J
Sf
"8
(8)
dY
where C is an individual constant, and Y nand Yf the convergence angles at the near and far ends of the depth interval. In order to apply this equation, it is necessary to know or assume the function Sf/ 8 = f (Y). In several applications Gogel (1960a, b,
It follows that:
and if h'
=C
= 2S 9 ,
e; 1964) has used the function 8'/8 = k (i/V)n, where
If the geometry is hyperbolic the disparity required to match h' to 2S' will be less then predicted by Equation (7). By a similar argument it can be shown that if the space is elliptic (Le., of constant positive curvature), the disparity will be greater than predicted by Equation (7). The equilateral triangle experiment was carried out using the same three Os as in the other experiments. The frame was set at 3 m and the lights Band C were single real lights. Otherwise the procedure was the same as in the other experiments. The results are given in Fig. 8. The solid lines represent the function predicted from the depthsize matches and P2 on the assumption that the geometry is Euclidean (Equation (7)).3 For Observer P all the, points lie below the line as predicted by the hyperbolic geometry hypothesis. The same is true for Observer B except for one point. The data for Observer F suggest that the curvature is not constant, passing from positive to negative as the size of the configuration increases. Here again standard deviation increased with visual angle (range: 1.93 to 9.58 min). Discussion Although Gogel (1958) did the experiment on which the depth-size hypothesis (Equation (3» was based, he did not consider this relation to hold, except for small values of disparity. On the basis of considerations which arise when one considers configurations with more than one disparity (considerations similar to those which led to the consideration of the exponential form for the depth/distance scale). Gogel favored the following hypothesis:
OBSERVER F
08SERVEIl P
/ 10
5
.7
10
VISUAL ANGLE (DEGREES)
Fig. 8. Mean disparity as a function of visual angle in equilateral triangle task. Straight lines indicate the function predicted from the depth-size matches and P2 on the assumption that the visual space is Euclidean. (N=49). 272
i is the interpupillary distance I and k and n are constants (n::: 0). This function is not appropriate for stereoscopic visual space because for n > 0 (which it is since svs increases with distance) the function requires that sve go to infinity as " goes to O. It is quite easy to realize this situation with the stereoscope, and at Y = 0, sve is clearly finite. An examination of the data on equidistant alleys (Indow et al, 1962; Zajaczkowska, 1956) suggests that for stereoscopic vision a function of the form S'/8 = Ke-a'Y, where k and a are constants, would be appropriate. Substituting this function in Equation (8) and dividing both sides by Sf, one obtains: n d' 1 JY e-aY dY S' - C8e-aYn Y f
Setting d'/S'
r
=1 1
= ;:
and integrating:
In (C a e + 1)
(9)
Not knowing the values of C and a for Observers B, F, and P, it is impossible to decide on the basis of the depth-size matching data between this formulation and that represented by Equation (7) Both are consistent with the obtained concave downward shape of the function relating r to e. Gogel has demonstrated the predictive power of Equation (8) in several experiments. For example, he has shown that the linear increase in physical depth with physical distance obtained when depth intervals are matched to frontal extents of constant physical size follows from this equation together with the assumption 8'/e = K (l/V)n (Gogel, 1960b). He also matched depth intervals at different distances with each other and found that the physical depth interval increased proportionally with physical distance. This finding also follows from his development (Gogel, 1960c). Neither of these findings is predicted by Equation (6) except in the special case where PI = P2. It does follow in this case if it is assumed that Equation (6) applies only for disparities between a frontal extent and the point adjacent in depth. The situation in these experiments differed in two respects from that in which Equation (6) was developed: (1) A variety of cues to absolute distance was present: (2) More than one disparity was present in the configuration. This suggests that Gogel '8 G
Perception & Psychophysics, 1968. Vol. 3 (4A)
formulation may be applicable to a greater variety of experimental situations. However, as it presently st.inds , the theory makes no provision for the relations between size/distance ratio and visual angle, an I between depth/distance ratio and disparity which obtain when primary cues alone are present. The author does not regard the results of the equilateral triangle experiment as definitive with respect to the curvature of visual space for these Os, particularly Observer F. The results do, however, illustrate a method for determining the intrinsic geometry of visual space which offers certain advantages over some of those used in the past, such as the alley and double-crrcumhoropter experiments (Zajaczkowska, 1956; Blank, 1958; Indow et al , 1962). The advantage over the first is the unambiguity of the instructions and the few lights in the field. Lights are known to interact with one another spatially in ways that are not yet understood. Consequently the fewer the lights involved, and the more widely separated, the better. The advantage over the double-circumhoropter experiment is that no assumption is made about the perceived size of visual angles. The assumption that the perceived size of visual angles corresponds to their physical size (Blank, 1958) remains a problem. Data derived from scaling methods (Foley, 1965) indicate that the assumption is approximately correct, with fairly large individual differences and with most Os showing a tendency to overestimate angles somewhat Distance, however, was not a variable in that study. In the data reported here as evidence for the size/distance invariance hypothesis (the first exper-iment] there is evidence that the perceived size of visual angles varies with distance. This conclusion follows because there are no similar triangles in a non-Euclidean space. Since the triangles constructed here have corresponding sides proportional, they must have unequal angles. In particular, if the geometry is hyperbolic the perceived angles will decrease in size as the perceived size of the triangle increases. The size/distance data also have implications for the intrinsic geometry of the space. It will be noted in Figs. 2 and 4 that the visual angles associated with the various ratios of size to distance are much smaller than they would be if size and distance were matched physically. For example, when S'iD' = 1 a physical match would require that the visual angle be 45 0 • Actually, it is about 20 0 . What is critical, of course, is not the physical st. e of this angle, but its perceived size. Therefore, at the end of the experiment, each 0 was asked to consider the perceived size of this angle. All agre-ed that it was substantially less than 45 0 • Looked at in this way the experiment corresponds to Blank's isosceles triangle experiment (1958), and the result is evidence that the curvature of visual space is negative for all three Os. Percopuon I\: Psychophysics, 191ill, '01. 3101..\ )
Since the use of the methods of magnitude estimation and production remains controversial (Stevens, 1966; Graham, 1966; Garner & Creelman, 1967), a comment is in order concerning their use here. The hypothesis that a particular correspondence between numbers and stimuli constitutes an interval scale of measurement is, at least in many cases, a testable hypothesis. Its validity or invalidity is completely independent of the source of the correspondence. The depth-size matching experiment reported above constitutes a test of this hypothesis for the size/distance and depth/distance scales. Here some of the implications of the hypothesis were verified, others not. On the other hand, if these scales indicate only ordinal relations among the psychological magnitudes, the results are extremely unlikely. This suggests that the scales are intermediate between ordinal and interval scales. As SUCh, they provide an approximation to the "true" psychological scales. Undoubtedly they can be improved upon, just as classical measures of the threshold have been improved upon by taking response biases into account. It is clear that response biases are present in matching and estimation experiments as well. But just as many conclusions drawn with classical threshold measures remain valid today, it is likely that conclusions drawn with the present relatively crude scaling techniques will remain valid when more refined techniques are introduced. The author does not interpret the large individual differences in the parameters of these scales as necessarily reflecting large differences in perceptual processes from one 0 to the next. Considering the high degree of interSUbjective consistency with respect to established psychophysical functions, it seems likely that the large individual differences are introduced in response processes rather than perceptual ones. In this connection it is interesting to note that there is much less interobserver variability in both the predicted and the obtained depthsize matches than in the scales themselves. This is a consequence of the fact that the ratio of the size/distance exponent to the depth/distance exponent, and the ratio of the two coefficients as well, are relatively constant across Os. This finding is consistent with the hypothesis that the relation between psychological magnitude (here conceived as the magnitude of a hypothetical internal perceptual event) and the overt response is itself a power function, the exponent differing from 0 to 0, but constant for each 0 across different continua, The finding is also consistent, however, with the hypothesis that different parameters represent true perceptual differences, differences which are highly correlated across continua. In either interpretation, relative differences in scale parameters indicate relative differences in the underlying psychophysical processes. Consequently, it is considered justified to
conclude on the basis of these experiments that the depth/distance ratio increases more rapidly as a function of disparity than does size/distance ratio as a function of visual angle.
References Bellman, R. Functional equations. In D. Luce, R. Bush. & E. Galanter (Eds.), Handbook ot mathematical psychology, Vol. 3. New York: Wiley, 1965. Pp. 487-513. Blank, A. A. Analysis of experiments in binocular space perception. J. opt. Soc. Amer., 1958, 48, 911-925. Blank, A. A. The Luneburg theory of binocular space perception. In S. Koch (Ed.), Psychology: A study ot a science. New York: McGraw-Hill, 1959. Pp. 395-426. Foley, J. M. Desarguesian property in visual space. J. opt. Soc. Amer., 1964, 54, 684-692. Foley, J. M. Visual space: A scale of perceived relative direction. Proc. Amer. Psycho/' Assn., 1965, 1, 49-50. Foley, J. M. Locus of percei ved equidistance as a function of viewing distance. J. Opt Soc Amer., 1966. 56. 822-827. Foley, J. M. Binocular disparity and perceived relative distance: An examination of two bypotheses. Vis. Res., 1967a, 7, 655-670. Foley, J. M. Disparity increase with convergence for constant perceptual criteria. Percept. & Psychophys., 1967b, 2, 605-608. Gamer, W. R., & Creelman, C. D. Problems and metbods of psvchological scaling. In H. Helson & W. Bevan (Eds.), Contemporary approaches to psychology. Van Nostrand, 1967. Pp. 1-34. Graham, C. H. Who makes the measurements-the subject or the experimenter? J. opt. Soc. Amer., 1966, 56, 1408-1409. Gogel, W. C. The effect of convergence and angular size upon the computed value of a hypothetical observer constant in binocular vision. U. S. Army Medical Research Laboratory, Fort Knox, Kentucky, Report No. 372, 1958. Gogel, W. C. Perceived frontal size as a determiner of perceived binocular depth. J. Psychol., 1960a, 50, 119-131. Gogel, W. C. The perception of shape from binocular disparity cues. J. Psuchol.., 1960b, 50, 179-192. Gogel, W. C. The perception of a depth interval with binocular disparity cues. J. Psycho/., 1960c, 50, 257-269. Gogel, W. C. Convergence as a cue to absolute distance. J. Psychol., 1961, 52, 287-301. Gogel, W. C. Perception of depth from binocular disparity. J. expo Psuchol., 1964a, 67, 379-386. Gogel, W. C. Visual perception of spatial extent. J. opt. Soc. Amer., 1964b, 54, 411-416. Gogel, W. C., Wist, E. R., & Harker, G. S. A test of the invariance of the ratio of perceived size to perceived distance. Amer. J. Psychol., 1963, 76, 537-553. Heinemann, KG., Tulving, K, & Nachmias, J. The effect of oculomotor adjustments on apparent size. Amer. J. Ps ucliol., 1959, 72, 32--45. In dow, T., Inoue, K, & Matsushima, K. An experimental study of the Luneburg the ory of binocular space perception (2). The alley experiments. Jap. Psucttol, Res., 1962, 4, 17-24. Luneburg, R. K. The metric of binocular visual space. J. opt. Soc. Amer., 1950, 40, 627-642.
274
Luneburg, R. K. Mathematical analysis ot binocular vision. Princeton University Press. 1947. Ogle, K. N. Researches in binocular rision, Saunders. 1950. Over, R. Size and distance judgments under reduction condit ions. Austra/. J. Psuchot., 1960. 12. 162-168. Rump, E. K The relationship between perceived size and perceived distance. Brit. J. Psycho/., 1961. 52, 111-124. Shipley, T. An experimental study of the frontal reference curves of binocular visual space. Doc. Optha/., 1959, 15. 321-350. Stevens, S. S. Matching functions between loudness and ten other continua. Percept. & Psychophys., 1966, 1, 5-8. Stevens, S. S. Concerning the measurement of brightness. J. opt. Soc. Amer., 1966, 56, 1135-1136. Stevens, S. S., & Guirao, M. Loudness, reciprocality, and partition scales. J. Acoust. Soc. Amer., 1962,34, 1466-1471. Zajaczkowska, A. Experimental test of Luneburg's theory. Horopter and alley experiments. J. opt. Soc. Amer .. 1956, 46. 514-527.
Notes 1. This research was supported by U. S. Public Health Service Grant MH 08878 from the National Institute of Mental Health. The author is grateful to Walter Thode for his assistance in conducting and analyzing these experiments, and to Dr. A. A. Blank and Dr. W. C. Gogel for their reading of the manuscript. 2. The proof is as follows: From Equations (1), (2), and (3):
£)
12 (r) = t /
11 (0) 3\0 Assuming f l, f 2, and f 3 are non-zero and differentiable, and taking logarithms of both sides: ( ) (4) log 12 (I") - log 11 (0) = log 13
f
Differentiating (4) with respect to I" and with respect to 0 and eliminating log f 3 (r/o) from the resulting two equations yields: rd (log 1'2 (r)) _ Od (log 11 (0))
d"r
- de
,.0.
Since in general I" this equation can hold only if both sides equal the same constant K:
~(Iog 1'2 (r)) = ~
~ (log 11 (0)) = ~
ar
dO
r
Integrating and then taking antilogs: 1 (r) = (2rK
2
3 1
0
11 (0) = (10K
(:)=~~~y
3. Predictions could have been made from the size/distance depth/distance scales directly. However, since these scales dict the depth-size matches only very roughly, and since depth-size task is more similar to the equilateral triangle task, depth-size data were used to make these predictions.
and prethe the
(Accepted tor publication December 7 1967)
Perception & Psychophysics, 1968, Vol. 3 (4A)