Microsoft Excel is widely used to analyse and graph financial data. ... how to
customise Excel to the needs of a particular individual or company and enhance
the ...
Derivative Pricing within Microsoft Excel By George Levy Microsoft Excel is widely used to analyse and graph financial data. The purpose of this article is to show how to customise Excel to the needs of a particular individual or company and enhance the power of Excel for financial analysis. We illustrate the use of a Visual Basic routine to evaluate an option's value that depends on the value of one underlying asset. We then discuss the use of other routines called within Excel to evaluate an option's value that depends on the values of multiple underlying assets.
One Underlying Value We begin by showing how the Visual Basic within Excel can be used to create powerful derivative pricing applications. We will first explain how Excel's Visual Basic can be used to create an application that prices a selection of simple European put and call options at the press of a button. _
The value of a call option is
Vc = e − rT E[max(S T − X ),0] while the value of a put is
_
V p = e −rT E[max( X − S T ),0] . Here X is the strike price, T is the maturity of the option, r is the risk _
free interest rate, operator.
S T is the market value of the asset at maturity and E[] denotes the expectation T
If it is assumed that the value of the asset follows geometric Brownian motion and S has a lognormal distribution the Black-Scholes formula [1] can be used to price the options as follows:
Vc = S 0 N (d1 ) − e − rT X N ( d 2 ), V p = − S 0 N ( −d1 ) + e − rT X N (− d 2 )), where d1 = (log ( S 0 / X ) + (r − σ 2 / 2)T ) /(σ T ), d 2 = d1 − σ and N ( x) =
where
1 2π
x
∫e
− x2 / 2
T
dx
−∞
S 0 is the current value of the asset and σ is the volatility of the asset.
The cumulative standard normal distribution, N (x ) ,can be evaluated in Excel by using the function NORMDIST. The definition of this function is as follows: NORMDIST(x,mean,standard_dev,cumulative) This function returns the normal cumulative distribution for the specified mean and standard deviation. Function parameters: x : is the value for which you want the distribution. mean: is the arithmetic mean of the distribution. standard_dev: is the standard deviation of the distribution. cumulative: is a logical value that determines the form of the function. If cumulative is TRUE, NORMDIST returns the cumulative distribution function; if FALSE, it returns the probability density function.
If mean = 0 and standard_dev = 1, NORMDIST returns the standard normal distribution. This function can be used to create the following Visual Basic function to calculate European option values within Excel. Function bs_opt(S0 As Double, X As Double, sigma As Double, T As Double,_ r As Double, q As Double, putcall As Long) As Double Dim Dim Dim Dim Dim
temp As Double d1 As Double d2 As Double SQT As Double value As Double
temp = Log(S0 / X) d1 = temp + (r - q + (sigma * sigma / 2#)) * T SQT = Sqr(T) d1 = d1 / (sigma * SQT) d2 = d1 - sigma * SQT If (putcall = 0) Then ' a call option value = S0 * Exp(-q * T) * WorksheetFunction.NormDist(d1, 0#, 1#, True) _ - WorksheetFunction.NormDist(d2, 0#, 1#, True) * X * Exp(-r * T) Else ' a put option value = -S0 * Exp(-q * T) * WorksheetFunction.NormDist(-d1, 0#, 1#, True) + _ X * WorksheetFunction.NormDist(-d2, 0#, 1#, True) * Exp(-r * T) End If bs_opt = value End Function
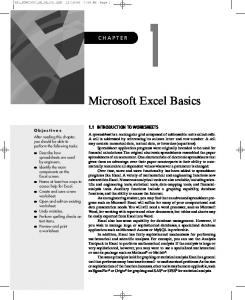
Once the function has been defined it can be accessed interactively using the Paste Function facility within Excel as shown below.
Figure 1 Using the function bs_opt interactively within Excel
The function bs_opt can also be incorporated into other Visual Basic code within Excel. To illustrate, if the following Visual Basic subroutine is defined: Private Sub MANY_EUROPEANS_Click() . . . For i = 1 To 65 S0 = Sheet1.Cells(i + 1, 1).value X = Sheet1.Cells(i + 1, 2).value putcall = Sheet1.Cells(i + 1, 3).value Sheet1.Cells(i + 1, 4).value = bs_opt(S0, X, sigma, T, r, q, putcall) Next i End Sub
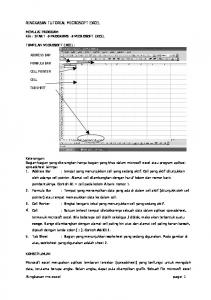
then when the button labelled "CALCULATE OPTIONS" is clicked, the values of 65 European options will be calculated using the data in columns 1-3 on worksheet 1.
Figure 2 Excel worksheet before calculation of the European option values.
Figure 3 Excel worksheet after calculation of the European option values. Multiple Underlying Values The cumulative standard normal distribution can also be used to provide analytic solutions for a range of other exotic options such as: • Barrier options • Exchange options • Lookback options • Binary options It should be mentioned that although the term asset in the Black-Scholes formula was originally taken to mean a particular stock with a value measured in a given currency (say dollars or pounds), it has recently been used in a much broader context. For example the price of weather options, which are used to manage various forms of climatic risk, can be calculated using the Black-Scholes formula [2]. Here the 0
current asset value, S , may (for instance) refer to the current temperature, temperature, r , the mean temperature, etc.
σ the volatility of the
Cumulative standard normal distributions can also be used to provide closed form solutions for rainbow options involving multiple assets. Examples of rainbow call options on two assets are as follows: _
Vc = e − rT E[max(max(S1T , S 2T ) − X ),0]
•
option on maximum of two assets,
•
option on the minimum of two assets,
•
spread option,
•
dual strike option,
•
portfolio option,
_
Vc = e − rT E[max(min(S1T , S 2T ) − X ),0]
_
Vc = e − rT E[max(S1T − S 2T ) − X ),0] _
Vc = e − rT E[max(S1T − X 1 , S 2T − X 2 ),0] _
Vc = e − rT E[max(n1 S1T + n 2 S 2T ) − X ),0]
Here
S1T and S 2T are the values of assets one and two at maturity respectively, and T , r , X and
_
E[] have their usual meanings. The closed form solutions for these options involve terms such as S10 N 2 (d1 , d * , ρ12 ) where d1 = (log ( S10 / X ) + (r + σ 12 / 2) T ) /(σ 1 T ) , d * = (log ( S10 / S 20 ) + (σ 12 / 2) T ) /(σ 1 T ), ρ12 = (σ 1 − ρ σ 2 ) / σ , and σ 2 = σ 1 + σ 2 − 2σ 1σ 2 ρ
S10 and S 20 are the current values of assets one and two respectively, ρ is the correlation between the assets and σ 1 and σ 2 are the volatilities of assets one and two.
Here
The bivariate cumulative standard normal distribution is represented by the term
N 2 ( x, y, ρ12 ) =
y x
1 2π 1 − ρ
∫ ∫e
2 12 − ∞−∞
2 ) − ( x 2 − 2 ρ12 − y 2 ) / 2 (1− ρ12
dx dy
Unfortunately Excel does not provide a function to evaluate the integral N 2 ( x, y , ρ12 ) . This means that software developers are faced with the choice of either writing their own function or using a commercially available function. Although there are various methods to approximate this integral, for example [1], it would not be computationally efficient to implement these in Visual Basic. This means that the developer would have to write the function in another language say C++ and then call it from Excel [3]. Since this approach could be time consuming and error prone it might be more cost effective to make use of commercially available software [4]. However, once the choice has been made a rainbow pricing function (say bs_opt_rainbow) can be added to the Paste Function facility in a similar way to how the function bs_opt was created. This approach can be used to customise Excel to the needs of particular individuals or companies and can also greatly enhance the power of Excel for financial analysis. George Levy is a numerical analyst at NAG Ltd UK, he can be contacted at
[email protected].
References rd
[1] J C Hull, Options, Futures and other Derivatives, Prentice Hall International Inc, 3 Edition 1997. [2] R McIntyre, Black-Scholes will do, Energy Power and Risk Management, November 1999. [3] G F Levy, Calling 32-bit NAG C DLL functions from Visual Basic 5 and Microsoft Office, NAG Technical Report, TR2/98, 1998 [4] Such as the G01 chapter of the NAG Numerical Library form NAG Ltd and NAG Inc.