Based on empirical distributions of Web- page degrees, we derived analytically the probability distribution for the. Pagerank metric. We found out that it follows ...
Deriving and Verifying Statistical Distribution of a Hyperlink-Based Web Page Quality Metric Devanshu Dhyani, Sourav S. Bhowmick, and Wee Keong Ng School of Computer Engineering, Nanyang Technological University, Singapore 639798 {assourav, awkng}@ntu.edu.sg
Abstract. In this paper, we discuss issues related to metrics for Web page quality. These metrics are used for ranking the quality and relevance of Web pages in response to user needs. We focus on the problem of ascertaining the statistical distribution of some well-known hyperlink based Webpage quality metrics. Based on empirical distributions of Webpage degrees, we derived analytically the probability distribution for the Pagerank metric. We found out that it follows the familiar inverse polynomial law reported for Webpage degrees. We verified the theoretical exercise with experimental results that suggest a highly concentrated distribution of the metric.
1
Introduction
The significance of a Web page can be viewed from two perspectives—its relevance to a specific information need such as a user query, and its absolute quality irrespective of particular user requirements. Relevance metrics relate to the similarity of Web pages with driving queries using a variety of models for performing the comparison. Quality metrics typically use link information to distinguish frequently referred pages from less visible ones. Specifically, a well-known set of metrics for measuring the quality of Web pages is based on hyperlink citations, for example Pagerank [2] and Authorities/Hubs [4]. As these measures depend upon Web page in and out-degrees, knowledge of degree distribution can lead to their probability density functions. In this paper, we study the measurement of hyperlink information at a microscopic level in assessing the quality or relevance of page. We demonstrate an approach for deriving the distribution of Pagerank from the empirical distributions of topological primitives. We also experimentally verify the probability distribution of Pagerank. There are several reasons why this exercise is instructive. Firstly, it illustrates a generic methodology that can be extended to other hyperlink metrics. Secondly, a distribution derived theoretically from observations of more primitive determinants is likely to be more reliable than an empirically obtained one that is inextricably linked to the experimental setup. This conforms with the conventional wisdom of making measurements as fundamental as possible before deriving more comprehensive metrics. Additionally, in the case of Web hyperlink metrics such as Pagerank, we R. Cicchetti et al. (Eds.): DEXA 2002, LNCS 2453, pp. 19–28, 2002. c Springer-Verlag Berlin Heidelberg 2002 �
20
D. Dhyani, S.S. Bhowmick, and W.K. Ng
avoid running computationally expensive algorithms. Finally, a theoretical distribution serves as a model that can help us predict precisely and consistently the effect of changes in certain parameters without incurring the cost of carrying out complex measurements again.
2
Distribution of Quality Metrics
Quality measures depend upon Web page in and out-degrees, knowledge of degree distribution can lead to their probability density functions. Knowing, say the cumulative distribution of Pagerank for the Web FR , one can determine the number of high-quality pages according to some threshold say r, given the size of the Web N . That is, the number of pages with Pagerank greater than r can be estimated as N � = N · Pr(R > r) = N (1 − FR (r)). The value of N � can be useful for crawlers looking for high quality Web pages in deciding optimum size versus quality configurations for search engine indexes. The distribution can also help Web crawlers give greater priority to visiting more important, high quality pages first. In this section, we demonstrate an approach for deriving the distribution of Pagerank from the empirical distributions of topological primitives. We first revisit the formulation of Pagerank and explain its key determinants. The Pagerank Ri of a page i having in-degree n can be defined in terms of the Pagerank of each of the n neighboring pages and their out-degrees. Let us denote by j (1 � j � n), the index of neighboring pages that point to i and by Xj the outdegree of page j. Then for a fixed parameter d in [0,1] the Pagerank Ri of i is �n R given as Ri = (1 − d) + d j=1 Xjj . We refer to d (0 � d � 1) as the damping factor for the calculation of Pagerank. We derive the distribution of a simplified version of Pagerank, ignoring the recurrent relationship of Ri with the Pagerank of other pages Rj and assuming the formulation to be Ri = (1 − d) + d
Ni � 1 Xj j=1
(1)
Computationally, the determination of Pagerank for a graph of k pages can be seen as equivalent to the steady state solution (n → ∞) of following matrix product relationship: 1 1 1 x11 · · · xi1 · · · xk1 n n+1 1 1 1 R1 R1 1−d · · · · · · x x x i2 k2 n R2n+1 1 − d 12 R2 .. = .. + d .. .. .. · .. . . . . . . 1−d Rkn Rkn+1 1 1 1 · · · · · · x1k xik xkk where Rin denotes the Pagerank of page i at the nth iteration and xij the number of links from page i to j. If there are no outgoing links from page i to j,
Statistical Distribution of a Hyperlink-Based Web Page Quality Metric
21
i.e., xij = 0, then the corresponding entry in the matrix (1/xij ) is set to zero. Repeated multiplication of inverse out-degree matrix with the Pagerank vector yields the dominant eigenvector of the latter. Pagerank can thus be seen as the stationary probability distribution over pages induced by a random walk on the Web, that is, it represents the proportion of time a “random surfer” can be expected to spend visiting a page. It is clear that the steady state distribution of the Pagerank vector (Rin ) depends entirely on the value of d and the right hand vector of inverse out-degrees. Our simplification of Equation 1 aims at finding the distribution of this vector at n = 0. The distribution of (Ri1 ) gives us an idea of the steady state distribution at n → ∞ which can itself be obtained by applying the above computation on the initial distribution. We further assume that initially Pagerank is uniformally distributed, that is, Ri0 = 1/k for all i (1 � i � k). We interpret Ri , Xj and Ni in Equation 1 as random variables denoting Pagerank of i, the out-degree of j and the in degree of i respectively. Although both Xj and Ni are known to have the same distribution, Xj is continuous while Ni is discrete. It is clear that Ri for all values of i are identically distributed. The same holds for the in- and out-degrees denoted by Xj and Ni . We therefore represent the common probability densities of these sets of random variables as fR (r), fX (x) and fN (n) respectively. The problem now is to find the density fR (r) given the relationship of Ri with Xj and Ni as represented by Equation 1. 2.1
The Lotka Density
The derivation of the distribution of Pagerank is based on observations of distribution of Web page degrees. These measurements carried out on Webgraphs by Broder et al [1] and Kleinberg et al [5] have been reported to follow the well-known Lotka distribution. The Lotka density is given as C if x � 1, α x fX (x) = 0 otherwise. where α ≈ 2 and C is a constant. In our derivation, we invoke both the continuous and discrete versions of this law. Here we distinguish between the two and examine the implications of each. If we interpret X as a continuous random variable, the constant C is found using the
∞ fact that the area under a probability density curve sums to unity. That is, −∞ fX (x)dx = 1. Applying this to the continuous Lotka density above, we have � ∞ C dx = 1 (2) 2 x 1 Solving this we obtain C = 1. The continuous version of Lotka’s law can then simply be stated as follows: 1 if x � 1, 2 fX (x) = x 0 otherwise.
22
D. Dhyani, S.S. Bhowmick, and W.K. Ng
In the case of the discrete� version, the integral of Equation 2 changes to ∞ the constant C from a discrete summation, hence, x=1 xC2 = 1. If we factor �∞ −2 the summation on the left, we are left with the sum which is the x=1 x well-known Riemann zeta function ζ(2). Several analytical methods exist for computing the zeta function. Here we use the following general definition for even n−1 n n |π where |Bn | is a Bernoulli number. arguments, i.e., n ≡ 2k, ζ(n) = 2 |B n! π2 Given B2 = 1/6, we have for n = 2, ζ(2) = 6 . Substituting this we obtain the 1 = π62 ≈ 0.608. expression for C as C = ζ(2) Although the in- and out-degree distributions on the WWW have been discovered principally as discrete distributions, we apply the continuous approach in examining the relationship between degree and Pagerank distributions because the apparatus of infinitesimal calculus makes the mathematical formulation easier. Indeed, as the number of pages being considered increases, the differences between the continuous and discrete approaches become insignificant. To approximate the Lotka distribution function FX (x) = Pr(X � x), we integrate the density
x
x 1 function 1fX (·) within the continuous range (1, ∞): FX (x) = f (z)dz = dz = 1 − x . 1 X 1 z2 2.2
The Pagerank Distribution
The non-recurrent definition of Pagerank in Equation 1 may be viewed as a composition of three primitive functions of random variables enumerated below. The inverse of individual out-degrees of pages: The individual out-degrees are independent identically distributed random variables, Xj with the index j ranging from 1 to the in-degree of the page being considered. If we represent the inverse of the out-degree of the j th neighboring page as a random variable Yj then, Yj = X1j . It is known that the density of out-degrees, fX (x) is the Lotka function introduced earlier. We denote the density function of Yj as fY (y), since Yj is identically distributed for all j. The sum of out-degree inverses: We denote �Ni by a random variable Zi , the sum of out-degree inverses Yj . That is, Zi = j=1 Yj . The upper limit to the sum is itself a random variable denoting the out-degree of the page in question. Fortunately, this random variable Ni , the out-degree of page i, is Lotka distributed. We must note however, that Ni is necessarily a discrete random variable as must any index to a discrete summation. Thus, Ni has the probability density obtained earlier for the Lotka distribution 6 1 if n � 1, 2 n2 π fN (n) = 0 otherwise. Finally, the Pagerank function of Equation 1 can be expressed as a linear function of the random sum Zi above as Ri = (1 − d) + dZi
(3)
Statistical Distribution of a Hyperlink-Based Web Page Quality Metric
23
We now determine the densities of the random variables Yi , Zi and Ri introduced above. Consider Yi , the inverse of Xi that represents the out-degree of page i. We first note that Yi is a strictly decreasing function in the range of Xi (with the latter defined on positive values only). The probability distribution of Yj can be expressed in �terms of� the distribution of Xj as follows FY (y) = � � Pr(Yj � y) = Pr X1j � y = Pr Xj � y1 since X1j is strictly decreasing = � � � � 1 − Pr Xj < y1 = 1 − FX y1 . Differentiating this to convert to probability � � � � � � d d 1 1 1 densities, we have: fY (y) = dy = FY (y) = −fX y1 dy f y y 2 X y . Substituting the Lotka continuous density function for fX (·) to the above result and applying the range [1, ∞] to the argument 1/y, we obtain the uniform density for Yj over the converted range (0, 1]. 1 if 0 < y � 1, fY (y) = 0 otherwise.
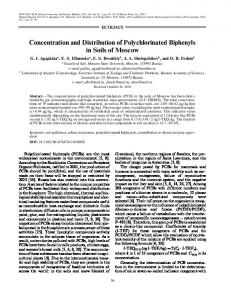
The above result, that the inverse of a Lotka distributed random variable has a uniform distribution is an interesting coincident. Intuitively it implies that even though the probability that the out-degree of a page is in a given range follows an inverse square law, the probability of out-degree inverse is uniformally . distributed, i.e., independent of the value of Yj� n The sum of out-degree inverses Zi given by j=1 Yj has a variable number of terms equal to n, the number of pages that point to i or the out-degree of i. We model the limit of the summation itself as a discrete random variable Ni . Such a sum is commonly referred to as a random sum. As noted earlier, Ni is Lotka distributed and similar to Xi except that the distribution here is the discrete version of the Lotka function. Note that Zi for all values of i are identically distributed so the common density can be denoted fZ (z) as done earlier for the random variables Xi and Yi . We first find the density of Zi conditioned on the summation limit Ni , that is fZ|N (z|n). A sum of random variables has a density which is the convolution of the densities of individual random variables. For n identically distributed summands, this specializes to the n-fold convolution of their common density, in this case (n) (1) fY (y). This n-fold convolution fY (y) is defined recursively as follows: fY (y) =
∞ (n) (n−1) fY (y) and fY (y) = −∞ fY (y − u)fY (u)du for n > 1. The above definition can be applied to fY (y) derived earlier to obtain the following formula for the density of the random sum Zi conditioned upon the out-degree of page i. Figure 1 shows the n-fold convolutions of the uniform density for several values of n. Observe that for higher values of n, the curve flattens out resembling a normal distribution. This is predicted by the central limit theorem which states that the sum of n independent random variables tends to a uniform distribution as (n) n → ∞, fZ|N (z|n) = fY (y) where
24
D. Dhyani, S.S. Bhowmick, and W.K. Ng
Convolutions 1 n=2
0.8 n=4
0.6
n=6 n=8
0.4
n = 10
0.2 0
0
1
2
3
4
5
6
7
8
9
10
Fig. 1. Convolutions of n uniform densities.
(n)
fY (y) =
�� x � 1 j n (x − j)n−1 if 0 < x < n, (−1) j (n − 1)! j=0 0
otherwise.
By the law of total probability, the continuous marginal density of the sum �∞ (n) Zi can be found as fZ (z) = n=1 fZ|N (z|n) · fN (n). Substituting for the above expression for fZ|N (z|n) and the discrete Lotka density for fN (n) we have �� ∞ x � � 1 j n 6 (x − j)n−1 if 0 < x < n, (−1) j fZ (z) = π 2 n=1 n2 (n − 1)! j=0 0 otherwise. It is difficult to simplify the above summation since the inner sum does not have a closed form. Figure 2 shows the approximate curve for the density fZ (z). The parameter n0 represents the minimum in-degree considered for computing the random sum. Notice that the sharp peak for the curve n0 = 2 occurs due to the influence of the 2-fold convolution of Figure 1. For higher starting values of n, signifying more densely connected pages the curve becomes more even. Finally, to derive the density fR (r) of a linear function of Zi , we adopt a similar approach as before for finding the density of out-degree inverse, except that the function φ(Zi ) = 1 − d + dZi is strictly increasing. �We have from� Equation 3 FR (r) = Pr(Ri � r) = Pr(1 − d + dZi � r) = Pr Zi � r−1 d +1 since φ is strictly increasing. Therefore, � � r−1 +1 (4) = FZ d
Statistical Distribution of a Hyperlink-Based Web Page Quality Metric
25
Random sum 0.35 n0
0.3
>2
0.25 0.2 0.15 n0
0.1
>3 n0
>4 n0
0.05
>5 n0
>6
0 0
2
4
6
8
10
12
Fig. 2. Density of a sum of uniformally � distributed random variables. Each curve represents the density function given by ∞ n=n0 fZ|N (z|n)fN (n). For computation purposes we approximated the upper limit to be n = 20.
and differentiating to obtain probability density, d d FR (r) = fZ (φ−1 (r)) (φ−1 (r)) dr � dr � r−1 1 +1 = fZ d d
fR (r) =
(5)
Figure 3 shows the unnormalized Pagerank distribution FR (r) denoting the probability Pr(R < r). For n0 = 2, nearly two-thirds pages have a Pagerank within 10% of its total range which means that Pagerank follows a highly concentrated distribution as do Web page in- and out-degrees. This confirms our earlier conjecture that Pagerank distribution is affected by the degree distributions.
3
Experimental Verification
We have conducted experiments to verify the theoretical exercise of the previous section. We summarize our results here. Detailed discussion on the experiments is given in [3]. We do so in two parts—first we verify that Web page out-degrees follow a Lotka distribution and then compare the derived theoretical distribution for Pagerank with the observed distribution of the metric, computed over a given sample of pages. Our experiments required large crawls of the WWW and were undoubtedly limited by the scale of available computing resources, primarily memory and network bandwidth. Our crawls were different from those performed by a typical search engine in that they did not download pages for storage, but merely obtained the url and hyperlink connectivity of visited pages. Web crawls
26
D. Dhyani, S.S. Bhowmick, and W.K. Ng
Pagerank distribution 0.6 n0 = 2
0.5 0.4 0.3
n0 = 3
0.2 0.1 0
0
2
4
6
8
10
12
14
16
18
20
Fig. 3. Derived Pagerank probability distribution FR (r) with parameter d = 0.5 for two values of minimum in-degree n0 .
for our experiments were performed using a Java-based toolkit for developing customized crawlers, known as sphinx (for Site-oriented Processors for html Information) [6]. To test the power law phenomenon which serves as our own starting hypothesis in the theoretical determination of Pagerank distribution, we conducted experiments on a crawl of over 2000 pages. A log-log plot of outdegree distributions is shown in Figure 4. This plot appears linear as expected for a power law distribution. We computed the Pagerank of over 2000 pages (β = 40) with the objective of confirming the theoretically derived distributions of the previous section. Following graph completion, the computation converged with residual error below a threshold of 10−4 . We used a damping factor of 0.5. A log-log frequency plot of Pagerank values suggests that Pageranks also follow a power law distribution. We confirmed this intuition by fitting the observed Pagerank distribution with a power law function shown in Figure 5. Finally, we present in Figure 6 the comparison of the cumulative Pagerank distribution with its theoretically derived counterpart FR (r) from the previous section (see Equation 4). As mentioned earlier, the theoretical expression for Pagerank distribution employs infinite convolutions of uniform densities. For computation purposes, we approximated this with a limit of 20-fold convolution. The derived cumulative distribution was obtained by integrating the area under the density curve of Equation 5 using the trapeziod rule. We see that the observed distribution of Pagerank compares reasonably with the distribution of Equation 4, derived from out-degree distributions.
Statistical Distribution of a Hyperlink-Based Web Page Quality Metric
27
Degree distribution 1000
100 Frequency 10
1
1
10
100
1000
Fig. 4. Log-log plot of out-degree distribution of 2024 Web pages in the NTU domain. Pagerank distribution 50
Observed Fitted
45 40 35 30 Frequency 25 20 15 10 5 0
0
0.002
0.004
0.006
0.008
0.01
Fig. 5. Pagerank distribution for 1889 pages in the NTU domain fitted to the analytical curve y = αx−β where α = 1.7 × 10⁻¹⁰ , β = 3.43. Goodness of fit parameters: χ2 = 47.78, asymptotic standard errors for α and β were 180.9%, 6.84% respectively.
4
Conclusions
In this paper we treated the problem of ascertaining the statistical distribution of some well-known hyperlink based Webpage quality metrics. Based on empirical distributions of Webpage degrees, we derived analytically the probability distribution for the Pagerank metric and found it to follow the familiar inverse polynomial law reported for Webpage degrees. We verified the theoretical exercise with experimental results that suggest a highly concentrated distribution of the metric. Our work on distributions of hyperlink metrics can be extended
28
D. Dhyani, S.S. Bhowmick, and W.K. Ng
Pagerank Distribution 1
observed derived
0.9 0.8 0.7 0.6 0.5 0.4 0.3 0.2 0.1 0
0
0.1
0.2
0.3
0.4
0.5
0.6
0.7
0.8
0.9
1
Fig. 6. Theoretical probability distribution function of Pagerank (computed with 20fold convolution) and the observed normalized cumulative distribution of NTU Pagerank for a crawl of 2026 pages.
by conducting similar exercises for other types of significance metrics for both quality and relevance. It is not clear whether the high concentration depicted by hyperlink metrics is a special consequence of the power law behavior of Webpage degrees or the manifestation of a general regularity in Webpage significance, irrespective of the metric in particular.
References 1. A. Broder, R. Kumar, F. Maghoul, P. Raghavan, S. Rajagopalan, R. Stata, A. Tomkins, J. Wiener. Graph Structure of the Web. Proceedings of the Ninth World Wide Web Conference, Amsterdam, Netherlands, May 2000. 2. S. Brin, L. Page. The Anatomy of a Large-Scale Hypertextual Web Search Engine. Proceedings of the Seventh World Wide Web Conference, Brisbane, Australia, April 1998. 3. D. Dhyani. Measuring the Web: Metrics, Models and Methods. Master’s Dissertation, School of Computer Engineering, Nanyang Technological University, Singapore, 2001. 4. J. Kleinberg. Authoritative Sources in a Hyperlinked Environment. Proceedings of the ACM-SIAM Symposium on Discrete Algorithms, 1998. 5. J. Kleinberg, R. Kumar, P. Raghavan, S. Rajagopalan, A. Tomkins. The Web as a graph: measurements, models, and methods. Proceedings of the Fifth International Conference on Computing and Combinatorics, COCOON , Tokyo, Japan, July 1999. 6. R. Miller, K. Bharat. sphinx: A framework for Creating Personal, Site-specific Web Crawlers. Proceedings of the Seventh International World Wide Web Conference, Brisbane, Australia, April 1998.