Sep 1, 2000 - s Generation of LQN performance model by graph transformations ... q nested services are allowed (a server is also a client to other servers) ..... q Check if the detailed behaviour conforms to the pattern indicated by the ...
Deriving Performance Models from UML Models by Graph Transformations Dr. Dorina Petriu Carleton University Department of Systems and Computer Engineering Ottawa, Canada, K1S 5B6 http://www.sce.carleton.ca/faculty/petriu.html
September 2000
WOSP’2000
1
Outline ■
Background ●
■ ■
Methodology for performance model derivation Software execution model ● ●
■
represented by UML activity diagrams automatic generation of activity diagrams from sequence diagrams by graph transformations
Generation of LQN performance model by graph transformations ● ●
■
Layered Queueing Network (LQN) performance models
LQN model structure LQN model parameters
Conclusions
WOSP’ 2000
©Dorina Petriu
2
Motivation ■
Software Performance Engineering (SPE) [Smith90]: ●
●
■
Why SPE is not frequently applied in practice: ● ●
■
integrate performance evaluation into the software development process from the early stages throughout the whole life-cycle requires the construction and analysis of performance models cognitive gap between the software development domain and the performance analysis domain pressure for “shorter time to market” leaves no time for SPE
Present research: automate the derivation of LQN performance models from UML design models: ● ●
LQN model structure generated from high-level software architecture LQN model parameters from software execution model (activity diagrams).
WOSP’ 2000
©Dorina Petriu
3
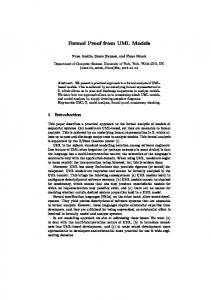
Layered Queueing Network (LQN) ■
LQN is an extended Queueing Network model: ●
● ● ● ● ●
■ ■
both software tasks and hardware devices are represented (drawn as parallelograms and circles) nested services are allowed (a server is also a client to other servers) software components have entries corresponding to different services arcs represent service requests synchronous and asynchronous requests multi-servers used to model components with internal concurrency
Typical LQN results: throughputs, response times, utilization. LQN use: ● ●
Client_1
Proc 1
Client_2
Application
Proc 2
Database Proc 3
Disk 1
Disk 2
for identigying and eliminating bottlenecks Example: LQN model of a which limit the system performance three-tiered client-server system for capacity planning and scalability analysis.
WOSP’ 2000
©Dorina Petriu
4
Types of LQN messages and phases Client
Client
synchronous message
phase1 (service)
reply
Server
Server
busy included services
phase2 phase3 (autonomous phases)
idle
a) LQN synchronous message
Client
Client
asynchronous message
phase1
Server
Server
busy phase2
phase3
idle
included services
b) LQN asynchronous message Client
Client
synchronous message
Server1
Server1 busy
phase1
phase2
idle reply to original client
forwarding
Server2 busy
idle
phase1
phase2
Server2
idle
c) LQN forwarding message WOSP’ 2000
©Dorina Petriu
5
Methodology ■
■
Our transformation from UML to LQN follows the general Software Performance Engineering approach [Smith90] First select the main use cases to be modelled. ●
■
Probabilities of selected use cases will determine the workload mix (similar to [Cortellessa+00]) .
The software execution model is represented as UML activity diagrams. ●
●
●
The activity diagrams are automatically derived by graph transformations from a set of interaction (sequence) diagrams that describe the system behaviour. The activity diagrams are partitioned in swimlanes corresponding to different software components responsible for various activities. The resource demands are represented as activity attributes.
WOSP’ 2000
©Dorina Petriu
6
Methodology (cont) ■
The structure of the LQN performance model is derived from the high level architecture of the UML model. ● ●
●
●
■
LQN nodes represent both software and hardware entities Architectural patterns given as UML collaborations describe the interaction between concurrent components. Graph transformations from different UML collaborations are used to generate the LQN structure UML component and deployment diagrams are used to determine the allocation of software components to hardware devices.
LQN parameters are obtained by aggregating the resource demands for different activity diagram partitions that correspond to LQN entries and phases. ●
The aggregation follows the rules from [Smith90] and is performed by graph transformations.
WOSP’ 2000
©Dorina Petriu
7
Outline ■
Background ●
■ ■
Methodology for performance model derivation Software execution model ● ●
■
represented by UML activity diagrams automatic generation of activity diagrams from sequence diagrams by graph transformations
Generation of LQN performance model by graph transformations ● ●
■
Layered Queueing Network (LQN) performance models
LQN model structure LQN model parameters
Conclusions
WOSP’ 2000
©Dorina Petriu
8
Top level sequence diagram for e-commerce application s:serverSocket
m:mainServerThread
:client listen() connectionRequest()
iteration box
callback() accept() new w:workerThread * [forever] write(menu)
iteration box
get(serviceRequest)
iteration expression reqType := checkRequest()
[reqType = registration] Customer Registration
composite subdiagram
[reqType = browse] Browse [reqType = add | reqType = drop ] Add/drop product [reqType = buy] Checkout * [reqType != done]
iteration expression WOSP’ 2000
[reqType= done] reply(endMsg)
©Dorina Petriu
9
Activity diagram corresponding to the previous SD server
client connect request
s.listen()
m.callback s.accept new(w)
w.write(menu)
menu
wait for request
unspecified service request
w. get(serviceRequest) w.reqType:=checkRequest() [reqType = done]
[reqType =registration] [reqType= browse]
reply(endMsg)
Customer registration
Browse
[reqType=add | reqType=drop ] Add/drop Product
composite activity [reqType = buy] Checkout
endMsg
unspecified
WOSP’ 2000
w.terminate
©Dorina Petriu
10
More detailed SD and corresponding AD Corresponding activity diagram
SD for the iteration box from the top-level diagram specialized for “registration”
client
workerthread
database
register w:workerThread
database
:client
Reply with registration form get(serviceRequest) reqType :=checkRequest()
form [to fill]
[reqType = registration] reply (registrationForm)
unspecified form [filled]
send(form) new
:customerAcct Create account and add to database
fillIn() reply(account)
addAccountt()
account
addAccount
* [reqType != done]
iteration expression
iteration box
composite subdiagram
Display account created
reply
account
WOSP’ 2000
©Dorina Petriu
11
SD to AD transformation principles for a single execution thread r
a) Sequential execution
m
n
a()
r
m.a n.b
b()
m a() c:= b()
b) Branch and merge
m.a n.b
n
[c=c1] d()
[c=c1]
[c=c2]
n.d
n.f
[c=c2] f() g() n.g
r
m
n
a()
c) Iteration (looping)
m.a b() *[loop condition] c() *[loop condition]
WOSP’ 2000
©Dorina Petriu
n.b n.c
12
SD to AD transformation principles for multiple execution threads r
m
n
a
a
a) Synchronous message send and reply
reply
m.action(a)
b()
reply
b) Asynchronous creation of an active object
s
n.b
r s.a new(m)
a() new
m
c()
n b() n.b
s.c
s
r
m
n
s.a
n.b
a()
c) Asynchronous message
b() c f()
c
d()
n.d r.action(c) s.f
WOSP’ 2000
©Dorina Petriu
13
Graph Transformations and PROGRES ■
■
■
We are using a known graph rewriting tool named PROGRES (PROgramming with Graph Rewriting Systems) [Schürr90, 94, 97] The essential idea of all implemented graph grammars or graph rewriting systems is that they are generalization of string grammars (used in compilers) or term rewriting systems. The terms “graph grammars” and “graph rewriting systems” are often considered synonymous, however: ● a graph grammar is a set of production rules that generates a language of terminal graphs and produces nonterminal graphs as intermediate results. ● a graph rewriting system is a set of rules that transforms one instance of a given class of graphs into another instance of the same class of graphs without distinguishing terminal and nonterminal results.
WOSP’ 2000
©Dorina Petriu
14
PROGRES Schema ■
■
■
PROGRES transforms an attributed input graph into an attributed output graph. The graph schema shows the types of nodes and edges composing a valid graph A set of production rules are applied in a controlled way in order to performs the graph transformations. ●
● ●
a production rule has a left-hand side defining a graph pattern that will be matched in the overall graph then replaced by the right-hand side nodes and edges can be deleted, added or modified a rule also shows how to compute the attributes of the new nodes from the attributes of the nodes that were replaced
WOSP’ 2000
©Dorina Petriu
15
Schema notation ■
PROGRES uses inheritance (possible multiple) to define hierarchies of node classes
■
Square boxes represent node classes (can have attributes) ● ●
■
Rounded-corner boxes represent node types ● ● ●
■
■
inheritance relationships are represented with dotted edges node classes correspond to abstract classes in UML connected with their uniquely defined classes by the means of dashed edges. node types are leaves of the node class hierarchy, and are used to create node instances in a PROGRES graph. a node type specializes only one class
Solid edges between edge classes represent edge types, which define the relationships between node instances. Node attributes are shown as small circles attached to the class or type boxes.
WOSP’ 2000
©Dorina Petriu
16
PROGRES Schema for SD to AD transformation Sequence Diagram Active
Sequence Diagram
integer Size
maps_to
Passive
INSTANCE
contains
Synch
Call
real
Asynch
real
Call Action
Reply
Send Signal
SIGNAL seq
Local Operation
ACTION
Create Action
RcvTime SendTime
arg sender receiver
dispatch
MESSAGE
effect
perform
owns
ll_next
Destroy Action
guarded
Component DIAGRAM string
Name
Return Action
maps_to
has cross_ref
flow
Activity Diagram
Activity Diagram
contains
Partition
owns
Initial state
Final state
Activity state
Init Action c_flow_in
STATE
SIMPLE STATE
COMPOSITE STATE
SubActivity state
Conditional Arc
CTRL BLOCK
d_in d_out
ObjFlow state
PARALLEL
Fork
WOSP’ 2000
Terminate Action
Guard Condition
MODEL ELEMENT
©Dorina Petriu
Join
c_flow
ALTERNATIVE
Merge
Branch
17
Example of a sequence diagram with concurrency
Corresponding activity diagram with swimlanes and objectflow y
x x.send(a)
receive synch msg
a
x
y a
u b()
fork new thread
y.receive(a) u.b() new(z)
object flow
z
new
new
z.init() new(v) [c = c2] [c = c1]
v
d() [c = c1] g() [c = c2] h()
f h()
receive asynch msg
r
1st thread
2nd thread
send asynch msg
delete(v)
3nd
thread
send reply
v.h()
v.g()
u.d()
z.delete(v) z.send(f)
f y.receive(f) u.h() y.send(r)
z.terminate()
r x.receive(r)
WOSP’ 2000
©Dorina Petriu
18
Example of PROGRES input graph SD comp2
comp1 x x
y a
a 1
u b()
:Send :Call
z
new
new
v
:Create
comp3
y
u
:Receive b 2 new 3
:Local
z
d() [c = c1] g()
:Call
d 5
[c = c2] h() f
:Create :Local :Call
delete(v)
h()
:Call
r
:Destroy 1st thread comp1
2nd thread comp2
3nd thread comp3 :Call :Receive r 10
WOSP’ 2000
©Dorina Petriu
:Receive f 8 h 9 :Send
v
:Init new 4
:Local
Guard g :Local 6 Guard h :Local 6 delete :Local 7
:Send :Local
:Terminate
Not all edges sender, receiver and perform are shown.
19
Detailed mapping from SD to PROGRES graph SD comp2
comp1 se
x y a
perform
u
iv r rece
er
y
u
perform
:Receive 1 effect a seq b :Send 2 :Call new :Create 3 disp
b() new
z new
v
ll_next
x
nd e
comp3
z :Local
d() [c = c1] g()
:Call
d 5
[c = c2] h() f
:Create :Local :Call
delete(v)
h()
:Call
r
:Destroy 1st thread comp1
2nd thread comp2
3nd thread comp3 :Call :Receive r 10
WOSP’ 2000
©Dorina Petriu
:Receive f 8 h 9 :Send
v
:Init new 4
:Local
Guard g :Local 6 Guard h :Local 6 delete :Local 7
:Send :Local
:Terminate
Not all edges sender, receiver and perform are shown.
20
Generating an AD: apply “top” rule (1) contain
comp2
comp1
comp3
y
:Send
u
b 2
:Call
z :Local new 3
:Create
maps-to
z
a 1 :Receive
comp3
maps-to
new
y
maps-to
b()
owns
owns
x
ins
maps-to
a
u
conta
comp2
comp1
owns
x
SD
s
:Init
AD x.send(a)
partition1 owns
a
partition2
partition3
owns
x:InitialSt
y:InitialSt
y.receive(a) u.b() new(z)
z.init()
WOSP’ 2000
©Dorina Petriu
21
Generating an AD: apply “synchr. message” rule (2) SD comp2
comp1 x
y a
comp3 u
x perform
b() new
z
comp2
comp1
:Send
se n
de
re c
r
er ei v
y
comp3
u
perform a 1 effect dispatch :Receive b 2 :Call
z :Local new 3
:Create
:Init
AD x.send(a)
partition1 owns
a flow
x:send
d_in
d_out
a:ObjFlow
u.b()
partition3
owns
x:InitialSt y.receive(a)
partition2 y:InitialSt flow
:Join flow
y.receive(a)
new(z)
z.init()
WOSP’ 2000
©Dorina Petriu
22
Generating an AD: apply “operation call” rule (3) SD
y a
u
y
x a 1 :Receive seq
:Send
er
z
:Call
comp3
u
d sen
b() new
comp2
comp1
ive r
x
comp3
rec e
comp2
comp1
perform
b 2
dispatch
z :Local effect
:Create
new 3
:Init
AD x.send(a)
partition1 owns
a
flow
x:send
d_in
d_out
a:ObjFlow
u.b()
partition3
owns
x:InitialSt y.receive(a)
partition2 y:InitialSt flow
:Join flow
y.receive(a) flow
new(z)
u.b()
z.init()
WOSP’ 2000
©Dorina Petriu
23
Generating an AD: apply “create thread” rule (4) SD comp2
comp1 x
y a
comp3 u
y
x
owns r
:Send
u de
z
comp3
n se
a 1 :Receive
b() new
comp2
comp1
b 2
:Call :Create
:Local new 3
dispatch
er eiv c re
effect
z perform
:Init
AD x.send(a)
partition1 owns
a
flow
x:send
d_in
d_out
a:ObjFlow
u.b()
partition3
owns
x:InitialSt y.receive(a)
partition2 y:InitialSt flow
:Join flow
y.receive(a)
owns
flow
new(z)
u.b() flow
new(z) flow
z.init()
:Fork WOSP’ 2000
©Dorina Petriu
flow
24
Outline ■
Background ●
■ ■
Methodology for performance model derivation Software execution model ● ●
■
represented by UML activity diagrams automatic generation of activity diagrams from sequence diagrams by graph transformations
Generation of LQN performance model by graph transformations ● ●
■
Layered Queueing Network (LQN) performance models
LQN model structure LQN model parameters
Conclusions
WOSP’ 2000
©Dorina Petriu
25
Architectural patterns ■
The literature identifies a relatively small number of architectural patterns which describe the collaboration between high-level concurrent components: ● ● ● ● ● ●
■
pipe and filters client server broker layers critical section master-slave
The high-level architecture of a software system as described by architectural patterns will determine the structure of an LQN performance model. ●
LQN nodes represent concurrent components or high-level objects and hardware devices.
WOSP’ 2000
©Dorina Petriu
26
UML diagrams for generating the LQN structure ■
Collaboration ●
●
●
■
an abstraction mechanism used to represent architectural patterns represents “a society of classes, interfaces, and other elements that work together to provide some cooperative behaviour that is bigger than the sum of all of its parts” a collaboration has two aspects: structural and behavioural (only the structure is used to generate the LQN nodes)
Deployment diagram with component instances ● ●
identifies runtime component instances shows their allocation to physical devices (LQN nodes represent both software and hardware entities)
WOSP’ 2000
©Dorina Petriu
27
UML collaboration: Forwarding Broker pattern 1..n
client
Client
client
fwd-broker
server
req_service_k()
service_k() Client Server Broker
Broker
fwd-broker
FWD_BROKER
serve other requests reply() reply()
server
Server ...
service_k( ) ...
Structure
WOSP’ 2000
Behaviour
©Dorina Petriu
28
UML collaboration: Handle-Driven Broker pattern 1..n
client
client
Client
hd-broker
server
get_handle() Client Server Broker
Broker
HD_BROKER
service_k()
hd-broker
Server
return
server ... service_k( ) ...
Structure
WOSP’ 2000
©Dorina Petriu
Behaviour
29
Deployment diagram for e-commerce system Client
m1 bits/s
Client
Client
m3 bits/s
m2 bits/s r bit/sec
r bit/sec Server
Database
WOSP’ 2000
©Dorina Petriu
30
Transformation of Pipeline and Filters pattern to LQN UpStreamFilter DownStreamFilte
PIPELINE WITH MESSAGE filter1 UpStreamFilt
filter2
DownStreamFilter
filter1
filter2
All filters running on the same processor node
Structure
filter1
UpStreamFilter DownStreamFilter Buffer
filter2
write
read
PIPELINE WITH BUFFER
semaphore and buffer
proc UpStreamFilter 1..n
filter1
DownStreamFilter
Buffer
1..n
buffer write()
write() {sequential} read() {sequential}
read()
Filters running on different processor nodes
filter2
Note 1: only the structural view is used to transform a UML collaboration to LQN. Note 2: a pattern may produce different LQN models depending on factors such as processor allocation. (obtained from the deployment diagram) WOSP’ 2000
filter2
filter1
Structure
©Dorina Petriu
semaphore
proc1
write
read
proc2
31
Transformation of the basic Client-Server pattern to LQN Client Server
CLIENT SERVER
Client
Client 1..n
client1
client2
1..n
client2
client1 service2 () service1()
service1 service2
Server service2 ()
server
server service1() service2()
● ● ●
●
Each software process (client or server) is modelled as an LQN task Each server operation is modelled as an entry A client may request more than one server operation; each request is modelled as an LQN synchronous message arc. Auxiliary performance information: average execution time for each client and server entry; average number of requests associated with each LQN message arc.
WOSP’ 2000
©Dorina Petriu
32
Transformation of the Client-Server pattern with Forwarding Broker Client Server Broker
FWD_BROKER client1 Client
Client 1..n
1..n
forwarding broker
client2
client1 service2 () service1()
Server service2 () service1 service2
server
server
service1() service2()
Note 1: the broker (a midware component) is not explicitly represented in the architecture of the software under development (it is hidden inside the collaboration, as it is provided by the underlying middleware). WOSP’ 2000
client2
©Dorina Petriu
Note 2:the LQN model represents all the system layers used by the software. In this case, the broker is explicitly represented as a multi-server that has an entry for every server entry called. 33
Transformation of the Client-Server pattern with Handle-Driven Broker
Client Server Broker
HD_BROKER
Client
Client 1..n
client1
client2
1..n
client2
client1 service2 () service1()
handle-driven broker
Server service2 ()
service1 service2
server
server service1() service2()
WOSP’ 2000
©Dorina Petriu
34
Transformation of the Critical Section collaboration Users on the same processor node
...
user1
userN
Accessor Shared
semaphore and
CRITICAL SECTION
f1 f2 . . . fN critical sections
Accessor
Accessor
proc
user1
f1 ()
... Shared
userN
Users on different processor nodes
fN ()
...
user1
shared f1 () {sequential} f2 () {sequential} ... fN () {sequential}
semaphore
1
proc1
WOSP’ 2000
userN
©Dorina Petriu
f1
2 ... N
...
fN
procN
35
How to identify architectural patterns ❶ Recognize the pattern of interaction between participants from the detailed behaviour described in the activity diagrams ●
●
●
For example, client-server interactions are easy to recognize when the client sends a synchronous message to the server and waits for the reply Client-server interactions can also be realized through asynchronous messages - a little more difficult to identify. Some interaction patterns are more difficult to recognize, as for example pipeline with buffer, critical section, etc.
❷ The designer of the UML model indicates the architectural patterns used. ●
Check if the detailed behaviour conforms to the pattern indicated by the designer.
WOSP’ 2000
©Dorina Petriu
36
Graph rewriting approach with PROGRES ■ ■
The graph schema (see next slide) describes the valid node types/classes, node attributes and edge types. Each architectural component (instance) is converted to an LQN task, but the mapping is not bijective because: ● ●
■ ■ ■ ■ ■
an instance may generate more than one task (ex. critical section) instances may be hidden by some collaborations (ex. brokers)
Instance operations are converted to entries. Processors and devices obtained from the deployment diagrams become full-fledged nodes in LQN. Collaboration nodes have no LQN correspondent, but help deciding what kind of transaction to perform. A PROGRES transaction was defined for the translation of each architectural pattern into LQN (a transaction is atomic) Each transaction is composed of one or more production rules, which formally define the basic steps of graph transformations (left-hand-side is replaced by right-hand-side).
WOSP’ 2000
©Dorina Petriu
37
Schema for transformation from UML collaborations to LQN Collaborations CriticalSection shared
container
accessor
Pipeline with Message
Pipeline with Buffer
DoubleFilter filter
PIPELINE & FILTERS
upStrmFilter buffer
downStrmFilter NonShared
Shared
Active contains
Direct Client-Server
Processor
Handle-driven Broker
client
CLIENT_SERVER
server broker
Half-forwarding Broker
Device Forwarding Broker
COLLABORATION
PASSIVE string[0::n] string has
Multiplicity
ExecTime OPERATION
INSTANCE from
integer
Constraint
to
link
real string
CALL_EDGE
string
NbVisits real
Name
PORT_ENTRY
MODEL ELEMENT
COMP_TASK
LQN
has integer
ServiceTime
Multiplicity ARC_PARAM
Task
Entry
Device
integer Multiplicity
WOSP’ 2000
NbVisits
SeviceTime
ToName
real
FromName
out uses
out in
Sync
real
out in
Async
in Forward
string string real
©Dorina Petriu
38
Example: Production Rule for the Critical Section ‘1: Active
accessor
‘2: CriticalSect
shared
‘3: INSTANCE has
from
‘5: CALL_EDGE
to
‘4: Operation
:= 1’ = ‘1
2’: ‘2
3’ = ‘3
has
has uses
6’: Entry
uses
4’ = ‘4
10’: Device
out
7’: Sync transfer
WOSP’ 2000
in in
8’: Entry
6’.Name := ‘1.Name & “Entry”; 8’.Name := ‘4.Name & “CritSect”; 7’.FromName := 6’.Name; 7’.ToName := ‘5.Name; ©Dorina Petriu
out
9’ = Sync
7’.NbVisits := ‘5.NbVisits; 9’.ToName := 4’.Name; 9’.FromName := 8’.Name; 9’.NbVisits := 1; 10’.Name := ‘1.Processor;
39
Deployment diagram for a telecom system requests r bit/sec
Service Provider
s bit/sec
Database
ServiceProvider component instance contains several concurrent high-level object
WOSP’ 2000
©Dorina Petriu
40
Example: telecommunication system architecture UpStrmFilter DownStrmFilter PIPELINE Buffer
UpStrmFilter DownStrmFilter
PIPELINE WITH MESSAGE
WITH BUFFER
Stack
IO
StackIn
IOin
inBuffer
StackOut
IOout
outBuffer
doubleBuffer
ServiceProvider component
WOSP’ 2000
RequestHandler
UpStrmFilter DownStrmFilter Buffer
UpStrmFilter DownStrmFilter
PIPELINE WITH MESSAGE
1..n
Client Server
PIPELINE WITH BUFFER
CLIENT SERVER
ShMem1
ShMem2
alloc() {sequential} free() {sequential}
update() {sequential}
DataBase
Accessor Shared
Accessor Shared
CRITICAL SECTION
CRITICAL SECTION
©Dorina Petriu
Database component
41
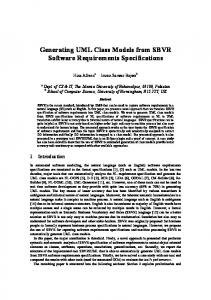
LQN model structure for the telecom system λ
StackIn
IOin Request Handler
Dummy Proc StackOut
StackExec
IOout
IOexec
update
DataBase
ShMem2 pull
push
alloc
Buffer
free
ProcDB
ShMem1 Proc
●
Obtained by graph transformation from the following UML diagrams ● high-level system architecture (described by UML collaborations) ● deployment diagram showing the allocation of software components to physical devices.
WOSP’ 2000
©Dorina Petriu
42
Outline ■
Background ●
■ ■
Methodology for performance model derivation Software execution model ● ●
■
represented by UML activity diagrams automatic generation of activity diagrams from sequence diagrams by graph transformations
Generation of LQN performance model by graph transformations ● ●
■
Layered Queueing Network (LQN) performance models
LQN model structure LQN model parameters
Conclusions
WOSP’ 2000
©Dorina Petriu
43
Deployment diagram for e-commerce system Client
m1 bits/s
Client
Client
m3 bits/s
m2 bits/s r bit/sec
r bit/sec Server
Database
WOSP’ 2000
©Dorina Petriu
44
LQN model for e-commerce system Client ProcC
Modem
Internet
1
2
3
4
5
6
Server
ProcS
1. Connect 2. Registration 3. Browse 4. Add/Drop 5. Checkout 6. Disconnect
Database
ProcDB
WOSP’ 2000
disk
©Dorina Petriu
45
AD partitioning: determine server entries and phases server
client connect request
s.listen()
request
The resource demands are aggregated separately for each area
m.callback s.accept new(w)
w.write(menu)
reply
entry1, phase 1 menu
wait for request
unspecified service request
w. get(serviceRequest) w.reqType:=checkRequest()
request
entry 2 - 5, phase 1
[reqType = done]
entry6, phase 1
[reqType =registration] [reqType= browse]
reply(endMsg)
reply
Customer registration
Browse
[reqType=add | reqType=drop ] Add/drop Product
[reqType = buy] Checkout
endMsg
unspecified
w.terminate
entry6, phase 2 WOSP’ 2000
©Dorina Petriu
46
Tool interoperability (1) UML Tool
UML Model
UML-XML to PROGRES Translator
Merge perf results with PROGRES models
Analysis Results
PROGRES Graphs
LQN Tool
PROGRES Tool
WOSP’ 2000
Performance Model
©Dorina Petriu
47
Tool interoperability (2)
UML Tool
UML Model
Ad-hoc graph transformations on UML models
Analysis Results
LQN Tool
Performance Model
WOSP’ 2000
©Dorina Petriu
48
Conclusions ■
We have defined and implemented separate PROGRES graph transformation for: ● ●
● ●
■
generating activity diagrams from sequence diagrams generating the LQN model structure from the high-level architecture (defined by collaborations and deployment diagrams) partitioning the activity diagrams in areas corresponding to different LQN tasks, entries and phases aggregating the resource demands for different activity diagram areas (as in the SPE methodology).
Currently working on: ● ● ●
Integrating the previous separate PROGRES transformations Extending the graph transformations for newer LQN features Tool interoperability (UML tool, PROGRES, LQN solver): ▼
WOSP’ 2000
obtain PROGRES input graphs from XML descriptions of UML diagrams produced by a UML tool, and vice-versa. ©Dorina Petriu
49
References [Allen+97] R.Allen, D. Garlan, “A Formal Basis for Architectural Connection”, ACM Transactions on Software Engineering Methodology, Vol.6, No.3, pp 213-249, July 1997. [Booch+99] G.Booch, J.Rumbaugh, I.Jacobson, The Unified Modeling Language User Guide, Addison-Wesley, 1999. [Buchmann+96] F. Buschmann, R. Meunier, H. Rohnert, P. Sommerlad, M. Stal, Pattern-Oriented software architecture: A System of Patterns, Wiley Computer Publishing, 1996. [Cortellessa+00] V. Cortellessa, R. Mirandola, “Deriving a Queueing Network based Performance Model from UML Diagrams”, Proceedings of the Second International Workshop on Software and Performance,Ottawa, Sept. 2000. [Franks+95] G. Franks, A. Hubbard, S. .Majumdar, D. Petriu, J. Rolia, C.M. Woodside, “A toolset for Performance Engineering and Software Design of Client-Server Systems”, Performance Evaluation, Vol. 24, Nb. 1-2, pp 117-135, November 1995. {MSC99] International Telecommunication Union: Formal description techniques (FDT) – Message Sequence Chart, ITU-T Z.120 (1999) [Petriu+98] D.C. Petriu, X. Wang "Deriving Software Performance Models from Architectural Patterns by Graph Transformations", in Theory and Applications of Graph Transformations, TAGT'98 (H.Ehrig, G.Engels, H.J. Kreowski, G. Rozenberg, Eds.) Lecture Notes in Computer Science 1764, pp.475-488, Springer Verlag, 2000. WOSP’ 2000
©Dorina Petriu
50
[Petriu+99] D.C. Petriu, X. Wang "From UML description of high-level software architecture to LQN performance models", in "Applications of Graph Transformations with Industrial Relevance AGTIVE'99" (eds. M.Nagl, A. Schuerr, M. Muench), Lecture Notes in Computer Science 1779, pp. 47-62, Springer Verlag, 2000. [Petriu+00b] D.C.Petriu, Y. Sun, “Consistent Behaviour Representation in Activity and Sequence Diagrams”, to appear in Proc. of UML’2000, York, GB, October 2000. [Petriu+00b] D.C.Petriu, C.Shousha, A. Jalnapurkar, "Architecture-Based Performance Analysis Applied to a Telecommunication System", to apper in I.E.E.E. Transactions on Software Eng.(special issue Workshop on Software and Performance), 2000. [Pooley+99] Pooley, R., Stevens, P.: Using UML: Software Engineering with Objects and Components, Addison Wesley Longman, 1999. [Ramesh+98] S.Ramesh, H.G.Perros, “A Multi-Layer Client-Server Queueing Network Model with Synchronous and Asynchronous Messages”, Proceedings of the First International Workshop on Software and Performance, Santa Fe, USA, pp.107-119, Oct. 1998. [Rolia+95] J.A. Rolia, K.C. Sevcik, “The Method of Layers”, IEEE Trans. On Software Engineering, Vol. 21, Nb. 8, pp 689-700, August 1995. [Rumbaugh +99] Rumbaugh, J., Booch, G., Jacobson, I.: The Unified Modeling Language Rreference Manual, Addison Wesley Longman, (1999) [Shaw96] M. Shaw, “Some Patterns for Software Architecture” in Pattern Languages of Program Design 2 (J.Vlissides, J. Coplien, and N. Kerth eds.), pp.255-269, Addison Wesley, 1996. WOSP’ 2000
©Dorina Petriu
51
[Schürr90] Schürr, A., “Introduction to PROGRES, an attributed graph grammar-based specification language”, In: M. Nagl (ed): Graph-Theoretic Concepts in Computer Science, Lecture Notes in Computer Science, Vol. 411, pp. 151-165, 1990. [Schürr94] Schürr, A., “PROGRES: A Visual Language and Environment for PROgramming with Graph Rewrite Systems, Technical Report AIB 94-11, RWTH Aachen, Germany, 1994. [Schürr97] Schürr, A.,: “Programmed Graph Replacement Systems”, In: G. Rozenberg (ed): Handbook of Graph Grammars and Computing by Graph Transformation, pp. 479-546, 1997. [Smith90] C.U. Smith, Performance Engineering of Software Systems, Addison Wesley, 1990. [Smith+97] C.U.Smith and L.G.Williams, “Performance Engineering Evaluation of OO Systems with SPE.ED”, in R. Marie et al.(eds), Computer Performance Evaluation - Modelling Techniques and Tools, Springer LNCS, pp.12-45, 1997. [UML1.3] OMG: Unified Modeling Language Specification, Version 1.3,1999. [Williams+98] L.G Williams, C.U.Smith, “Performance Evaluation of Software Architectures”, Proceedings of the First International Workshop on Software and Performance, Santa Fe, USA, pp.164-177, Oct. 1998. [Woodside89] C.M. Woodside, “Throughput Calculation for Basic Stochastic Rendezvous Networks”, Performance Evaluation, Vol. 9, Number 2, pp.143-160, April 1989. [Woodside+95] C.M. Woodside, J.E. Neilson, D.C. Petriu, S. Majumdar, “The Stochastic Rendezvous Network Model for Performance of Synchronous Client-Server-like Distributed Software”, IEEE Transactions on Computers, Vol.44, Nb.1, pp 20-34, January 1995. WOSP’ 2000
©Dorina Petriu
52